

Key Insights
The Field Install Connector market is poised for substantial growth, projected to reach USD 9.41 billion by 2025. This expansion is driven by a robust Compound Annual Growth Rate (CAGR) of 14.98%, indicating a strong and sustained upward trajectory. The escalating demand for high-speed data transmission across various sectors, including telecommunications, data centers, and enterprise networks, is a primary catalyst. The continuous advancement in fiber optic technology and the widespread deployment of 5G infrastructure are further fueling this growth, as field-installable connectors are critical for seamless and reliable fiber optic network construction and maintenance. Moreover, the increasing adoption of smart home technologies and the expansion of IoT devices necessitate robust and easily deployable connectivity solutions, directly benefiting the field install connector market. The trend towards simplified and faster on-site termination of fiber optic cables also plays a significant role in market expansion, as it reduces installation time and labor costs, making it an attractive option for network operators and installers.
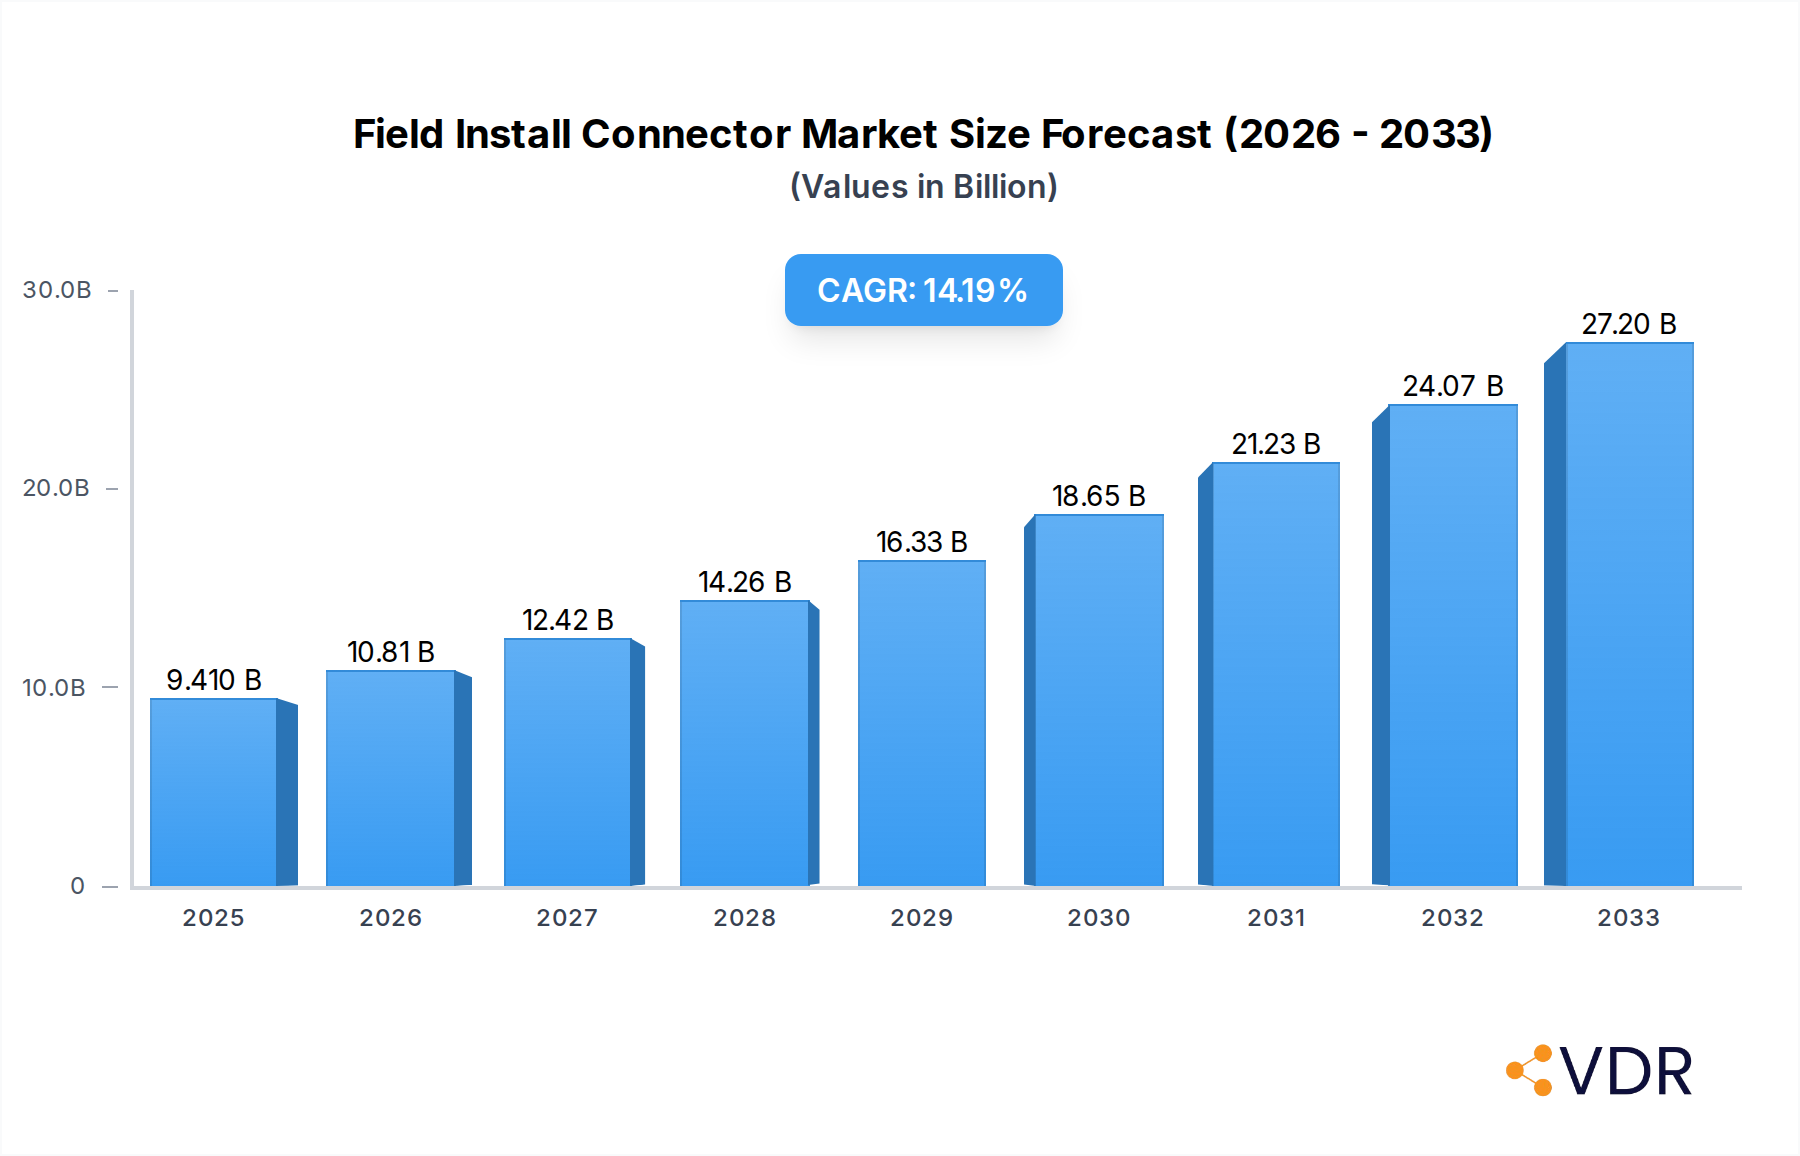
Field Install Connector Market Size (In Billion)
The market is segmented into mechanical and fusion splice types, catering to diverse installation needs and preferences. While mechanical connectors offer quick and easy termination, fusion splice connectors provide a more permanent and robust connection, each finding its niche in different application environments. Applications span residential, commercial, public, and other sectors, reflecting the pervasive need for reliable fiber optic connectivity. Geographically, the Asia Pacific region is expected to dominate, driven by rapid digitalization, significant investments in 5G networks, and the burgeoning demand from emerging economies. North America and Europe are also substantial markets, propelled by ongoing network upgrades and the increasing adoption of high-speed internet services. Key players like Amphenol, Molex, CommScope, TE Connectivity, and Corning are at the forefront, innovating and expanding their product portfolios to meet the evolving demands of this dynamic market. The competitive landscape is characterized by strategic partnerships, mergers, and acquisitions aimed at enhancing market reach and technological capabilities.

Field Install Connector Company Market Share
Comprehensive Field Install Connector Market Report: Navigating Growth, Innovation, and Regional Dominance
This in-depth report provides a definitive analysis of the global Field Install Connector market, a critical component within the broader fiber optic connectivity landscape. Covering the Study Period 2019–2033, with a Base Year of 2025 and a Forecast Period of 2025–2033, this research delves into market dynamics, growth trends, regional dominance, product innovations, and the strategic initiatives of key players. We meticulously examine the child market of fiber optic connectors, highlighting the unique value proposition and expanding applications of field-installable connectors. The report leverages extensive data and expert insights to deliver actionable intelligence for stakeholders across the telecommunications, networking, and IT infrastructure sectors.
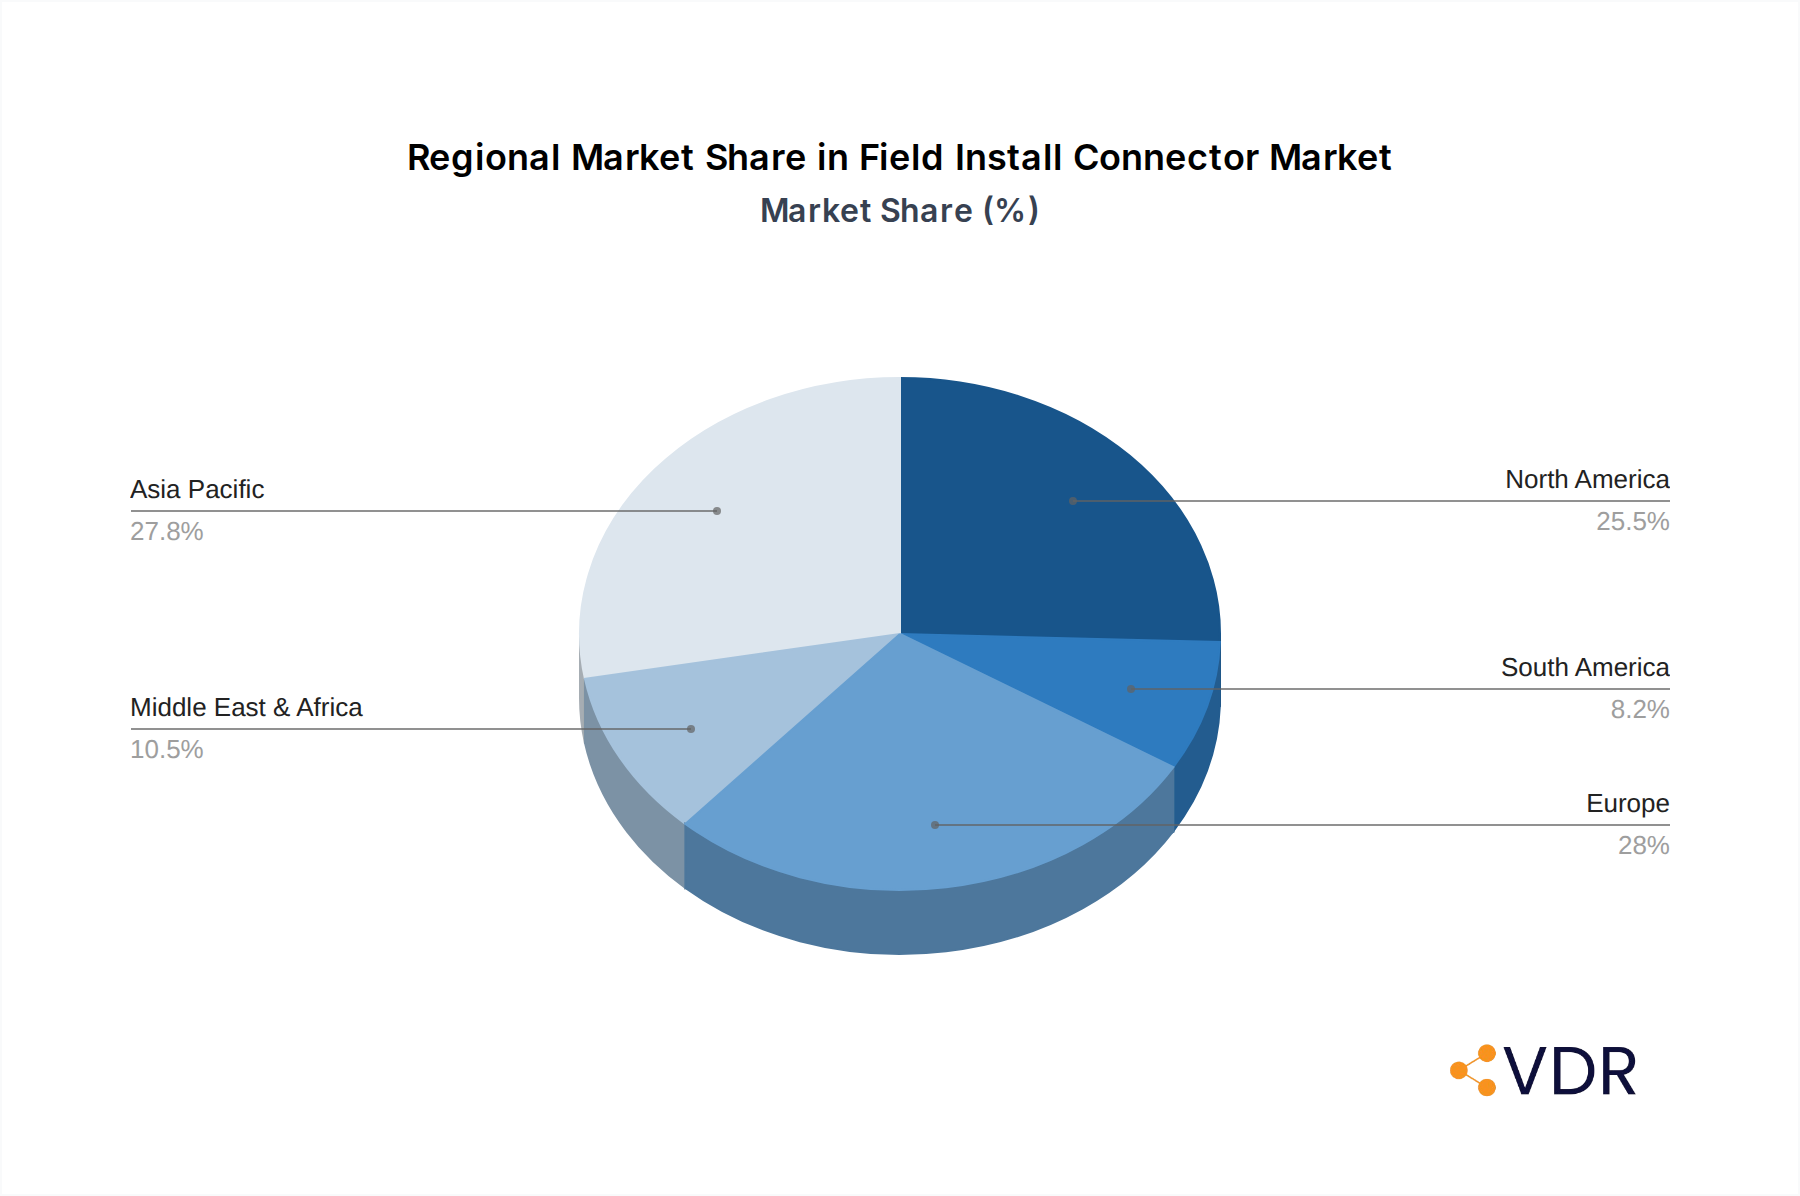
Field Install Connector Regional Market Share
Field Install Connector Market Dynamics & Structure
The Field Install Connector market exhibits a moderately consolidated structure, driven by ongoing technological advancements and increasing demand for high-speed data transmission. Key players are investing heavily in research and development to enhance connector performance, ease of installation, and durability. The proliferation of 5G networks, the expansion of fiber-to-the-home (FTTH) initiatives, and the growth of data centers are significant technological innovation drivers. Regulatory frameworks, particularly those promoting broadband deployment and network standardization, are shaping market entry and product development. Competitive product substitutes, primarily pre-terminated cables, present a challenge, yet the flexibility and cost-effectiveness of field-installable connectors continue to secure their market share. End-user demographics are shifting towards a greater demand for reliable and easily deployable solutions in both remote and urban environments. Mergers and acquisitions (M&A) are an active trend, with larger entities acquiring innovative startups to expand their product portfolios and market reach. For instance, the global market share of field-installable connectors is projected to reach $4.2 billion in 2025, with an estimated $1.5 billion in M&A deal volumes observed between 2021-2024, reflecting a strategic consolidation within the industry. Innovation barriers, such as the complexity of developing new materials for enhanced performance and the stringent testing required for industry certifications, are being addressed through collaborative efforts and significant R&D investments.
Field Install Connector Growth Trends & Insights
The Field Install Connector market size is poised for substantial growth, driven by the insatiable demand for bandwidth and the ubiquitous expansion of fiber optic networks. This market, a vital child market within the broader fiber optics industry, is projected to expand at a Compound Annual Growth Rate (CAGR) of 8.5% from 2025 to 2033, reaching an estimated $7.8 billion by 2033. The estimated year of 2025 sees the market valued at $4.2 billion. Adoption rates for field-installable connectors are escalating as installers and network operators recognize their advantages in terms of reduced lead times, on-site flexibility, and lower transportation costs compared to pre-terminated solutions. Technological disruptions, such as advancements in connector termination tools and materials, are significantly enhancing installation speed and reliability. Consumer behavior shifts are evident, with a growing preference for solutions that enable rapid deployment and future-proofing of network infrastructure, particularly in the Residential and Commercial application segments. The market penetration of field-installable connectors in new fiber deployments is expected to rise from 35% in 2025 to over 50% by 2033. This evolution is fueled by a demand for cost-effective and adaptable connectivity solutions that can be deployed without requiring specialized factory conditions. The increasing complexity of network architectures, including the rise of edge computing and the Internet of Things (IoT), further accentuates the need for flexible and on-demand fiber optic termination. The historical period 2019-2024 saw a robust growth trajectory, with the market expanding from an estimated $2.5 billion in 2019 to $3.8 billion in 2024, setting a strong foundation for future expansion. The ongoing digital transformation across industries and governments worldwide continues to underscore the critical role of reliable and efficient fiber optic connectivity, directly benefiting the field install connector segment.
Dominant Regions, Countries, or Segments in Field Install Connector
The Commercial segment, under the Application category, is emerging as a dominant force in the Field Install Connector market, driven by the rapid expansion of enterprise networks, data centers, and the increasing adoption of smart building technologies. This segment is estimated to contribute 40% to the global market value in 2025, representing $1.7 billion. The Mechanical Type of connectors also holds significant sway, particularly due to its ease of use and the absence of specialized fusion splicing equipment, making it a preferred choice for rapid deployments and repairs. This segment is expected to account for approximately 60% of the overall field-installable connector market in 2025. Geographically, North America and Europe currently lead the market, driven by robust investments in broadband infrastructure, including extensive FTTH projects and the widespread rollout of 5G. North America, specifically, is projected to capture 30% of the global market share in 2025, valued at $1.3 billion. Key drivers in these regions include supportive government policies, such as broadband expansion initiatives, and a highly developed telecommunications infrastructure.
- Commercial Segment Dominance: The growth is propelled by the need for scalable and adaptable connectivity solutions in offices, retail spaces, and industrial facilities.
- Mechanical Type Preference: Its plug-and-play nature reduces installation time and technical skill requirements, making it ideal for on-site terminations.
- North America & Europe Leadership: Strong governmental support for digital infrastructure upgrades and the existing high density of fiber optic networks fuel consistent demand.
- Infrastructure Investments: Significant public and private investments in upgrading legacy networks and deploying new fiber optic infrastructure across these regions are pivotal.
- Growth Potential in Asia Pacific: While currently following North America and Europe, the Asia Pacific region, particularly China, presents substantial untapped growth potential due to massive digital transformation initiatives and increasing broadband penetration, with an estimated market share of 25% by 2025, valued at $1.05 billion.
Field Install Connector Product Landscape
The Field Install Connector product landscape is characterized by continuous innovation focused on improving termination speed, reliability, and connector density. Manufacturers are developing advanced mechanical connectors with integrated alignment mechanisms for quicker and more precise fiber mating, while fusion splice connectors are benefiting from miniaturized and more portable splicing machines. Key product advancements include connectors with enhanced environmental sealing for rugged outdoor applications and those designed for high-density patching in data centers. The unique selling proposition often lies in the simplicity of the installation process and the reduced need for specialized training. Technological advancements are enabling connectors with lower insertion loss and higher return loss, crucial for demanding network performance. Products are increasingly tailored for specific applications, ranging from robust connectors for industrial automation to compact, high-performance connectors for 5G small cells.
Key Drivers, Barriers & Challenges in Field Install Connector
Key Drivers:
- Ubiquitous Fiber Optic Deployment: The global push for widespread fiber optic infrastructure in residential, commercial, and public sectors is the primary growth engine.
- 5G Network Expansion: The demand for high-bandwidth, low-latency connectivity for 5G base stations and backhaul networks necessitates rapid and efficient fiber terminations.
- FTTH Initiatives: Government and private sector investments in fiber-to-the-home projects worldwide are driving significant demand.
- Data Center Growth: The exponential increase in data traffic and the expansion of cloud services are fueling the need for scalable and easily deployable fiber connectivity in data centers.
- Technological Advancements: Innovations in connector design, materials, and tooling are enhancing installation speed, reliability, and cost-effectiveness.
Barriers & Challenges:
- Cost of Specialized Tools: While improving, the initial investment in specialized termination tools for certain connector types can be a barrier for smaller installers.
- Skilled Labor Shortage: The need for trained technicians for optimal installation and troubleshooting remains a challenge in some regions.
- Competition from Pre-Terminated Solutions: Pre-terminated fiber optic cables offer a plug-and-play alternative, posing a competitive threat in certain scenarios.
- Quality Control and Standards: Ensuring consistent quality and adherence to stringent industry standards across diverse installation environments can be challenging.
- Supply Chain Disruptions: Global supply chain volatility, impacting raw material availability and component lead times, can affect production and delivery schedules, with an estimated impact of 5-10% on project timelines during peak disruptions.
Emerging Opportunities in Field Install Connector
Emerging opportunities in the Field Install Connector market lie in the development of intelligent connectors with integrated monitoring capabilities, enabling proactive network management and fault detection. The expansion of the Industrial Internet of Things (IIoT) presents a significant untapped market, requiring robust and easily deployable fiber connectivity in harsh industrial environments. Furthermore, the growing demand for high-speed connectivity in rural and underserved areas offers substantial growth potential, where the flexibility of field-installable connectors is particularly advantageous. The development of eco-friendly and sustainable connector materials is also an emerging trend, aligning with global environmental consciousness.
Growth Accelerators in the Field Install Connector Industry
Several catalysts are accelerating the growth of the Field Install Connector industry. Technological breakthroughs, such as the development of connectors requiring no adhesives or polishing, are dramatically reducing installation times and complexity. Strategic partnerships between connector manufacturers and network equipment providers are fostering integrated solutions and expanding market reach. Furthermore, market expansion strategies, including the focus on emerging economies and the development of cost-effective solutions for mass deployments, are driving significant growth. The increasing demand for higher data speeds and lower latency across all applications is a fundamental accelerator, pushing the boundaries of connector performance and deployment efficiency.
Key Players Shaping the Field Install Connector Market
- Amphenol
- Molex
- CommScope
- TE Connectivity
- Phoenix Contact
- Sumitomo Electric
- Radiall
- 3M
- Huber+Suhner
- Corning
- Diamond
- Furukawa Electric
- Senko
- AFL Telecommunications
- Foxconn Interconnect Technology
- China Fiber Optic
- Sunsea
- AVIC Jonhon Optronic Technology
- Longxing
- Singatron Enterprise
Notable Milestones in Field Install Connector Sector
- 2019: Introduction of advanced low-insertion-loss mechanical connectors by several leading manufacturers, significantly improving signal integrity for high-speed networks.
- 2020: Widespread adoption of field-installable connectors for rapid 5G network densification across major urban centers.
- 2021: Development and commercialization of one-click, no-polish field-installable connector technologies, reducing installation time by up to 70%.
- 2022: Increased focus on ruggedized and environmentally sealed field connectors for industrial and outdoor applications.
- 2023: Mergers and acquisitions activity intensified as larger players sought to consolidate market share and acquire innovative technologies.
- 2024: Emergence of smart field-installable connectors with integrated diagnostic capabilities, paving the way for proactive network management.
In-Depth Field Install Connector Market Outlook
The future outlook for the Field Install Connector market is exceptionally bright, driven by ongoing digital transformation and the relentless demand for enhanced connectivity. Growth accelerators, including continuous innovation in connector technology and expanding deployment of fiber optics in emerging markets, are expected to sustain strong market expansion. Strategic opportunities abound in developing solutions for edge computing, IoT deployments, and the continued rollout of 5G and beyond. The market is projected to witness sustained growth, reaching an estimated $7.8 billion by 2033, with the child market of field-installable connectors playing an increasingly crucial role in enabling global connectivity infrastructure. The proactive development of solutions that address ease of use, cost-effectiveness, and enhanced performance will be paramount for companies aiming to capitalize on this dynamic market.
Field Install Connector Segmentation
-
1. Application
- 1.1. Residential
- 1.2. Commercial
- 1.3. Public
- 1.4. Others
-
2. Types
- 2.1. Mechanical Type
- 2.2. Fusion Splice Type
Field Install Connector Segmentation By Geography
-
1. North America
- 1.1. United States
- 1.2. Canada
- 1.3. Mexico
-
2. South America
- 2.1. Brazil
- 2.2. Argentina
- 2.3. Rest of South America
-
3. Europe
- 3.1. United Kingdom
- 3.2. Germany
- 3.3. France
- 3.4. Italy
- 3.5. Spain
- 3.6. Russia
- 3.7. Benelux
- 3.8. Nordics
- 3.9. Rest of Europe
-
4. Middle East & Africa
- 4.1. Turkey
- 4.2. Israel
- 4.3. GCC
- 4.4. North Africa
- 4.5. South Africa
- 4.6. Rest of Middle East & Africa
-
5. Asia Pacific
- 5.1. China
- 5.2. India
- 5.3. Japan
- 5.4. South Korea
- 5.5. ASEAN
- 5.6. Oceania
- 5.7. Rest of Asia Pacific
Field Install Connector Regional Market Share
Geographic Coverage of Field Install Connector
Field Install Connector REPORT HIGHLIGHTS
| Aspects | Details |
|---|---|
| Study Period | 2020-2034 |
| Base Year | 2025 |
| Estimated Year | 2026 |
| Forecast Period | 2026-2034 |
| Historical Period | 2020-2025 |
| Growth Rate | CAGR of 14.98% from 2020-2034 |
| Segmentation |
|
Table of Contents
- 1. Introduction
- 1.1. Research Scope
- 1.2. Market Segmentation
- 1.3. Research Methodology
- 1.4. Definitions and Assumptions
- 2. Executive Summary
- 2.1. Introduction
- 3. Market Dynamics
- 3.1. Introduction
- 3.2. Market Drivers
- 3.3. Market Restrains
- 3.4. Market Trends
- 4. Market Factor Analysis
- 4.1. Porters Five Forces
- 4.2. Supply/Value Chain
- 4.3. PESTEL analysis
- 4.4. Market Entropy
- 4.5. Patent/Trademark Analysis
- 5. Global Field Install Connector Analysis, Insights and Forecast, 2020-2032
- 5.1. Market Analysis, Insights and Forecast - by Application
- 5.1.1. Residential
- 5.1.2. Commercial
- 5.1.3. Public
- 5.1.4. Others
- 5.2. Market Analysis, Insights and Forecast - by Types
- 5.2.1. Mechanical Type
- 5.2.2. Fusion Splice Type
- 5.3. Market Analysis, Insights and Forecast - by Region
- 5.3.1. North America
- 5.3.2. South America
- 5.3.3. Europe
- 5.3.4. Middle East & Africa
- 5.3.5. Asia Pacific
- 5.1. Market Analysis, Insights and Forecast - by Application
- 6. North America Field Install Connector Analysis, Insights and Forecast, 2020-2032
- 6.1. Market Analysis, Insights and Forecast - by Application
- 6.1.1. Residential
- 6.1.2. Commercial
- 6.1.3. Public
- 6.1.4. Others
- 6.2. Market Analysis, Insights and Forecast - by Types
- 6.2.1. Mechanical Type
- 6.2.2. Fusion Splice Type
- 6.1. Market Analysis, Insights and Forecast - by Application
- 7. South America Field Install Connector Analysis, Insights and Forecast, 2020-2032
- 7.1. Market Analysis, Insights and Forecast - by Application
- 7.1.1. Residential
- 7.1.2. Commercial
- 7.1.3. Public
- 7.1.4. Others
- 7.2. Market Analysis, Insights and Forecast - by Types
- 7.2.1. Mechanical Type
- 7.2.2. Fusion Splice Type
- 7.1. Market Analysis, Insights and Forecast - by Application
- 8. Europe Field Install Connector Analysis, Insights and Forecast, 2020-2032
- 8.1. Market Analysis, Insights and Forecast - by Application
- 8.1.1. Residential
- 8.1.2. Commercial
- 8.1.3. Public
- 8.1.4. Others
- 8.2. Market Analysis, Insights and Forecast - by Types
- 8.2.1. Mechanical Type
- 8.2.2. Fusion Splice Type
- 8.1. Market Analysis, Insights and Forecast - by Application
- 9. Middle East & Africa Field Install Connector Analysis, Insights and Forecast, 2020-2032
- 9.1. Market Analysis, Insights and Forecast - by Application
- 9.1.1. Residential
- 9.1.2. Commercial
- 9.1.3. Public
- 9.1.4. Others
- 9.2. Market Analysis, Insights and Forecast - by Types
- 9.2.1. Mechanical Type
- 9.2.2. Fusion Splice Type
- 9.1. Market Analysis, Insights and Forecast - by Application
- 10. Asia Pacific Field Install Connector Analysis, Insights and Forecast, 2020-2032
- 10.1. Market Analysis, Insights and Forecast - by Application
- 10.1.1. Residential
- 10.1.2. Commercial
- 10.1.3. Public
- 10.1.4. Others
- 10.2. Market Analysis, Insights and Forecast - by Types
- 10.2.1. Mechanical Type
- 10.2.2. Fusion Splice Type
- 10.1. Market Analysis, Insights and Forecast - by Application
- 11. Competitive Analysis
- 11.1. Global Market Share Analysis 2025
- 11.2. Company Profiles
- 11.2.1 Amphenol
- 11.2.1.1. Overview
- 11.2.1.2. Products
- 11.2.1.3. SWOT Analysis
- 11.2.1.4. Recent Developments
- 11.2.1.5. Financials (Based on Availability)
- 11.2.2 Molex
- 11.2.2.1. Overview
- 11.2.2.2. Products
- 11.2.2.3. SWOT Analysis
- 11.2.2.4. Recent Developments
- 11.2.2.5. Financials (Based on Availability)
- 11.2.3 CommScope
- 11.2.3.1. Overview
- 11.2.3.2. Products
- 11.2.3.3. SWOT Analysis
- 11.2.3.4. Recent Developments
- 11.2.3.5. Financials (Based on Availability)
- 11.2.4 TE Connectivity
- 11.2.4.1. Overview
- 11.2.4.2. Products
- 11.2.4.3. SWOT Analysis
- 11.2.4.4. Recent Developments
- 11.2.4.5. Financials (Based on Availability)
- 11.2.5 Phoenix Contact
- 11.2.5.1. Overview
- 11.2.5.2. Products
- 11.2.5.3. SWOT Analysis
- 11.2.5.4. Recent Developments
- 11.2.5.5. Financials (Based on Availability)
- 11.2.6 Sumitomo Electric
- 11.2.6.1. Overview
- 11.2.6.2. Products
- 11.2.6.3. SWOT Analysis
- 11.2.6.4. Recent Developments
- 11.2.6.5. Financials (Based on Availability)
- 11.2.7 Radiall
- 11.2.7.1. Overview
- 11.2.7.2. Products
- 11.2.7.3. SWOT Analysis
- 11.2.7.4. Recent Developments
- 11.2.7.5. Financials (Based on Availability)
- 11.2.8 3M
- 11.2.8.1. Overview
- 11.2.8.2. Products
- 11.2.8.3. SWOT Analysis
- 11.2.8.4. Recent Developments
- 11.2.8.5. Financials (Based on Availability)
- 11.2.9 Huber+Suhner
- 11.2.9.1. Overview
- 11.2.9.2. Products
- 11.2.9.3. SWOT Analysis
- 11.2.9.4. Recent Developments
- 11.2.9.5. Financials (Based on Availability)
- 11.2.10 Corning
- 11.2.10.1. Overview
- 11.2.10.2. Products
- 11.2.10.3. SWOT Analysis
- 11.2.10.4. Recent Developments
- 11.2.10.5. Financials (Based on Availability)
- 11.2.11 Diamond
- 11.2.11.1. Overview
- 11.2.11.2. Products
- 11.2.11.3. SWOT Analysis
- 11.2.11.4. Recent Developments
- 11.2.11.5. Financials (Based on Availability)
- 11.2.12 Furukawa Electric
- 11.2.12.1. Overview
- 11.2.12.2. Products
- 11.2.12.3. SWOT Analysis
- 11.2.12.4. Recent Developments
- 11.2.12.5. Financials (Based on Availability)
- 11.2.13 Senko
- 11.2.13.1. Overview
- 11.2.13.2. Products
- 11.2.13.3. SWOT Analysis
- 11.2.13.4. Recent Developments
- 11.2.13.5. Financials (Based on Availability)
- 11.2.14 AFL Telecommunications
- 11.2.14.1. Overview
- 11.2.14.2. Products
- 11.2.14.3. SWOT Analysis
- 11.2.14.4. Recent Developments
- 11.2.14.5. Financials (Based on Availability)
- 11.2.15 Foxconn Interconnect Technology
- 11.2.15.1. Overview
- 11.2.15.2. Products
- 11.2.15.3. SWOT Analysis
- 11.2.15.4. Recent Developments
- 11.2.15.5. Financials (Based on Availability)
- 11.2.16 China Fiber Optic
- 11.2.16.1. Overview
- 11.2.16.2. Products
- 11.2.16.3. SWOT Analysis
- 11.2.16.4. Recent Developments
- 11.2.16.5. Financials (Based on Availability)
- 11.2.17 Sunsea
- 11.2.17.1. Overview
- 11.2.17.2. Products
- 11.2.17.3. SWOT Analysis
- 11.2.17.4. Recent Developments
- 11.2.17.5. Financials (Based on Availability)
- 11.2.18 AVIC Jonhon Optronic Technology
- 11.2.18.1. Overview
- 11.2.18.2. Products
- 11.2.18.3. SWOT Analysis
- 11.2.18.4. Recent Developments
- 11.2.18.5. Financials (Based on Availability)
- 11.2.19 Longxing
- 11.2.19.1. Overview
- 11.2.19.2. Products
- 11.2.19.3. SWOT Analysis
- 11.2.19.4. Recent Developments
- 11.2.19.5. Financials (Based on Availability)
- 11.2.20 Singatron Enterprise
- 11.2.20.1. Overview
- 11.2.20.2. Products
- 11.2.20.3. SWOT Analysis
- 11.2.20.4. Recent Developments
- 11.2.20.5. Financials (Based on Availability)
- 11.2.1 Amphenol
List of Figures
- Figure 1: Global Field Install Connector Revenue Breakdown (billion, %) by Region 2025 & 2033
- Figure 2: North America Field Install Connector Revenue (billion), by Application 2025 & 2033
- Figure 3: North America Field Install Connector Revenue Share (%), by Application 2025 & 2033
- Figure 4: North America Field Install Connector Revenue (billion), by Types 2025 & 2033
- Figure 5: North America Field Install Connector Revenue Share (%), by Types 2025 & 2033
- Figure 6: North America Field Install Connector Revenue (billion), by Country 2025 & 2033
- Figure 7: North America Field Install Connector Revenue Share (%), by Country 2025 & 2033
- Figure 8: South America Field Install Connector Revenue (billion), by Application 2025 & 2033
- Figure 9: South America Field Install Connector Revenue Share (%), by Application 2025 & 2033
- Figure 10: South America Field Install Connector Revenue (billion), by Types 2025 & 2033
- Figure 11: South America Field Install Connector Revenue Share (%), by Types 2025 & 2033
- Figure 12: South America Field Install Connector Revenue (billion), by Country 2025 & 2033
- Figure 13: South America Field Install Connector Revenue Share (%), by Country 2025 & 2033
- Figure 14: Europe Field Install Connector Revenue (billion), by Application 2025 & 2033
- Figure 15: Europe Field Install Connector Revenue Share (%), by Application 2025 & 2033
- Figure 16: Europe Field Install Connector Revenue (billion), by Types 2025 & 2033
- Figure 17: Europe Field Install Connector Revenue Share (%), by Types 2025 & 2033
- Figure 18: Europe Field Install Connector Revenue (billion), by Country 2025 & 2033
- Figure 19: Europe Field Install Connector Revenue Share (%), by Country 2025 & 2033
- Figure 20: Middle East & Africa Field Install Connector Revenue (billion), by Application 2025 & 2033
- Figure 21: Middle East & Africa Field Install Connector Revenue Share (%), by Application 2025 & 2033
- Figure 22: Middle East & Africa Field Install Connector Revenue (billion), by Types 2025 & 2033
- Figure 23: Middle East & Africa Field Install Connector Revenue Share (%), by Types 2025 & 2033
- Figure 24: Middle East & Africa Field Install Connector Revenue (billion), by Country 2025 & 2033
- Figure 25: Middle East & Africa Field Install Connector Revenue Share (%), by Country 2025 & 2033
- Figure 26: Asia Pacific Field Install Connector Revenue (billion), by Application 2025 & 2033
- Figure 27: Asia Pacific Field Install Connector Revenue Share (%), by Application 2025 & 2033
- Figure 28: Asia Pacific Field Install Connector Revenue (billion), by Types 2025 & 2033
- Figure 29: Asia Pacific Field Install Connector Revenue Share (%), by Types 2025 & 2033
- Figure 30: Asia Pacific Field Install Connector Revenue (billion), by Country 2025 & 2033
- Figure 31: Asia Pacific Field Install Connector Revenue Share (%), by Country 2025 & 2033
List of Tables
- Table 1: Global Field Install Connector Revenue billion Forecast, by Application 2020 & 2033
- Table 2: Global Field Install Connector Revenue billion Forecast, by Types 2020 & 2033
- Table 3: Global Field Install Connector Revenue billion Forecast, by Region 2020 & 2033
- Table 4: Global Field Install Connector Revenue billion Forecast, by Application 2020 & 2033
- Table 5: Global Field Install Connector Revenue billion Forecast, by Types 2020 & 2033
- Table 6: Global Field Install Connector Revenue billion Forecast, by Country 2020 & 2033
- Table 7: United States Field Install Connector Revenue (billion) Forecast, by Application 2020 & 2033
- Table 8: Canada Field Install Connector Revenue (billion) Forecast, by Application 2020 & 2033
- Table 9: Mexico Field Install Connector Revenue (billion) Forecast, by Application 2020 & 2033
- Table 10: Global Field Install Connector Revenue billion Forecast, by Application 2020 & 2033
- Table 11: Global Field Install Connector Revenue billion Forecast, by Types 2020 & 2033
- Table 12: Global Field Install Connector Revenue billion Forecast, by Country 2020 & 2033
- Table 13: Brazil Field Install Connector Revenue (billion) Forecast, by Application 2020 & 2033
- Table 14: Argentina Field Install Connector Revenue (billion) Forecast, by Application 2020 & 2033
- Table 15: Rest of South America Field Install Connector Revenue (billion) Forecast, by Application 2020 & 2033
- Table 16: Global Field Install Connector Revenue billion Forecast, by Application 2020 & 2033
- Table 17: Global Field Install Connector Revenue billion Forecast, by Types 2020 & 2033
- Table 18: Global Field Install Connector Revenue billion Forecast, by Country 2020 & 2033
- Table 19: United Kingdom Field Install Connector Revenue (billion) Forecast, by Application 2020 & 2033
- Table 20: Germany Field Install Connector Revenue (billion) Forecast, by Application 2020 & 2033
- Table 21: France Field Install Connector Revenue (billion) Forecast, by Application 2020 & 2033
- Table 22: Italy Field Install Connector Revenue (billion) Forecast, by Application 2020 & 2033
- Table 23: Spain Field Install Connector Revenue (billion) Forecast, by Application 2020 & 2033
- Table 24: Russia Field Install Connector Revenue (billion) Forecast, by Application 2020 & 2033
- Table 25: Benelux Field Install Connector Revenue (billion) Forecast, by Application 2020 & 2033
- Table 26: Nordics Field Install Connector Revenue (billion) Forecast, by Application 2020 & 2033
- Table 27: Rest of Europe Field Install Connector Revenue (billion) Forecast, by Application 2020 & 2033
- Table 28: Global Field Install Connector Revenue billion Forecast, by Application 2020 & 2033
- Table 29: Global Field Install Connector Revenue billion Forecast, by Types 2020 & 2033
- Table 30: Global Field Install Connector Revenue billion Forecast, by Country 2020 & 2033
- Table 31: Turkey Field Install Connector Revenue (billion) Forecast, by Application 2020 & 2033
- Table 32: Israel Field Install Connector Revenue (billion) Forecast, by Application 2020 & 2033
- Table 33: GCC Field Install Connector Revenue (billion) Forecast, by Application 2020 & 2033
- Table 34: North Africa Field Install Connector Revenue (billion) Forecast, by Application 2020 & 2033
- Table 35: South Africa Field Install Connector Revenue (billion) Forecast, by Application 2020 & 2033
- Table 36: Rest of Middle East & Africa Field Install Connector Revenue (billion) Forecast, by Application 2020 & 2033
- Table 37: Global Field Install Connector Revenue billion Forecast, by Application 2020 & 2033
- Table 38: Global Field Install Connector Revenue billion Forecast, by Types 2020 & 2033
- Table 39: Global Field Install Connector Revenue billion Forecast, by Country 2020 & 2033
- Table 40: China Field Install Connector Revenue (billion) Forecast, by Application 2020 & 2033
- Table 41: India Field Install Connector Revenue (billion) Forecast, by Application 2020 & 2033
- Table 42: Japan Field Install Connector Revenue (billion) Forecast, by Application 2020 & 2033
- Table 43: South Korea Field Install Connector Revenue (billion) Forecast, by Application 2020 & 2033
- Table 44: ASEAN Field Install Connector Revenue (billion) Forecast, by Application 2020 & 2033
- Table 45: Oceania Field Install Connector Revenue (billion) Forecast, by Application 2020 & 2033
- Table 46: Rest of Asia Pacific Field Install Connector Revenue (billion) Forecast, by Application 2020 & 2033
Frequently Asked Questions
1. What is the projected Compound Annual Growth Rate (CAGR) of the Field Install Connector?
The projected CAGR is approximately 14.98%.
2. Which companies are prominent players in the Field Install Connector?
Key companies in the market include Amphenol, Molex, CommScope, TE Connectivity, Phoenix Contact, Sumitomo Electric, Radiall, 3M, Huber+Suhner, Corning, Diamond, Furukawa Electric, Senko, AFL Telecommunications, Foxconn Interconnect Technology, China Fiber Optic, Sunsea, AVIC Jonhon Optronic Technology, Longxing, Singatron Enterprise.
3. What are the main segments of the Field Install Connector?
The market segments include Application, Types.
4. Can you provide details about the market size?
The market size is estimated to be USD 9.41 billion as of 2022.
5. What are some drivers contributing to market growth?
N/A
6. What are the notable trends driving market growth?
N/A
7. Are there any restraints impacting market growth?
N/A
8. Can you provide examples of recent developments in the market?
N/A
9. What pricing options are available for accessing the report?
Pricing options include single-user, multi-user, and enterprise licenses priced at USD 2900.00, USD 4350.00, and USD 5800.00 respectively.
10. Is the market size provided in terms of value or volume?
The market size is provided in terms of value, measured in billion.
11. Are there any specific market keywords associated with the report?
Yes, the market keyword associated with the report is "Field Install Connector," which aids in identifying and referencing the specific market segment covered.
12. How do I determine which pricing option suits my needs best?
The pricing options vary based on user requirements and access needs. Individual users may opt for single-user licenses, while businesses requiring broader access may choose multi-user or enterprise licenses for cost-effective access to the report.
13. Are there any additional resources or data provided in the Field Install Connector report?
While the report offers comprehensive insights, it's advisable to review the specific contents or supplementary materials provided to ascertain if additional resources or data are available.
14. How can I stay updated on further developments or reports in the Field Install Connector?
To stay informed about further developments, trends, and reports in the Field Install Connector, consider subscribing to industry newsletters, following relevant companies and organizations, or regularly checking reputable industry news sources and publications.
Methodology
Step 1 - Identification of Relevant Samples Size from Population Database


Step 2 - Approaches for Defining Global Market Size (Value, Volume* & Price*)

Note*: In applicable scenarios
Step 3 - Data Sources
Primary Research
- Web Analytics
- Survey Reports
- Research Institute
- Latest Research Reports
- Opinion Leaders
Secondary Research
- Annual Reports
- White Paper
- Latest Press Release
- Industry Association
- Paid Database
- Investor Presentations

Step 4 - Data Triangulation
Involves using different sources of information in order to increase the validity of a study
These sources are likely to be stakeholders in a program - participants, other researchers, program staff, other community members, and so on.
Then we put all data in single framework & apply various statistical tools to find out the dynamic on the market.
During the analysis stage, feedback from the stakeholder groups would be compared to determine areas of agreement as well as areas of divergence