

Key Insights
The Ferric Chloride market is experiencing robust growth, projected to maintain a Compound Annual Growth Rate (CAGR) exceeding 5% from 2025 to 2033. This expansion is fueled by increasing demand across diverse applications, primarily driven by the water and wastewater treatment sector's need for effective coagulants and flocculants. The rising global population and stricter environmental regulations are major catalysts, necessitating advanced water purification technologies. Furthermore, the electronics industry, specifically printed circuit board (PCB) manufacturing, contributes significantly to market growth due to ferric chloride's crucial role in etching processes. Other key application areas include pigment manufacturing, animal feed supplementation, and asphalt production, each contributing to the overall market size. While the market faces certain restraints, such as price fluctuations of raw materials and potential environmental concerns related to its production and disposal, the ongoing technological advancements and the development of more sustainable production methods are expected to mitigate these challenges. The Asia-Pacific region, particularly China and India, is expected to be a key growth driver due to rapid industrialization and infrastructure development. Major players like BASF SE and Kemira are actively shaping market dynamics through innovation and strategic partnerships, leading to increased competition and market consolidation.
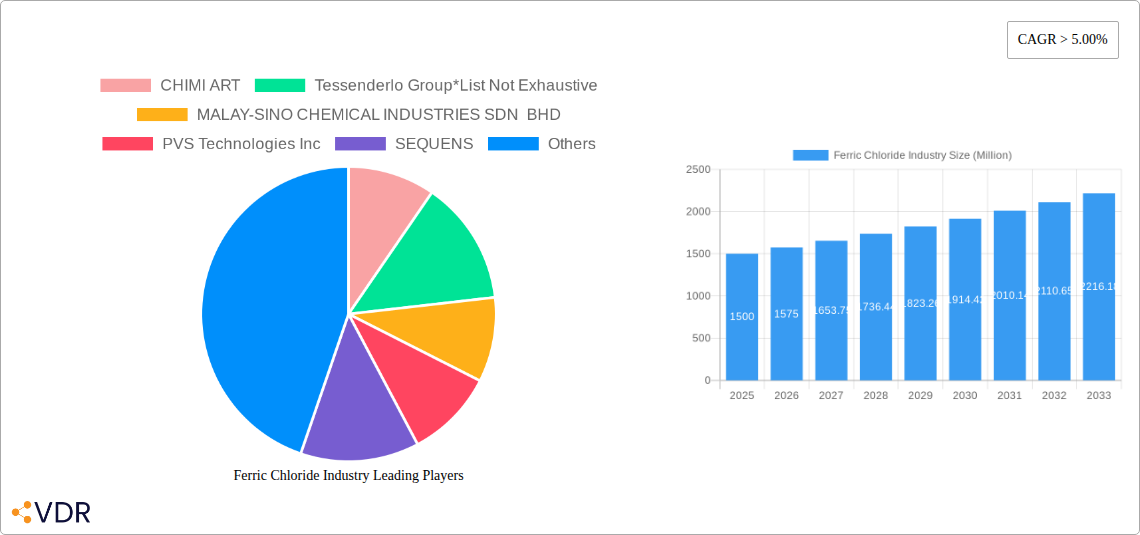
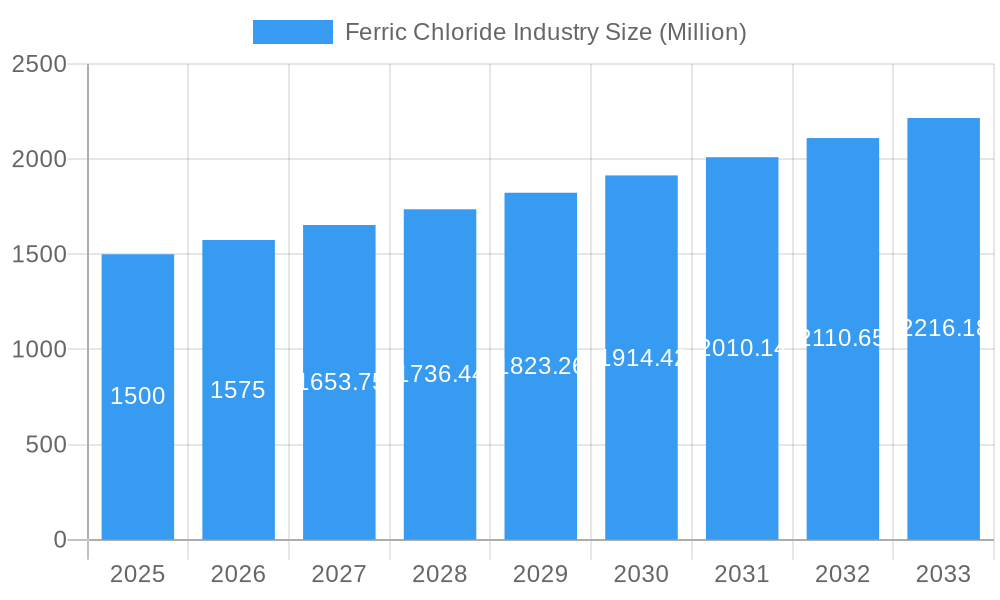
Ferric Chloride Industry Market Size (In Billion)
The competitive landscape is characterized by a mix of large multinational corporations and regional players. The market is witnessing a trend towards the development of more environmentally friendly and efficient ferric chloride production processes. This includes exploring alternative raw materials and optimizing production methods to reduce waste and minimize environmental impact. The segmentation by application highlights the diverse uses of ferric chloride, showcasing the market's resilience and potential for growth across multiple sectors. Future market growth will be significantly influenced by factors such as technological innovation, stricter environmental regulations globally, and the continuous expansion of industries such as water treatment and electronics manufacturing. The ongoing focus on sustainable practices within the industry further ensures the long-term viability and expansion of the ferric chloride market.
Ferric Chloride Industry Company Market Share
Ferric Chloride Industry Market Report: 2019-2033
This comprehensive report provides an in-depth analysis of the Ferric Chloride industry, offering valuable insights for industry professionals, investors, and strategic decision-makers. Covering the period from 2019 to 2033, with a focus on 2025, this report delves into market dynamics, growth trends, regional dominance, and key players shaping the future of this vital chemical sector.
Ferric Chloride Industry Market Dynamics & Structure
The Ferric Chloride market, valued at xx Million in 2024, exhibits a moderately concentrated structure with several key players holding significant market share. Technological innovation, particularly in production efficiency and waste reduction, is a crucial driver. Stringent environmental regulations, particularly concerning wastewater discharge, significantly influence market dynamics. Competitive pressure from substitute coagulants, such as alum and polyacrylamide, is present, albeit limited by Ferric Chloride's superior performance in specific applications. End-user demographics are broad, spanning diverse industries. M&A activity has been moderate in recent years, with several key transactions influencing market consolidation.
- Market Concentration: Moderately concentrated, with top 5 players holding approximately xx% market share in 2024.
- Technological Innovation: Focus on improving production efficiency, reducing waste, and developing specialized formulations for niche applications.
- Regulatory Framework: Stringent environmental regulations driving adoption of sustainable production practices.
- Competitive Substitutes: Alum and polyacrylamide pose some competition but Ferric Chloride maintains its advantage in several key segments.
- End-User Demographics: Diverse, including water treatment facilities, PCB manufacturers, pigment producers, and animal feed supplement makers.
- M&A Trends: Moderate activity observed in recent years, leading to some market consolidation and reshaping of the competitive landscape. xx M&A deals were recorded between 2019 and 2024.
Ferric Chloride Industry Growth Trends & Insights
The Ferric Chloride market witnessed substantial growth during the historical period (2019-2024), driven by increasing demand from the water and wastewater treatment sector and the expanding electronics industry. The market is projected to experience continued growth during the forecast period (2025-2033), driven by robust demand, technological advancements, and new application opportunities. A Compound Annual Growth Rate (CAGR) of xx% is expected from 2025-2033. Market penetration in emerging economies is anticipated to significantly contribute to overall growth. Technological disruptions, such as the development of more efficient production processes and improved product formulations, further bolster market expansion. Consumer behavior shifts, driven by increased environmental awareness and a preference for sustainable solutions, are also playing a significant role. The market size is projected to reach xx Million by 2033.
Dominant Regions, Countries, or Segments in Ferric Chloride Industry
The Water and Wastewater Treatment segment holds the largest market share, representing approximately xx% of the global market in 2025. This dominance stems from the increasing demand for effective water purification solutions across various regions. Developed regions such as North America and Europe contribute significantly to this segment's growth. The Printed Circuit Board (PCB) manufacturing segment is witnessing steady growth, with Asia-Pacific emerging as a key market due to the concentration of electronics manufacturing hubs.
- Key Drivers (Water & Wastewater Treatment): Increasing urbanization, rising water pollution levels, and stringent government regulations.
- Key Drivers (PCB Manufacturing): Rapid growth of the electronics industry, particularly in Asia-Pacific.
- Market Share: Water & Wastewater Treatment (xx%), PCB Manufacturing (xx%), Pigment Manufacturing (xx%), Animal Nutrient Supplements (xx%), Asphalt Blowing (xx%), Other Applications (xx%).
- Growth Potential: Strong growth potential for all segments; however, Water & Wastewater Treatment segment is expected to maintain its dominance.
Ferric Chloride Industry Product Landscape
Ferric Chloride products are available in various forms, including liquid solutions, anhydrous crystals, and specialized formulations designed for specific applications. Recent innovations have focused on enhancing product purity, improving handling characteristics, and optimizing performance in diverse applications. Unique selling propositions include superior coagulation efficiency, reduced sludge production, and enhanced environmental compatibility. Technological advancements are centered around optimizing production processes to minimize waste and improve sustainability.
Key Drivers, Barriers & Challenges in Ferric Chloride Industry
Key Drivers: Growing demand from water treatment, expanding electronics manufacturing, and the increasing adoption of ferric chloride in other applications. Government regulations promoting effective water treatment are strong drivers.
Key Challenges: Fluctuations in raw material prices, particularly iron scrap and hydrochloric acid, can significantly impact profitability. Stringent environmental regulations necessitate significant investments in pollution control technologies. Intense competition from alternative coagulants also poses a challenge. Supply chain disruptions and increased transportation costs were estimated to affect the market by xx Million in 2024.
Emerging Opportunities in Ferric Chloride Industry
Emerging opportunities lie in developing specialized ferric chloride formulations for niche applications, such as enhanced oil recovery and specific industrial processes. Expanding into untapped markets in developing economies offers significant growth potential. The increasing focus on sustainable solutions presents opportunities for developing eco-friendly production methods and promoting the environmental benefits of ferric chloride.
Growth Accelerators in the Ferric Chloride Industry
Technological advancements in production processes, leading to improved efficiency and reduced costs, are crucial growth accelerators. Strategic partnerships and collaborations among key players can foster innovation and market expansion. Expanding into new geographical markets and exploring innovative applications will further propel market growth. The rise of green technologies provides opportunities to develop sustainable products and processes in the Ferric Chloride industry.
Key Players Shaping the Ferric Chloride Industry Market
- CHIMI ART
- Tessenderlo Group
- MALAY-SINO CHEMICAL INDUSTRIES SDN BHD
- PVS Technologies Inc
- SEQUENS
- MISR Chemical Industries
- Feralco AB
- Chemifloc LTD
- Saf Sulphur Factory
- BASF SE
- Kemira
- HORIZON CHEMICALS
- SIDRA WASSERCHEMIE GmbH
- Basic Chemical Industries
- Nobian
Notable Milestones in Ferric Chloride Industry Sector
- February 2022: Chemieanlagenbau Chemnitz commissions a new ferric chloride plant in Kuwait with an annual production capacity of 20,000 tons.
- July 2021: Nouryon spins off its base chemicals business, including ferric chloride production, into Nobian.
In-Depth Ferric Chloride Industry Market Outlook
The Ferric Chloride market is poised for sustained growth, driven by several factors including increasing industrialization, stringent environmental regulations, and the rising demand for effective water treatment solutions. Strategic investments in research and development, along with collaborations to expand into new applications, will shape the future market landscape. The market presents significant opportunities for companies to capitalize on emerging trends and technologies to gain a competitive edge. The long-term outlook for the Ferric Chloride market remains positive, with significant growth potential over the forecast period.
Ferric Chloride Industry Segmentation
-
1. Application
- 1.1. Water and Wastewater Treatment
- 1.2. Printed Circuit Board (PCB)
- 1.3. Pigment Manufacturing
- 1.4. Animal Nutrient Supplements
- 1.5. Asphalt Blowing
- 1.6. Other Applications
Ferric Chloride Industry Segmentation By Geography
-
1. Asia Pacific
- 1.1. China
- 1.2. India
- 1.3. Japan
- 1.4. South Korea
- 1.5. ASEAN Countries
- 1.6. Rest of Asia Pacific
-
2. North America
- 2.1. United States
- 2.2. Canada
- 2.3. Mexico
-
3. Europe
- 3.1. Germany
- 3.2. United Kingdom
- 3.3. Italy
- 3.4. France
- 3.5. Russia
- 3.6. Spain
- 3.7. Rest of Europe
-
4. South America
- 4.1. Brazil
- 4.2. Argentina
- 4.3. Rest of South America
-
5. Middle East and Africa
- 5.1. Saudi Arabia
- 5.2. Egypt
- 5.3. South Africa
- 5.4. Rest of Middle East and Africa
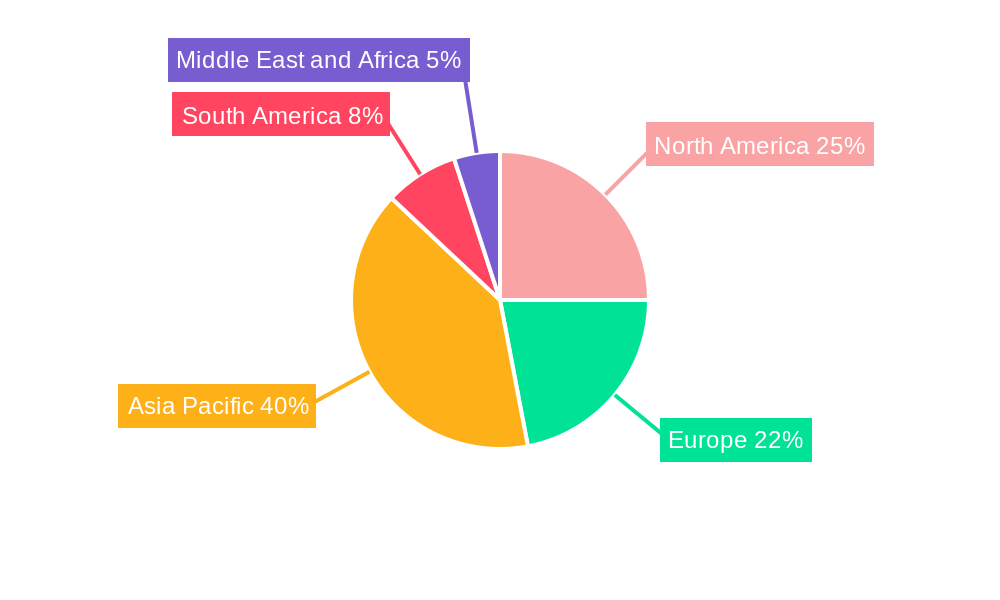
Ferric Chloride Industry Regional Market Share
Geographic Coverage of Ferric Chloride Industry
Ferric Chloride Industry REPORT HIGHLIGHTS
| Aspects | Details |
|---|---|
| Study Period | 2020-2034 |
| Base Year | 2025 |
| Estimated Year | 2026 |
| Forecast Period | 2026-2034 |
| Historical Period | 2020-2025 |
| Growth Rate | CAGR of 4.8% from 2020-2034 |
| Segmentation |
|
Table of Contents
- 1. Introduction
- 1.1. Research Scope
- 1.2. Market Segmentation
- 1.3. Research Objective
- 1.4. Definitions and Assumptions
- 2. Executive Summary
- 2.1. Market Snapshot
- 3. Market Dynamics
- 3.1. Market Drivers
- 3.2. Market Restrains
- 3.3. Market Trends
- 3.4. Market Opportunities
- 4. Market Factor Analysis
- 4.1. Porters Five Forces
- 4.1.1. Bargaining Power of Suppliers
- 4.1.2. Bargaining Power of Buyers
- 4.1.3. Threat of New Entrants
- 4.1.4. Threat of Substitutes
- 4.1.5. Competitive Rivalry
- 4.2. PESTEL analysis
- 4.3. BCG Analysis
- 4.3.1. Stars (High Growth, High Market Share)
- 4.3.2. Cash Cows (Low Growth, High Market Share)
- 4.3.3. Question Mark (High Growth, Low Market Share)
- 4.3.4. Dogs (Low Growth, Low Market Share)
- 4.4. Ansoff Matrix Analysis
- 4.5. Supply Chain Analysis
- 4.6. Regulatory Landscape
- 4.7. Current Market Potential and Opportunity Assessment (TAM–SAM–SOM Framework)
- 4.8. VDR Analyst Note
- 4.1. Porters Five Forces
- 5. Market Analysis, Insights and Forecast 2021-2033
- 5.1. Market Analysis, Insights and Forecast - by Application
- 5.1.1. Water and Wastewater Treatment
- 5.1.2. Printed Circuit Board (PCB)
- 5.1.3. Pigment Manufacturing
- 5.1.4. Animal Nutrient Supplements
- 5.1.5. Asphalt Blowing
- 5.1.6. Other Applications
- 5.2. Market Analysis, Insights and Forecast - by Region
- 5.2.1. Asia Pacific
- 5.2.2. North America
- 5.2.3. Europe
- 5.2.4. South America
- 5.2.5. Middle East and Africa
- 5.1. Market Analysis, Insights and Forecast - by Application
- 6. Global Ferric Chloride Industry Analysis, Insights and Forecast, 2021-2033
- 6.1. Market Analysis, Insights and Forecast - by Application
- 6.1.1. Water and Wastewater Treatment
- 6.1.2. Printed Circuit Board (PCB)
- 6.1.3. Pigment Manufacturing
- 6.1.4. Animal Nutrient Supplements
- 6.1.5. Asphalt Blowing
- 6.1.6. Other Applications
- 6.1. Market Analysis, Insights and Forecast - by Application
- 7. Asia Pacific Ferric Chloride Industry Analysis, Insights and Forecast, 2021-2033
- 7.1. Market Analysis, Insights and Forecast - by Application
- 7.1.1. Water and Wastewater Treatment
- 7.1.2. Printed Circuit Board (PCB)
- 7.1.3. Pigment Manufacturing
- 7.1.4. Animal Nutrient Supplements
- 7.1.5. Asphalt Blowing
- 7.1.6. Other Applications
- 7.1. Market Analysis, Insights and Forecast - by Application
- 8. North America Ferric Chloride Industry Analysis, Insights and Forecast, 2021-2033
- 8.1. Market Analysis, Insights and Forecast - by Application
- 8.1.1. Water and Wastewater Treatment
- 8.1.2. Printed Circuit Board (PCB)
- 8.1.3. Pigment Manufacturing
- 8.1.4. Animal Nutrient Supplements
- 8.1.5. Asphalt Blowing
- 8.1.6. Other Applications
- 8.1. Market Analysis, Insights and Forecast - by Application
- 9. Europe Ferric Chloride Industry Analysis, Insights and Forecast, 2021-2033
- 9.1. Market Analysis, Insights and Forecast - by Application
- 9.1.1. Water and Wastewater Treatment
- 9.1.2. Printed Circuit Board (PCB)
- 9.1.3. Pigment Manufacturing
- 9.1.4. Animal Nutrient Supplements
- 9.1.5. Asphalt Blowing
- 9.1.6. Other Applications
- 9.1. Market Analysis, Insights and Forecast - by Application
- 10. South America Ferric Chloride Industry Analysis, Insights and Forecast, 2021-2033
- 10.1. Market Analysis, Insights and Forecast - by Application
- 10.1.1. Water and Wastewater Treatment
- 10.1.2. Printed Circuit Board (PCB)
- 10.1.3. Pigment Manufacturing
- 10.1.4. Animal Nutrient Supplements
- 10.1.5. Asphalt Blowing
- 10.1.6. Other Applications
- 10.1. Market Analysis, Insights and Forecast - by Application
- 11. Middle East and Africa Ferric Chloride Industry Analysis, Insights and Forecast, 2021-2033
- 11.1. Market Analysis, Insights and Forecast - by Application
- 11.1.1. Water and Wastewater Treatment
- 11.1.2. Printed Circuit Board (PCB)
- 11.1.3. Pigment Manufacturing
- 11.1.4. Animal Nutrient Supplements
- 11.1.5. Asphalt Blowing
- 11.1.6. Other Applications
- 11.1. Market Analysis, Insights and Forecast - by Application
- 12. Competitive Analysis
- 12.1. Company Profiles
- 12.1.1 CHIMI ART
- 12.1.1.1. Company Overview
- 12.1.1.2. Products
- 12.1.1.3. Company Financials
- 12.1.1.4. SWOT Analysis
- 12.1.2 Tessenderlo Group*List Not Exhaustive
- 12.1.2.1. Company Overview
- 12.1.2.2. Products
- 12.1.2.3. Company Financials
- 12.1.2.4. SWOT Analysis
- 12.1.3 MALAY-SINO CHEMICAL INDUSTRIES SDN BHD
- 12.1.3.1. Company Overview
- 12.1.3.2. Products
- 12.1.3.3. Company Financials
- 12.1.3.4. SWOT Analysis
- 12.1.4 PVS Technologies Inc
- 12.1.4.1. Company Overview
- 12.1.4.2. Products
- 12.1.4.3. Company Financials
- 12.1.4.4. SWOT Analysis
- 12.1.5 SEQUENS
- 12.1.5.1. Company Overview
- 12.1.5.2. Products
- 12.1.5.3. Company Financials
- 12.1.5.4. SWOT Analysis
- 12.1.6 MISR Chemical Industries
- 12.1.6.1. Company Overview
- 12.1.6.2. Products
- 12.1.6.3. Company Financials
- 12.1.6.4. SWOT Analysis
- 12.1.7 Feralco AB
- 12.1.7.1. Company Overview
- 12.1.7.2. Products
- 12.1.7.3. Company Financials
- 12.1.7.4. SWOT Analysis
- 12.1.8 Chemifloc LTD
- 12.1.8.1. Company Overview
- 12.1.8.2. Products
- 12.1.8.3. Company Financials
- 12.1.8.4. SWOT Analysis
- 12.1.9 Saf Sulphur Factory
- 12.1.9.1. Company Overview
- 12.1.9.2. Products
- 12.1.9.3. Company Financials
- 12.1.9.4. SWOT Analysis
- 12.1.10 BASF SE
- 12.1.10.1. Company Overview
- 12.1.10.2. Products
- 12.1.10.3. Company Financials
- 12.1.10.4. SWOT Analysis
- 12.1.11 Kemira
- 12.1.11.1. Company Overview
- 12.1.11.2. Products
- 12.1.11.3. Company Financials
- 12.1.11.4. SWOT Analysis
- 12.1.12 HORIZON CHEMICALS
- 12.1.12.1. Company Overview
- 12.1.12.2. Products
- 12.1.12.3. Company Financials
- 12.1.12.4. SWOT Analysis
- 12.1.13 SIDRA WASSERCHEMIE GmbH
- 12.1.13.1. Company Overview
- 12.1.13.2. Products
- 12.1.13.3. Company Financials
- 12.1.13.4. SWOT Analysis
- 12.1.14 Basic Chemical Industries
- 12.1.14.1. Company Overview
- 12.1.14.2. Products
- 12.1.14.3. Company Financials
- 12.1.14.4. SWOT Analysis
- 12.1.15 Nobian
- 12.1.15.1. Company Overview
- 12.1.15.2. Products
- 12.1.15.3. Company Financials
- 12.1.15.4. SWOT Analysis
- 12.1.1 CHIMI ART
- 12.2. Market Entropy
- 12.2.1 Company's Key Areas Served
- 12.2.2 Recent Developments
- 12.3. Company Market Share Analysis 2025
- 12.3.1 Top 5 Companies Market Share Analysis
- 12.3.2 Top 3 Companies Market Share Analysis
- 12.4. List of Potential Customers
- 13. Research Methodology
List of Figures
- Figure 1: Global Ferric Chloride Industry Revenue Breakdown (million, %) by Region 2025 & 2033
- Figure 2: Asia Pacific Ferric Chloride Industry Revenue (million), by Application 2025 & 2033
- Figure 3: Asia Pacific Ferric Chloride Industry Revenue Share (%), by Application 2025 & 2033
- Figure 4: Asia Pacific Ferric Chloride Industry Revenue (million), by Country 2025 & 2033
- Figure 5: Asia Pacific Ferric Chloride Industry Revenue Share (%), by Country 2025 & 2033
- Figure 6: North America Ferric Chloride Industry Revenue (million), by Application 2025 & 2033
- Figure 7: North America Ferric Chloride Industry Revenue Share (%), by Application 2025 & 2033
- Figure 8: North America Ferric Chloride Industry Revenue (million), by Country 2025 & 2033
- Figure 9: North America Ferric Chloride Industry Revenue Share (%), by Country 2025 & 2033
- Figure 10: Europe Ferric Chloride Industry Revenue (million), by Application 2025 & 2033
- Figure 11: Europe Ferric Chloride Industry Revenue Share (%), by Application 2025 & 2033
- Figure 12: Europe Ferric Chloride Industry Revenue (million), by Country 2025 & 2033
- Figure 13: Europe Ferric Chloride Industry Revenue Share (%), by Country 2025 & 2033
- Figure 14: South America Ferric Chloride Industry Revenue (million), by Application 2025 & 2033
- Figure 15: South America Ferric Chloride Industry Revenue Share (%), by Application 2025 & 2033
- Figure 16: South America Ferric Chloride Industry Revenue (million), by Country 2025 & 2033
- Figure 17: South America Ferric Chloride Industry Revenue Share (%), by Country 2025 & 2033
- Figure 18: Middle East and Africa Ferric Chloride Industry Revenue (million), by Application 2025 & 2033
- Figure 19: Middle East and Africa Ferric Chloride Industry Revenue Share (%), by Application 2025 & 2033
- Figure 20: Middle East and Africa Ferric Chloride Industry Revenue (million), by Country 2025 & 2033
- Figure 21: Middle East and Africa Ferric Chloride Industry Revenue Share (%), by Country 2025 & 2033
List of Tables
- Table 1: Global Ferric Chloride Industry Revenue million Forecast, by Application 2020 & 2033
- Table 2: Global Ferric Chloride Industry Revenue million Forecast, by Region 2020 & 2033
- Table 3: Global Ferric Chloride Industry Revenue million Forecast, by Application 2020 & 2033
- Table 4: Global Ferric Chloride Industry Revenue million Forecast, by Country 2020 & 2033
- Table 5: China Ferric Chloride Industry Revenue (million) Forecast, by Application 2020 & 2033
- Table 6: India Ferric Chloride Industry Revenue (million) Forecast, by Application 2020 & 2033
- Table 7: Japan Ferric Chloride Industry Revenue (million) Forecast, by Application 2020 & 2033
- Table 8: South Korea Ferric Chloride Industry Revenue (million) Forecast, by Application 2020 & 2033
- Table 9: ASEAN Countries Ferric Chloride Industry Revenue (million) Forecast, by Application 2020 & 2033
- Table 10: Rest of Asia Pacific Ferric Chloride Industry Revenue (million) Forecast, by Application 2020 & 2033
- Table 11: Global Ferric Chloride Industry Revenue million Forecast, by Application 2020 & 2033
- Table 12: Global Ferric Chloride Industry Revenue million Forecast, by Country 2020 & 2033
- Table 13: United States Ferric Chloride Industry Revenue (million) Forecast, by Application 2020 & 2033
- Table 14: Canada Ferric Chloride Industry Revenue (million) Forecast, by Application 2020 & 2033
- Table 15: Mexico Ferric Chloride Industry Revenue (million) Forecast, by Application 2020 & 2033
- Table 16: Global Ferric Chloride Industry Revenue million Forecast, by Application 2020 & 2033
- Table 17: Global Ferric Chloride Industry Revenue million Forecast, by Country 2020 & 2033
- Table 18: Germany Ferric Chloride Industry Revenue (million) Forecast, by Application 2020 & 2033
- Table 19: United Kingdom Ferric Chloride Industry Revenue (million) Forecast, by Application 2020 & 2033
- Table 20: Italy Ferric Chloride Industry Revenue (million) Forecast, by Application 2020 & 2033
- Table 21: France Ferric Chloride Industry Revenue (million) Forecast, by Application 2020 & 2033
- Table 22: Russia Ferric Chloride Industry Revenue (million) Forecast, by Application 2020 & 2033
- Table 23: Spain Ferric Chloride Industry Revenue (million) Forecast, by Application 2020 & 2033
- Table 24: Rest of Europe Ferric Chloride Industry Revenue (million) Forecast, by Application 2020 & 2033
- Table 25: Global Ferric Chloride Industry Revenue million Forecast, by Application 2020 & 2033
- Table 26: Global Ferric Chloride Industry Revenue million Forecast, by Country 2020 & 2033
- Table 27: Brazil Ferric Chloride Industry Revenue (million) Forecast, by Application 2020 & 2033
- Table 28: Argentina Ferric Chloride Industry Revenue (million) Forecast, by Application 2020 & 2033
- Table 29: Rest of South America Ferric Chloride Industry Revenue (million) Forecast, by Application 2020 & 2033
- Table 30: Global Ferric Chloride Industry Revenue million Forecast, by Application 2020 & 2033
- Table 31: Global Ferric Chloride Industry Revenue million Forecast, by Country 2020 & 2033
- Table 32: Saudi Arabia Ferric Chloride Industry Revenue (million) Forecast, by Application 2020 & 2033
- Table 33: Egypt Ferric Chloride Industry Revenue (million) Forecast, by Application 2020 & 2033
- Table 34: South Africa Ferric Chloride Industry Revenue (million) Forecast, by Application 2020 & 2033
- Table 35: Rest of Middle East and Africa Ferric Chloride Industry Revenue (million) Forecast, by Application 2020 & 2033
Frequently Asked Questions
1. What is the projected Compound Annual Growth Rate (CAGR) of the Ferric Chloride Industry?
The projected CAGR is approximately 4.8%.
2. Which companies are prominent players in the Ferric Chloride Industry?
Key companies in the market include CHIMI ART, Tessenderlo Group*List Not Exhaustive, MALAY-SINO CHEMICAL INDUSTRIES SDN BHD, PVS Technologies Inc, SEQUENS, MISR Chemical Industries, Feralco AB, Chemifloc LTD, Saf Sulphur Factory, BASF SE, Kemira, HORIZON CHEMICALS, SIDRA WASSERCHEMIE GmbH, Basic Chemical Industries, Nobian.
3. What are the main segments of the Ferric Chloride Industry?
The market segments include Application.
4. Can you provide details about the market size?
The market size is estimated to be USD 663 million as of 2022.
5. What are some drivers contributing to market growth?
High Demand from Wastewater Treatment Plants; Increasing Stringent Norms for the Treatment of Sewage Water and Industrial Waste to Curtail Pollution.
6. What are the notable trends driving market growth?
Increasing Applications in the Printed Circuit Board (PCB).
7. Are there any restraints impacting market growth?
Stringent Regulations Imposed on Companies during the Manufacturing and Shipment of Ferric Chloride Products; Presence of Substitutes Products.
8. Can you provide examples of recent developments in the market?
In February 2022, Chemieanlagenbau Chemnitz announced that the company commissioned its first ferric chloride plant for its client Al Kout Industrial Projects (AIP) at Shuaiba in the Persian Gulf, Kuwait. The plant uses feedstock such as iron scrap, hydrochloric acid and chlorine gas and has an annual production capacity of 20,000 tons of ferric chloride (FeCl3).
9. What pricing options are available for accessing the report?
Pricing options include single-user, multi-user, and enterprise licenses priced at USD 4750, USD 5250, and USD 8750 respectively.
10. Is the market size provided in terms of value or volume?
The market size is provided in terms of value, measured in million.
11. Are there any specific market keywords associated with the report?
Yes, the market keyword associated with the report is "Ferric Chloride Industry," which aids in identifying and referencing the specific market segment covered.
12. How do I determine which pricing option suits my needs best?
The pricing options vary based on user requirements and access needs. Individual users may opt for single-user licenses, while businesses requiring broader access may choose multi-user or enterprise licenses for cost-effective access to the report.
13. Are there any additional resources or data provided in the Ferric Chloride Industry report?
While the report offers comprehensive insights, it's advisable to review the specific contents or supplementary materials provided to ascertain if additional resources or data are available.
14. How can I stay updated on further developments or reports in the Ferric Chloride Industry?
To stay informed about further developments, trends, and reports in the Ferric Chloride Industry, consider subscribing to industry newsletters, following relevant companies and organizations, or regularly checking reputable industry news sources and publications.
Methodology
Step 1 - Identification of Relevant Samples Size from Population Database


Step 2 - Approaches for Defining Global Market Size (Value, Volume* & Price*)

Note*: In applicable scenarios
Step 3 - Data Sources
Primary Research
- Web Analytics
- Survey Reports
- Research Institute
- Latest Research Reports
- Opinion Leaders
Secondary Research
- Annual Reports
- White Paper
- Latest Press Release
- Industry Association
- Paid Database
- Investor Presentations

Step 4 - Data Triangulation
Involves using different sources of information in order to increase the validity of a study
These sources are likely to be stakeholders in a program - participants, other researchers, program staff, other community members, and so on.
Then we put all data in single framework & apply various statistical tools to find out the dynamic on the market.
During the analysis stage, feedback from the stakeholder groups would be compared to determine areas of agreement as well as areas of divergence