

Key Insights
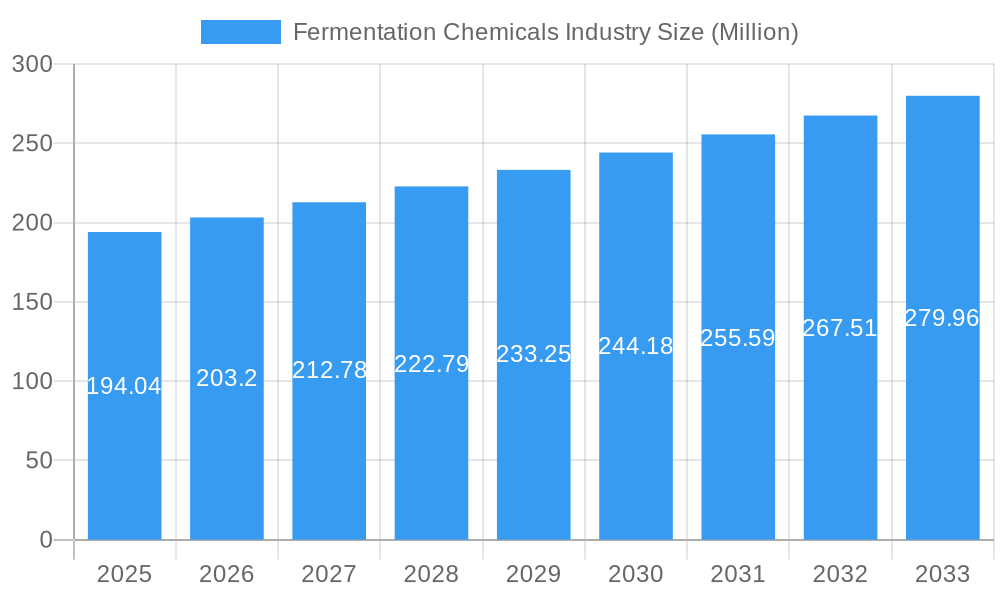
The global fermentation chemicals market, valued at $194.04 million in 2025, is projected to experience robust growth, driven by a compound annual growth rate (CAGR) of 4.60% from 2025 to 2033. This expansion is fueled by several key factors. The increasing demand for bio-based products across diverse sectors, including food and beverages, pharmaceuticals, and industrial applications, is a significant driver. The rising consumer preference for natural and sustainable ingredients is further propelling market growth. Advancements in fermentation technology, leading to improved efficiency and cost-effectiveness, contribute to the industry's expansion. Specifically, the development of novel enzymes and microbial strains allows for the production of higher-value chemicals and enables access to a wider range of applications. The growing focus on bio-based plastics and fibers represents a substantial emerging market segment. While regulatory hurdles and potential supply chain vulnerabilities may pose some constraints, the overall market outlook remains positive, with significant potential for expansion in both established and developing economies.
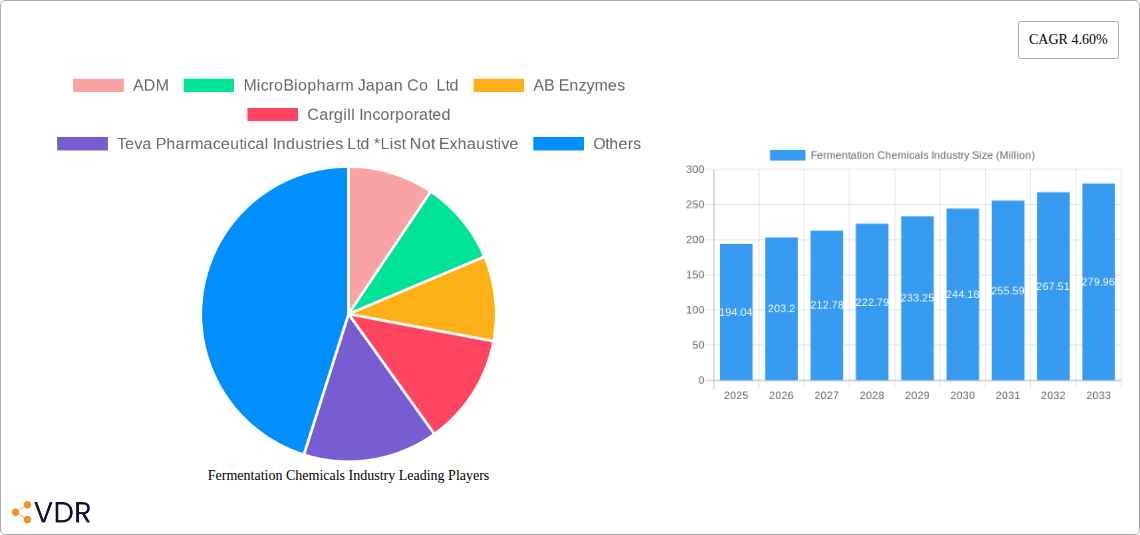
Fermentation Chemicals Industry Market Size (In Million)
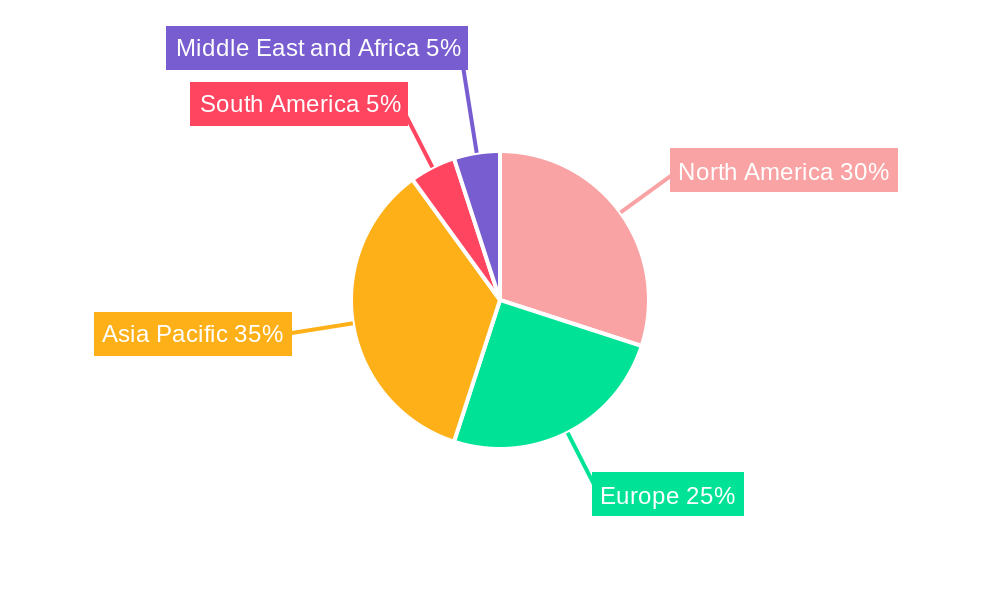
The Asia Pacific region, particularly China and India, is expected to be a major contributor to market growth due to its expanding industrial base and burgeoning food and beverage sectors. North America and Europe will also maintain substantial market shares, driven by innovation and a strong presence of established players. Alcohols and organic acids currently hold the largest market share within the product type segment, while industrial applications dominate in terms of application. However, the pharmaceutical and nutritional application segments are expected to exhibit faster growth rates due to increasing demand for bio-based pharmaceuticals and nutraceuticals. Key players, including ADM, Cargill, Novozymes, and BASF, are strategically investing in research and development, capacity expansion, and mergers and acquisitions to consolidate their market positions and capitalize on emerging opportunities. This competitive landscape fosters innovation and further strengthens the market’s growth trajectory.
Fermentation Chemicals Industry Company Market Share
Fermentation Chemicals Industry Market Report: 2019-2033
This comprehensive report provides an in-depth analysis of the global fermentation chemicals market, offering invaluable insights for industry professionals, investors, and strategic decision-makers. Covering the period from 2019 to 2033, with a base year of 2025, this report meticulously examines market dynamics, growth trends, competitive landscapes, and future opportunities within this rapidly evolving sector. The report segments the market by product type (Alcohols, Organic Acids, Enzymes, Other Product Types) and application (Industrial, Food and Beverage, Pharmaceutical and Nutritional, Plastics and Fibers, Other Applications), providing a granular understanding of each segment's performance and growth potential. The total market size is projected to reach xx Million by 2033.
Fermentation Chemicals Industry Market Dynamics & Structure
This section analyzes the structural composition of the fermentation chemicals market, encompassing market concentration, technological innovation drivers, regulatory frameworks, competitive product substitutes, end-user demographics, and mergers and acquisitions (M&A) trends. The market is moderately concentrated, with key players like ADM, Cargill Incorporated, and Novozymes holding significant market share. However, the presence of numerous smaller players and continuous innovation fosters a dynamic competitive landscape.
- Market Concentration: The top 5 players hold approximately xx% of the global market share in 2025.
- Technological Innovation: Advances in biocatalysis and metabolic engineering are driving efficiency and cost reductions.
- Regulatory Framework: Stringent regulations regarding food safety and pharmaceutical purity influence market dynamics.
- Competitive Substitutes: Chemically synthesized alternatives pose a competitive threat, particularly in price-sensitive applications.
- End-User Demographics: The growing global population and increasing demand for processed food, pharmaceuticals, and biomaterials are key drivers.
- M&A Trends: Consolidation is expected to continue, with larger companies acquiring smaller players to expand their product portfolios and geographical reach. An estimated xx M&A deals occurred between 2019 and 2024.
Fermentation Chemicals Industry Growth Trends & Insights
The global fermentation chemicals market experienced robust growth during the historical period (2019-2024), driven by rising demand across diverse applications. The market is projected to maintain a healthy Compound Annual Growth Rate (CAGR) of xx% during the forecast period (2025-2033). This growth is fueled by several factors, including the increasing preference for natural and sustainable products, technological advancements in fermentation processes, and the expansion of applications in various end-use industries. The market penetration of fermentation-based chemicals is also expected to increase significantly, particularly in emerging economies. Consumer behavior shifts towards healthier and more sustainable options further bolster market growth. Technological disruptions, such as precision fermentation and synthetic biology, are poised to revolutionize the industry, creating new opportunities and driving further expansion.
Dominant Regions, Countries, or Segments in Fermentation Chemicals Industry
North America currently leads the global fermentation chemicals market, bolstered by a robust presence of key industry players and a well-established regulatory landscape. Europe follows, with a strong focus on sustainable production and advanced biotechnologies. Asia-Pacific is demonstrating significant growth momentum, driven by its expanding industrial base, increasing consumer demand for bio-based products, and rising disposable incomes, particularly in countries like China and India. The market is segmented by product type, with enzymes anticipated to maintain their dominance due to their broad applicability and increasing adoption in sectors like food and beverages, animal feed, textiles, and pharmaceuticals. Other significant product categories include organic acids, alcohols, and amino acids. In terms of application, the food and beverage industry remains the largest consumer, driven by the demand for natural ingredients, flavor enhancers, and functional additives. The pharmaceutical and nutraceutical sectors also represent substantial growth areas, leveraging fermentation for the production of active pharmaceutical ingredients (APIs), vitamins, and probiotics.
- North America's Leadership: Supported by extensive research and development, advanced manufacturing capabilities, and favorable government initiatives promoting bio-based industries.
- Asia-Pacific's Growth Trajectory: Fueled by rapid industrialization, a growing middle class, and increasing investments in biotechnology and sustainable manufacturing.
- Enzymes as a Key Segment: Their versatile applications, improved cost-effectiveness through technological advancements, and superior environmental profiles compared to traditional chemical catalysts are driving their market penetration.
- Food & Beverage Dominance: Driven by consumer preferences for cleaner labels, healthier food options, and the need for efficient processing aids.
- Emerging Applications: Growing interest in bio-plastics, biofuels, and specialty chemicals derived from fermentation processes.
Fermentation Chemicals Industry Product Landscape
The fermentation chemicals market encompasses a wide array of products, meticulously developed through sophisticated biological processes. Key categories include alcohols (like ethanol and butanol for biofuels and industrial solvents), organic acids (such as citric acid, lactic acid, and acetic acid, vital in food, pharmaceuticals, and biodegradable polymers), and a diverse range of enzymes (amylases, proteases, lipases, cellulases, used across industries for catalysis and specific reactions). Specialty chemicals and biopolymers are also gaining traction. Continuous innovation in strain development, fermentation media optimization, and downstream processing is leading to the creation of high-performance products characterized by improved yield, purity, stability, and enhanced functional properties. Unique selling propositions often highlight their sustainability advantages, such as reduced carbon footprint, biodegradability, and non-toxicity, making them attractive alternatives to petrochemical-based counterparts. Technological advancements, including CRISPR-Cas9 gene editing for strain improvement, synthetic biology for novel pathway discovery, and advanced process control for scalability, are pivotal in enhancing product efficacy, reducing production costs, and ensuring consistent quality.
Key Drivers, Barriers & Challenges in Fermentation Chemicals Industry
Key Drivers:
- Growing Demand for Sustainable and Bio-Based Products: A significant global shift towards eco-friendly solutions, driven by environmental concerns and consumer awareness, is propelling the demand for fermentation-derived chemicals.
- Advancements in Biotechnology and Fermentation Technologies: Innovations in synthetic biology, metabolic engineering, and process optimization are leading to higher yields, reduced production costs, and the development of novel products with enhanced functionalities.
- Increasing Focus on Health, Wellness, and Nutrition: The rising consumer interest in natural ingredients, probiotics, and functional foods, many of which are produced through fermentation, is a major market driver.
- Government Support and Regulatory Initiatives: Favorable policies promoting the bioeconomy, renewable energy, and sustainable agriculture are creating a conducive environment for the industry's growth.
- Versatility of Fermentation Processes: The ability to produce a wide range of complex molecules and materials from renewable feedstocks makes fermentation a highly adaptable technology.
Key Barriers & Challenges:
- High Initial Investment and Scale-Up Costs: Establishing large-scale fermentation facilities and optimizing production processes can require substantial capital expenditure.
- Stringent Regulatory Approval Processes: For applications in food, pharmaceuticals, and cosmetics, obtaining regulatory approval can be time-consuming and complex, requiring extensive safety and efficacy data.
- Competition from Petrochemical Alternatives: While sustainability is a growing factor, established and often cheaper chemically synthesized alternatives continue to pose a competitive threat. This competition is projected to cost the industry approximately 2.5 Billion USD in lost revenue by 2033 if cost efficiencies are not further improved.
- Feedstock Availability and Cost Volatility: The reliance on agricultural feedstocks can lead to price fluctuations and availability issues due to climate change and competing uses.
- Strain Stability and Contamination Risks: Maintaining the genetic stability of microbial strains and preventing contamination during large-scale fermentation can be technically challenging.
Emerging Opportunities in Fermentation Chemicals Industry
The fermentation chemicals industry is ripe with emerging opportunities, driven by scientific breakthroughs and evolving market demands. Key areas of potential include the exploration and commercialization of novel fermentation pathways for producing high-value chemicals, such as advanced biofuels, biodegradable polymers (e.g., PHA, PLA), and specialized nutraceuticals. The development of bio-based materials that can replace traditional plastics and synthetic fibers presents a significant avenue for growth. Furthermore, leveraging fermentation for waste valorization—converting agricultural, industrial, or municipal waste streams into valuable chemicals and energy—offers a sustainable and cost-effective approach. Untapped markets in developing regions, particularly in Africa and South America, present substantial untapped growth potential due to increasing industrialization and a growing demand for affordable, sustainable products. The burgeoning trend towards personalized nutrition and specialized functional foods opens doors for tailored fermentation products, catering to specific dietary needs and health outcomes. The circular economy principles are also driving opportunities in creating closed-loop systems where by-products from one fermentation process can serve as feedstock for another.
Growth Accelerators in the Fermentation Chemicals Industry
Long-term growth will be driven by strategic collaborations between chemical companies and biotechnology firms, technological breakthroughs in precision fermentation and synthetic biology, and expansion into new geographical markets. Government initiatives promoting bio-based economies and sustainable development will further accelerate market growth.
Key Players Shaping the Fermentation Chemicals Industry Market
- ADM (Archer Daniels Midland Company) - A global leader in agricultural origination and processing, with a significant presence in bio-based chemicals and food ingredients.
- MicroBiopharm Japan Co Ltd - Specializes in the development and manufacturing of microbial products.
- AB Enzymes - A prominent enzyme producer, offering solutions for various industrial applications including food, feed, and textiles.
- Cargill Incorporated - A diversified food, agriculture, financial, and industrial products company, with extensive operations in fermentation-derived ingredients.
- Teva Pharmaceutical Industries Ltd - A global pharmaceutical company, utilizing fermentation in the production of certain active pharmaceutical ingredients.
- BioVectra - A leading contract development and manufacturing organization (CDMO) for biopharmaceuticals and fine chemicals.
- Novozymes - The world's leading producer of industrial enzymes and microorganisms, with a strong focus on sustainable solutions.
- Evonik Industries AG - A specialty chemicals company that leverages biotechnology and fermentation for the production of amino acids, cosmetic ingredients, and other high-value products.
- Ajinomoto Co Inc - A global leader in amino acids, with extensive expertise in fermentation for food, pharmaceuticals, and chemicals.
- Chr Hansen Holding A/S - A global bioscience company, providing cultures, enzymes, and probiotics for the food, health, and agricultural industries.
- BASF SE - A leading chemical company that utilizes fermentation for the production of various chemicals, including vitamins and biodegradable polymers.
- Biocon - A biopharmaceutical company focused on research-driven innovation, with significant capabilities in fermentation for biotherapeutics.
- DSM - A global science-based company active in health, nutrition, and bioscience, with a strong portfolio of fermented products.
- Novasep - A provider of purification solutions and services for the biopharmaceutical and chemical industries, often involving fermentation-derived products.
- Lonza - A global partner to the pharmaceutical, biotech, and nutrition markets, offering comprehensive manufacturing solutions, including fermentation.
Notable Milestones in Fermentation Chemicals Industry Sector
- 2020: Novozymes launched a new enzyme for improved biofuel production.
- 2021: Cargill Incorporated invested in a new fermentation facility in Brazil.
- 2022: A merger between two smaller fermentation chemical companies resulted in a combined market share of xx%.
- 2023: ADM introduced a new range of sustainable fermentation-based ingredients.
In-Depth Fermentation Chemicals Industry Market Outlook
The fermentation chemicals market is poised for sustained growth, driven by ongoing technological advancements, increasing consumer demand for natural and sustainable products, and expanding applications across diverse sectors. Strategic partnerships and acquisitions will continue to shape the industry landscape, creating new opportunities for innovation and market expansion. The projected market size of xx Million by 2033 indicates significant potential for investors and industry players.
Fermentation Chemicals Industry Segmentation
-
1. Product Type
- 1.1. Alcohols
- 1.2. Organic Acids
- 1.3. Enzymes
- 1.4. Other Product Types
-
2. Application
- 2.1. Industrial
- 2.2. Food and Beverage
- 2.3. Pharmaceutical and Nutritional
- 2.4. Plastics and Fibers
- 2.5. Other Applications
Fermentation Chemicals Industry Segmentation By Geography
-
1. Asia Pacific
- 1.1. China
- 1.2. India
- 1.3. Japan
- 1.4. South Korea
- 1.5. ASEAN Countries
- 1.6. Rest of Asia Pacific
-
2. North America
- 2.1. United States
- 2.2. Canada
- 2.3. Mexico
-
3. Europe
- 3.1. Germany
- 3.2. United Kingdom
- 3.3. Italy
- 3.4. France
- 3.5. Rest of Europe
-
4. South America
- 4.1. Brazil
- 4.2. Argentina
- 4.3. Rest of South America
-
5. Middle East and Africa
- 5.1. Saudi Arabia
- 5.2. South Africa
- 5.3. Rest of Middle East and Africa
Fermentation Chemicals Industry Regional Market Share
Geographic Coverage of Fermentation Chemicals Industry
Fermentation Chemicals Industry REPORT HIGHLIGHTS
| Aspects | Details |
|---|---|
| Study Period | 2020-2034 |
| Base Year | 2025 |
| Estimated Year | 2026 |
| Forecast Period | 2026-2034 |
| Historical Period | 2020-2025 |
| Growth Rate | CAGR of 4.60% from 2020-2034 |
| Segmentation |
|
Table of Contents
- 1. Introduction
- 1.1. Research Scope
- 1.2. Market Segmentation
- 1.3. Research Objective
- 1.4. Definitions and Assumptions
- 2. Executive Summary
- 2.1. Market Snapshot
- 3. Market Dynamics
- 3.1. Market Drivers
- 3.2. Market Restrains
- 3.3. Market Trends
- 3.4. Market Opportunities
- 4. Market Factor Analysis
- 4.1. Porters Five Forces
- 4.1.1. Bargaining Power of Suppliers
- 4.1.2. Bargaining Power of Buyers
- 4.1.3. Threat of New Entrants
- 4.1.4. Threat of Substitutes
- 4.1.5. Competitive Rivalry
- 4.2. PESTEL analysis
- 4.3. BCG Analysis
- 4.3.1. Stars (High Growth, High Market Share)
- 4.3.2. Cash Cows (Low Growth, High Market Share)
- 4.3.3. Question Mark (High Growth, Low Market Share)
- 4.3.4. Dogs (Low Growth, Low Market Share)
- 4.4. Ansoff Matrix Analysis
- 4.5. Supply Chain Analysis
- 4.6. Regulatory Landscape
- 4.7. Current Market Potential and Opportunity Assessment (TAM–SAM–SOM Framework)
- 4.8. VDR Analyst Note
- 4.1. Porters Five Forces
- 5. Market Analysis, Insights and Forecast 2021-2033
- 5.1. Market Analysis, Insights and Forecast - by Product Type
- 5.1.1. Alcohols
- 5.1.2. Organic Acids
- 5.1.3. Enzymes
- 5.1.4. Other Product Types
- 5.2. Market Analysis, Insights and Forecast - by Application
- 5.2.1. Industrial
- 5.2.2. Food and Beverage
- 5.2.3. Pharmaceutical and Nutritional
- 5.2.4. Plastics and Fibers
- 5.2.5. Other Applications
- 5.3. Market Analysis, Insights and Forecast - by Region
- 5.3.1. Asia Pacific
- 5.3.2. North America
- 5.3.3. Europe
- 5.3.4. South America
- 5.3.5. Middle East and Africa
- 5.1. Market Analysis, Insights and Forecast - by Product Type
- 6. Global Fermentation Chemicals Industry Analysis, Insights and Forecast, 2021-2033
- 6.1. Market Analysis, Insights and Forecast - by Product Type
- 6.1.1. Alcohols
- 6.1.2. Organic Acids
- 6.1.3. Enzymes
- 6.1.4. Other Product Types
- 6.2. Market Analysis, Insights and Forecast - by Application
- 6.2.1. Industrial
- 6.2.2. Food and Beverage
- 6.2.3. Pharmaceutical and Nutritional
- 6.2.4. Plastics and Fibers
- 6.2.5. Other Applications
- 6.1. Market Analysis, Insights and Forecast - by Product Type
- 7. Asia Pacific Fermentation Chemicals Industry Analysis, Insights and Forecast, 2021-2033
- 7.1. Market Analysis, Insights and Forecast - by Product Type
- 7.1.1. Alcohols
- 7.1.2. Organic Acids
- 7.1.3. Enzymes
- 7.1.4. Other Product Types
- 7.2. Market Analysis, Insights and Forecast - by Application
- 7.2.1. Industrial
- 7.2.2. Food and Beverage
- 7.2.3. Pharmaceutical and Nutritional
- 7.2.4. Plastics and Fibers
- 7.2.5. Other Applications
- 7.1. Market Analysis, Insights and Forecast - by Product Type
- 8. North America Fermentation Chemicals Industry Analysis, Insights and Forecast, 2021-2033
- 8.1. Market Analysis, Insights and Forecast - by Product Type
- 8.1.1. Alcohols
- 8.1.2. Organic Acids
- 8.1.3. Enzymes
- 8.1.4. Other Product Types
- 8.2. Market Analysis, Insights and Forecast - by Application
- 8.2.1. Industrial
- 8.2.2. Food and Beverage
- 8.2.3. Pharmaceutical and Nutritional
- 8.2.4. Plastics and Fibers
- 8.2.5. Other Applications
- 8.1. Market Analysis, Insights and Forecast - by Product Type
- 9. Europe Fermentation Chemicals Industry Analysis, Insights and Forecast, 2021-2033
- 9.1. Market Analysis, Insights and Forecast - by Product Type
- 9.1.1. Alcohols
- 9.1.2. Organic Acids
- 9.1.3. Enzymes
- 9.1.4. Other Product Types
- 9.2. Market Analysis, Insights and Forecast - by Application
- 9.2.1. Industrial
- 9.2.2. Food and Beverage
- 9.2.3. Pharmaceutical and Nutritional
- 9.2.4. Plastics and Fibers
- 9.2.5. Other Applications
- 9.1. Market Analysis, Insights and Forecast - by Product Type
- 10. South America Fermentation Chemicals Industry Analysis, Insights and Forecast, 2021-2033
- 10.1. Market Analysis, Insights and Forecast - by Product Type
- 10.1.1. Alcohols
- 10.1.2. Organic Acids
- 10.1.3. Enzymes
- 10.1.4. Other Product Types
- 10.2. Market Analysis, Insights and Forecast - by Application
- 10.2.1. Industrial
- 10.2.2. Food and Beverage
- 10.2.3. Pharmaceutical and Nutritional
- 10.2.4. Plastics and Fibers
- 10.2.5. Other Applications
- 10.1. Market Analysis, Insights and Forecast - by Product Type
- 11. Middle East and Africa Fermentation Chemicals Industry Analysis, Insights and Forecast, 2021-2033
- 11.1. Market Analysis, Insights and Forecast - by Product Type
- 11.1.1. Alcohols
- 11.1.2. Organic Acids
- 11.1.3. Enzymes
- 11.1.4. Other Product Types
- 11.2. Market Analysis, Insights and Forecast - by Application
- 11.2.1. Industrial
- 11.2.2. Food and Beverage
- 11.2.3. Pharmaceutical and Nutritional
- 11.2.4. Plastics and Fibers
- 11.2.5. Other Applications
- 11.1. Market Analysis, Insights and Forecast - by Product Type
- 12. Competitive Analysis
- 12.1. Company Profiles
- 12.1.1 ADM
- 12.1.1.1. Company Overview
- 12.1.1.2. Products
- 12.1.1.3. Company Financials
- 12.1.1.4. SWOT Analysis
- 12.1.2 MicroBiopharm Japan Co Ltd
- 12.1.2.1. Company Overview
- 12.1.2.2. Products
- 12.1.2.3. Company Financials
- 12.1.2.4. SWOT Analysis
- 12.1.3 AB Enzymes
- 12.1.3.1. Company Overview
- 12.1.3.2. Products
- 12.1.3.3. Company Financials
- 12.1.3.4. SWOT Analysis
- 12.1.4 Cargill Incorporated
- 12.1.4.1. Company Overview
- 12.1.4.2. Products
- 12.1.4.3. Company Financials
- 12.1.4.4. SWOT Analysis
- 12.1.5 Teva Pharmaceutical Industries Ltd *List Not Exhaustive
- 12.1.5.1. Company Overview
- 12.1.5.2. Products
- 12.1.5.3. Company Financials
- 12.1.5.4. SWOT Analysis
- 12.1.6 BioVectra
- 12.1.6.1. Company Overview
- 12.1.6.2. Products
- 12.1.6.3. Company Financials
- 12.1.6.4. SWOT Analysis
- 12.1.7 Novozymes
- 12.1.7.1. Company Overview
- 12.1.7.2. Products
- 12.1.7.3. Company Financials
- 12.1.7.4. SWOT Analysis
- 12.1.8 Evonik Industries AG
- 12.1.8.1. Company Overview
- 12.1.8.2. Products
- 12.1.8.3. Company Financials
- 12.1.8.4. SWOT Analysis
- 12.1.9 Ajinomoto Co Inc
- 12.1.9.1. Company Overview
- 12.1.9.2. Products
- 12.1.9.3. Company Financials
- 12.1.9.4. SWOT Analysis
- 12.1.10 Chr Hansen Holding A/S
- 12.1.10.1. Company Overview
- 12.1.10.2. Products
- 12.1.10.3. Company Financials
- 12.1.10.4. SWOT Analysis
- 12.1.11 BASF SE
- 12.1.11.1. Company Overview
- 12.1.11.2. Products
- 12.1.11.3. Company Financials
- 12.1.11.4. SWOT Analysis
- 12.1.12 Biocon
- 12.1.12.1. Company Overview
- 12.1.12.2. Products
- 12.1.12.3. Company Financials
- 12.1.12.4. SWOT Analysis
- 12.1.13 DSM
- 12.1.13.1. Company Overview
- 12.1.13.2. Products
- 12.1.13.3. Company Financials
- 12.1.13.4. SWOT Analysis
- 12.1.14 Novasep
- 12.1.14.1. Company Overview
- 12.1.14.2. Products
- 12.1.14.3. Company Financials
- 12.1.14.4. SWOT Analysis
- 12.1.15 Lonza
- 12.1.15.1. Company Overview
- 12.1.15.2. Products
- 12.1.15.3. Company Financials
- 12.1.15.4. SWOT Analysis
- 12.1.1 ADM
- 12.2. Market Entropy
- 12.2.1 Company's Key Areas Served
- 12.2.2 Recent Developments
- 12.3. Company Market Share Analysis 2025
- 12.3.1 Top 5 Companies Market Share Analysis
- 12.3.2 Top 3 Companies Market Share Analysis
- 12.4. List of Potential Customers
- 13. Research Methodology
List of Figures
- Figure 1: Global Fermentation Chemicals Industry Revenue Breakdown (Million, %) by Region 2025 & 2033
- Figure 2: Asia Pacific Fermentation Chemicals Industry Revenue (Million), by Product Type 2025 & 2033
- Figure 3: Asia Pacific Fermentation Chemicals Industry Revenue Share (%), by Product Type 2025 & 2033
- Figure 4: Asia Pacific Fermentation Chemicals Industry Revenue (Million), by Application 2025 & 2033
- Figure 5: Asia Pacific Fermentation Chemicals Industry Revenue Share (%), by Application 2025 & 2033
- Figure 6: Asia Pacific Fermentation Chemicals Industry Revenue (Million), by Country 2025 & 2033
- Figure 7: Asia Pacific Fermentation Chemicals Industry Revenue Share (%), by Country 2025 & 2033
- Figure 8: North America Fermentation Chemicals Industry Revenue (Million), by Product Type 2025 & 2033
- Figure 9: North America Fermentation Chemicals Industry Revenue Share (%), by Product Type 2025 & 2033
- Figure 10: North America Fermentation Chemicals Industry Revenue (Million), by Application 2025 & 2033
- Figure 11: North America Fermentation Chemicals Industry Revenue Share (%), by Application 2025 & 2033
- Figure 12: North America Fermentation Chemicals Industry Revenue (Million), by Country 2025 & 2033
- Figure 13: North America Fermentation Chemicals Industry Revenue Share (%), by Country 2025 & 2033
- Figure 14: Europe Fermentation Chemicals Industry Revenue (Million), by Product Type 2025 & 2033
- Figure 15: Europe Fermentation Chemicals Industry Revenue Share (%), by Product Type 2025 & 2033
- Figure 16: Europe Fermentation Chemicals Industry Revenue (Million), by Application 2025 & 2033
- Figure 17: Europe Fermentation Chemicals Industry Revenue Share (%), by Application 2025 & 2033
- Figure 18: Europe Fermentation Chemicals Industry Revenue (Million), by Country 2025 & 2033
- Figure 19: Europe Fermentation Chemicals Industry Revenue Share (%), by Country 2025 & 2033
- Figure 20: South America Fermentation Chemicals Industry Revenue (Million), by Product Type 2025 & 2033
- Figure 21: South America Fermentation Chemicals Industry Revenue Share (%), by Product Type 2025 & 2033
- Figure 22: South America Fermentation Chemicals Industry Revenue (Million), by Application 2025 & 2033
- Figure 23: South America Fermentation Chemicals Industry Revenue Share (%), by Application 2025 & 2033
- Figure 24: South America Fermentation Chemicals Industry Revenue (Million), by Country 2025 & 2033
- Figure 25: South America Fermentation Chemicals Industry Revenue Share (%), by Country 2025 & 2033
- Figure 26: Middle East and Africa Fermentation Chemicals Industry Revenue (Million), by Product Type 2025 & 2033
- Figure 27: Middle East and Africa Fermentation Chemicals Industry Revenue Share (%), by Product Type 2025 & 2033
- Figure 28: Middle East and Africa Fermentation Chemicals Industry Revenue (Million), by Application 2025 & 2033
- Figure 29: Middle East and Africa Fermentation Chemicals Industry Revenue Share (%), by Application 2025 & 2033
- Figure 30: Middle East and Africa Fermentation Chemicals Industry Revenue (Million), by Country 2025 & 2033
- Figure 31: Middle East and Africa Fermentation Chemicals Industry Revenue Share (%), by Country 2025 & 2033
List of Tables
- Table 1: Global Fermentation Chemicals Industry Revenue Million Forecast, by Product Type 2020 & 2033
- Table 2: Global Fermentation Chemicals Industry Revenue Million Forecast, by Application 2020 & 2033
- Table 3: Global Fermentation Chemicals Industry Revenue Million Forecast, by Region 2020 & 2033
- Table 4: Global Fermentation Chemicals Industry Revenue Million Forecast, by Product Type 2020 & 2033
- Table 5: Global Fermentation Chemicals Industry Revenue Million Forecast, by Application 2020 & 2033
- Table 6: Global Fermentation Chemicals Industry Revenue Million Forecast, by Country 2020 & 2033
- Table 7: China Fermentation Chemicals Industry Revenue (Million) Forecast, by Application 2020 & 2033
- Table 8: India Fermentation Chemicals Industry Revenue (Million) Forecast, by Application 2020 & 2033
- Table 9: Japan Fermentation Chemicals Industry Revenue (Million) Forecast, by Application 2020 & 2033
- Table 10: South Korea Fermentation Chemicals Industry Revenue (Million) Forecast, by Application 2020 & 2033
- Table 11: ASEAN Countries Fermentation Chemicals Industry Revenue (Million) Forecast, by Application 2020 & 2033
- Table 12: Rest of Asia Pacific Fermentation Chemicals Industry Revenue (Million) Forecast, by Application 2020 & 2033
- Table 13: Global Fermentation Chemicals Industry Revenue Million Forecast, by Product Type 2020 & 2033
- Table 14: Global Fermentation Chemicals Industry Revenue Million Forecast, by Application 2020 & 2033
- Table 15: Global Fermentation Chemicals Industry Revenue Million Forecast, by Country 2020 & 2033
- Table 16: United States Fermentation Chemicals Industry Revenue (Million) Forecast, by Application 2020 & 2033
- Table 17: Canada Fermentation Chemicals Industry Revenue (Million) Forecast, by Application 2020 & 2033
- Table 18: Mexico Fermentation Chemicals Industry Revenue (Million) Forecast, by Application 2020 & 2033
- Table 19: Global Fermentation Chemicals Industry Revenue Million Forecast, by Product Type 2020 & 2033
- Table 20: Global Fermentation Chemicals Industry Revenue Million Forecast, by Application 2020 & 2033
- Table 21: Global Fermentation Chemicals Industry Revenue Million Forecast, by Country 2020 & 2033
- Table 22: Germany Fermentation Chemicals Industry Revenue (Million) Forecast, by Application 2020 & 2033
- Table 23: United Kingdom Fermentation Chemicals Industry Revenue (Million) Forecast, by Application 2020 & 2033
- Table 24: Italy Fermentation Chemicals Industry Revenue (Million) Forecast, by Application 2020 & 2033
- Table 25: France Fermentation Chemicals Industry Revenue (Million) Forecast, by Application 2020 & 2033
- Table 26: Rest of Europe Fermentation Chemicals Industry Revenue (Million) Forecast, by Application 2020 & 2033
- Table 27: Global Fermentation Chemicals Industry Revenue Million Forecast, by Product Type 2020 & 2033
- Table 28: Global Fermentation Chemicals Industry Revenue Million Forecast, by Application 2020 & 2033
- Table 29: Global Fermentation Chemicals Industry Revenue Million Forecast, by Country 2020 & 2033
- Table 30: Brazil Fermentation Chemicals Industry Revenue (Million) Forecast, by Application 2020 & 2033
- Table 31: Argentina Fermentation Chemicals Industry Revenue (Million) Forecast, by Application 2020 & 2033
- Table 32: Rest of South America Fermentation Chemicals Industry Revenue (Million) Forecast, by Application 2020 & 2033
- Table 33: Global Fermentation Chemicals Industry Revenue Million Forecast, by Product Type 2020 & 2033
- Table 34: Global Fermentation Chemicals Industry Revenue Million Forecast, by Application 2020 & 2033
- Table 35: Global Fermentation Chemicals Industry Revenue Million Forecast, by Country 2020 & 2033
- Table 36: Saudi Arabia Fermentation Chemicals Industry Revenue (Million) Forecast, by Application 2020 & 2033
- Table 37: South Africa Fermentation Chemicals Industry Revenue (Million) Forecast, by Application 2020 & 2033
- Table 38: Rest of Middle East and Africa Fermentation Chemicals Industry Revenue (Million) Forecast, by Application 2020 & 2033
Frequently Asked Questions
1. What is the projected Compound Annual Growth Rate (CAGR) of the Fermentation Chemicals Industry?
The projected CAGR is approximately 4.60%.
2. Which companies are prominent players in the Fermentation Chemicals Industry?
Key companies in the market include ADM, MicroBiopharm Japan Co Ltd, AB Enzymes, Cargill Incorporated, Teva Pharmaceutical Industries Ltd *List Not Exhaustive, BioVectra, Novozymes, Evonik Industries AG, Ajinomoto Co Inc, Chr Hansen Holding A/S, BASF SE, Biocon, DSM, Novasep, Lonza.
3. What are the main segments of the Fermentation Chemicals Industry?
The market segments include Product Type, Application.
4. Can you provide details about the market size?
The market size is estimated to be USD 194.04 Million as of 2022.
5. What are some drivers contributing to market growth?
Growing Demand from Methanol and Ethanol Industry; Increasing Demand from the Pharmaceutical Industry; Other Drivers.
6. What are the notable trends driving market growth?
Food and Beverage Sector to Dominate the Market.
7. Are there any restraints impacting market growth?
High Cost Due to the Complexity Involved in the Manufacturing Process; Other Restraints.
8. Can you provide examples of recent developments in the market?
N/A
9. What pricing options are available for accessing the report?
Pricing options include single-user, multi-user, and enterprise licenses priced at USD 4750, USD 5250, and USD 8750 respectively.
10. Is the market size provided in terms of value or volume?
The market size is provided in terms of value, measured in Million.
11. Are there any specific market keywords associated with the report?
Yes, the market keyword associated with the report is "Fermentation Chemicals Industry," which aids in identifying and referencing the specific market segment covered.
12. How do I determine which pricing option suits my needs best?
The pricing options vary based on user requirements and access needs. Individual users may opt for single-user licenses, while businesses requiring broader access may choose multi-user or enterprise licenses for cost-effective access to the report.
13. Are there any additional resources or data provided in the Fermentation Chemicals Industry report?
While the report offers comprehensive insights, it's advisable to review the specific contents or supplementary materials provided to ascertain if additional resources or data are available.
14. How can I stay updated on further developments or reports in the Fermentation Chemicals Industry?
To stay informed about further developments, trends, and reports in the Fermentation Chemicals Industry, consider subscribing to industry newsletters, following relevant companies and organizations, or regularly checking reputable industry news sources and publications.
Methodology
Step 1 - Identification of Relevant Samples Size from Population Database


Step 2 - Approaches for Defining Global Market Size (Value, Volume* & Price*)

Note*: In applicable scenarios
Step 3 - Data Sources
Primary Research
- Web Analytics
- Survey Reports
- Research Institute
- Latest Research Reports
- Opinion Leaders
Secondary Research
- Annual Reports
- White Paper
- Latest Press Release
- Industry Association
- Paid Database
- Investor Presentations

Step 4 - Data Triangulation
Involves using different sources of information in order to increase the validity of a study
These sources are likely to be stakeholders in a program - participants, other researchers, program staff, other community members, and so on.
Then we put all data in single framework & apply various statistical tools to find out the dynamic on the market.
During the analysis stage, feedback from the stakeholder groups would be compared to determine areas of agreement as well as areas of divergence