

Key Insights
The global Fatty Acid Methyl Ester (FAME) market is projected for significant expansion, with an estimated market size of $23.2 billion in the base year 2024, and is anticipated to grow at a Compound Annual Growth Rate (CAGR) of 5.6% through 2033. This growth is primarily propelled by the escalating demand for biofuels, driven by stricter environmental mandates and the urgent need for sustainable alternatives to conventional fossil fuels. The fuel applications segment is a major contributor, with rapeseed methyl ester and soy methyl ester leading as dominant types. Additionally, heightened environmental consciousness is fostering the adoption of FAMEs in lubricants, coatings, and personal care sectors. However, fluctuations in raw material pricing, such as vegetable oils, and potential competition from alternative biofuels present market challenges. Geographic expansion is also a key factor, with North America and Asia-Pacific poised as critical demand centers due to favorable government policies and burgeoning industrial activities. The broad spectrum of FAME applications, alongside continuous innovation in production efficiency, will ensure sustained market growth.
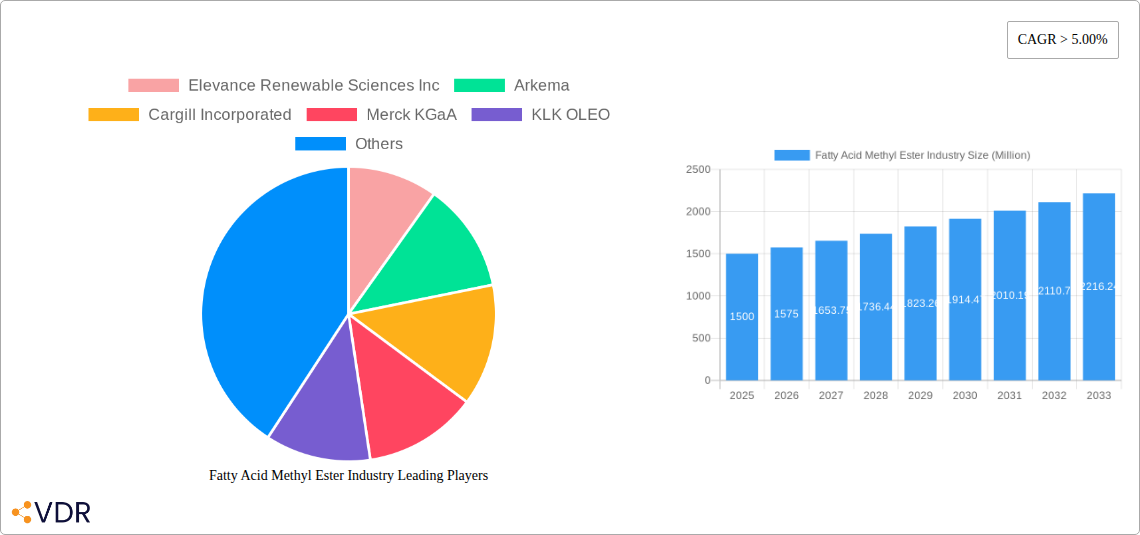
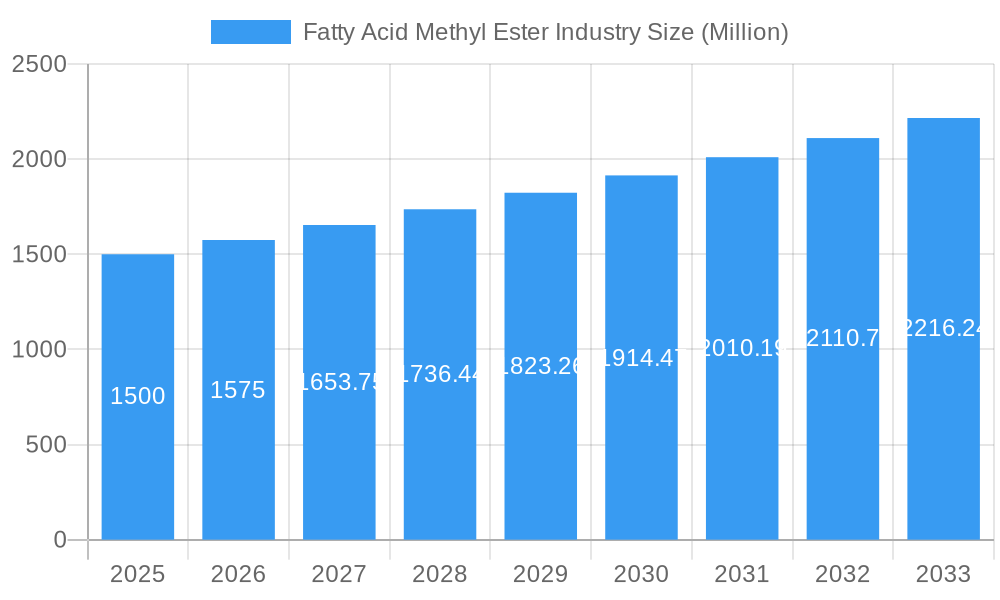
Fatty Acid Methyl Ester Industry Market Size (In Billion)
The competitive environment features established multinational corporations and niche chemical manufacturers. Leading entities like Elevance Renewable Sciences, Arkema, Cargill, and BASF are strategically positioned to leverage market expansion through investments in R&D, capacity enhancements, and supply chain partnerships. The market is also experiencing increased engagement from regional players, especially in Asia-Pacific, which is expected to intensify competition and foster innovation. Companies are prioritizing sustainable and economical production methodologies to remain competitive and address the global FAME demand. Strategic agility in adapting to regulatory shifts and evolving consumer preferences, while delivering superior, cost-effective products, will be crucial for company success.
Fatty Acid Methyl Ester Industry Company Market Share
Fatty Acid Methyl Ester (FAME) Industry Market Report: 2019-2033
This comprehensive report provides an in-depth analysis of the global Fatty Acid Methyl Ester (FAME) industry, encompassing market dynamics, growth trends, regional insights, product landscape, and key player strategies. The report covers the period 2019-2033, with a focus on 2025 as the base and estimated year. This crucial industry research will benefit investors, manufacturers, researchers, and industry professionals seeking to navigate the complexities and opportunities within this rapidly evolving market. The parent market is the biofuels industry, while the child market is specifically renewable fuels and specialty chemicals.
Fatty Acid Methyl Ester Industry Market Dynamics & Structure
The FAME market is characterized by moderate concentration, with key players like Cargill Incorporated, BASF SE, and Wilmar International Ltd. holding significant market share. Technological innovation, particularly in sustainable feedstock sourcing and efficient production processes, is a major driver. Stringent environmental regulations worldwide are pushing adoption, while the emergence of competitive biofuel substitutes, like second-generation biofuels, pose a challenge. Market consolidation through mergers and acquisitions (M&A) is another notable trend.
- Market Concentration: The top 5 players hold approximately xx% of the global market share in 2025.
- Technological Innovation: Focus on improving catalyst efficiency and reducing energy consumption during the transesterification process is ongoing.
- Regulatory Framework: Government mandates and incentives for renewable fuels are key growth drivers, varying significantly by region.
- Competitive Substitutes: Competition from other biofuels and petrochemical-based products influences market growth.
- End-User Demographics: The largest end-users are in the fuel and lubricant sectors, with growing demand in food and agriculture applications.
- M&A Trends: xx M&A deals were recorded in the FAME industry between 2019 and 2024, primarily focused on expanding feedstock access and production capacity.
Fatty Acid Methyl Ester Industry Growth Trends & Insights
The global FAME market experienced significant growth from 2019 to 2024, driven by increased demand for renewable energy sources and stringent emission regulations. The market size is estimated at XXX million units in 2025, projected to reach XXX million units by 2033, exhibiting a CAGR of xx%. This growth is fueled by increasing adoption rates in various sectors, particularly in the transportation and industrial sectors. Technological advancements, like the development of next-generation catalysts and process optimization, further contribute to the market's growth. Shifting consumer preferences towards environmentally friendly products are influencing the demand for FAME-based products in the personal care and food segments.
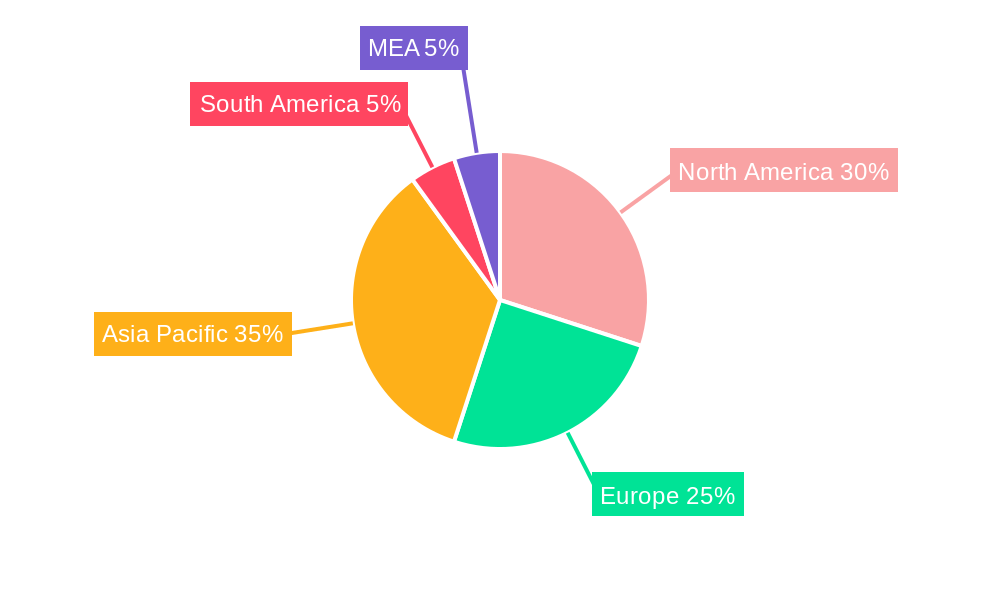
Dominant Regions, Countries, or Segments in Fatty Acid Methyl Ester Industry
The Asia-Pacific region dominates the FAME market due to the high demand for biodiesel, driven by supportive government policies in countries like India and China. The fuel segment holds the largest market share, followed by the lubricants segment. Europe is also a significant market, driven by stringent environmental regulations and a focus on sustainable transportation. Within the types of FAME, Soy Methyl Ester and Rapeseed Methyl Ester hold the largest shares, benefiting from regional agricultural practices and established supply chains.
- Key Drivers (Asia-Pacific): Government mandates for biodiesel blending, growing automotive sector, readily available feedstocks.
- Key Drivers (Europe): Stringent emission standards, supportive policies for renewable energy, growing awareness of environmental sustainability.
- Dominant Segments: Fuel (xx% market share in 2025), Soy Methyl Ester (xx% market share in 2025), and Rapeseed Methyl Ester (xx% market share in 2025).
- Growth Potential: Significant growth potential in emerging markets in Latin America and Africa, driven by increasing energy demand and governmental initiatives.
Fatty Acid Methyl Ester Industry Product Landscape
FAME products are characterized by their diverse applications across various industries. Recent innovations focus on enhancing fuel properties, improving lubricity, and expanding applications in specialty chemicals and personal care. This includes improvements in purity, stability, and the development of customized FAME blends tailored to specific applications, including higher-quality, specialized lubricants and performance-enhanced coatings. The unique selling propositions center on their renewable nature, cost-competitiveness in certain applications, and favorable environmental impact compared to their petroleum-based counterparts.
Key Drivers, Barriers & Challenges in Fatty Acid Acid Methyl Ester Industry
Key Drivers:
- Growing demand for renewable energy sources driven by environmental concerns.
- Government regulations and incentives promoting the use of biofuels.
- Technological advancements improving FAME production efficiency and quality.
Key Challenges:
- Volatility in feedstock prices impacting production costs and profitability.
- Competition from other renewable and fossil fuel-based alternatives.
- Potential supply chain disruptions due to regional agricultural variations and geopolitical factors.
- Regulatory hurdles and varying standards across different regions.
Emerging Opportunities in Fatty Acid Methyl Ester Industry
Emerging opportunities lie in untapped markets, particularly in developing economies with growing energy demand. Innovative applications in the specialty chemicals sector, such as biodegradable plastics and surfactants, offer significant potential. Furthermore, the increasing demand for sustainable products across various industries (e.g., cosmetics, food) creates a pathway for growth.
Growth Accelerators in the Fatty Acid Methyl Ester Industry
Strategic partnerships between FAME producers and downstream users are accelerating growth. Technological breakthroughs in feedstock conversion and waste valorization are improving the sustainability and cost-effectiveness of FAME production. Expansion into new geographical markets, particularly in developing nations, presents significant opportunities for market expansion and increased production capacity.
Key Players Shaping the Fatty Acid Methyl Ester Industry Market
- Elevance Renewable Sciences Inc
- Arkema
- Cargill Incorporated
- Merck KGaA
- KLK OLEO
- Wilmar International Ltd
- TCI Chemicals (India) Pvt Ltd
- BASF SE
- Krishi Oils Limited
- Larodan AB (ABITEC)
- Univar Solutions Inc
- Cayman Chemical
Notable Milestones in Fatty Acid Methyl Ester Industry Sector
- Recent developments will be provided in the complete report.
In-Depth Fatty Acid Methyl Ester Industry Market Outlook
The future of the FAME market is bright, driven by the continued global push for renewable energy and sustainable practices. Strategic investments in R&D, efficient production facilities, and expansion into new applications and markets will be critical for success. The market presents considerable opportunities for growth to companies able to innovate and adapt to evolving regulatory landscapes and consumer preferences.
Fatty Acid Methyl Ester Industry Segmentation
-
1. Type
- 1.1. Rapeseed Methyl Ester
- 1.2. Soy Methyl Ester
- 1.3. Palm Oil Methyl Ester
- 1.4. Other Types
-
2. Application
- 2.1. Fuel
- 2.2. Lubricants
- 2.3. Coatings
- 2.4. Food and Agriculture
- 2.5. Metalworking Fluids
- 2.6. Personal Care Products
- 2.7. Other Applications
Fatty Acid Methyl Ester Industry Segmentation By Geography
-
1. Asia Pacific
- 1.1. China
- 1.2. India
- 1.3. Japan
- 1.4. South Korea
- 1.5. Rest of Asia Pacific
-
2. North America
- 2.1. United States
- 2.2. Canada
- 2.3. Mexico
-
3. Europe
- 3.1. Germany
- 3.2. United Kingdom
- 3.3. France
- 3.4. Italy
- 3.5. Rest of Europe
-
4. South America
- 4.1. Brazil
- 4.2. Argentina
- 4.3. Rest of South America
-
5. Middle East and Africa
- 5.1. Saudi Arabia
- 5.2. South Africa
- 5.3. Rest of Middle East and Africa
Fatty Acid Methyl Ester Industry Regional Market Share
Geographic Coverage of Fatty Acid Methyl Ester Industry
Fatty Acid Methyl Ester Industry REPORT HIGHLIGHTS
| Aspects | Details |
|---|---|
| Study Period | 2020-2034 |
| Base Year | 2025 |
| Estimated Year | 2026 |
| Forecast Period | 2026-2034 |
| Historical Period | 2020-2025 |
| Growth Rate | CAGR of 5.6% from 2020-2034 |
| Segmentation |
|
Table of Contents
- 1. Introduction
- 1.1. Research Scope
- 1.2. Market Segmentation
- 1.3. Research Objective
- 1.4. Definitions and Assumptions
- 2. Executive Summary
- 2.1. Market Snapshot
- 3. Market Dynamics
- 3.1. Market Drivers
- 3.2. Market Restrains
- 3.3. Market Trends
- 3.4. Market Opportunities
- 4. Market Factor Analysis
- 4.1. Porters Five Forces
- 4.1.1. Bargaining Power of Suppliers
- 4.1.2. Bargaining Power of Buyers
- 4.1.3. Threat of New Entrants
- 4.1.4. Threat of Substitutes
- 4.1.5. Competitive Rivalry
- 4.2. PESTEL analysis
- 4.3. BCG Analysis
- 4.3.1. Stars (High Growth, High Market Share)
- 4.3.2. Cash Cows (Low Growth, High Market Share)
- 4.3.3. Question Mark (High Growth, Low Market Share)
- 4.3.4. Dogs (Low Growth, Low Market Share)
- 4.4. Ansoff Matrix Analysis
- 4.5. Supply Chain Analysis
- 4.6. Regulatory Landscape
- 4.7. Current Market Potential and Opportunity Assessment (TAM–SAM–SOM Framework)
- 4.8. VDR Analyst Note
- 4.1. Porters Five Forces
- 5. Market Analysis, Insights and Forecast 2021-2033
- 5.1. Market Analysis, Insights and Forecast - by Type
- 5.1.1. Rapeseed Methyl Ester
- 5.1.2. Soy Methyl Ester
- 5.1.3. Palm Oil Methyl Ester
- 5.1.4. Other Types
- 5.2. Market Analysis, Insights and Forecast - by Application
- 5.2.1. Fuel
- 5.2.2. Lubricants
- 5.2.3. Coatings
- 5.2.4. Food and Agriculture
- 5.2.5. Metalworking Fluids
- 5.2.6. Personal Care Products
- 5.2.7. Other Applications
- 5.3. Market Analysis, Insights and Forecast - by Region
- 5.3.1. Asia Pacific
- 5.3.2. North America
- 5.3.3. Europe
- 5.3.4. South America
- 5.3.5. Middle East and Africa
- 5.1. Market Analysis, Insights and Forecast - by Type
- 6. Global Fatty Acid Methyl Ester Industry Analysis, Insights and Forecast, 2021-2033
- 6.1. Market Analysis, Insights and Forecast - by Type
- 6.1.1. Rapeseed Methyl Ester
- 6.1.2. Soy Methyl Ester
- 6.1.3. Palm Oil Methyl Ester
- 6.1.4. Other Types
- 6.2. Market Analysis, Insights and Forecast - by Application
- 6.2.1. Fuel
- 6.2.2. Lubricants
- 6.2.3. Coatings
- 6.2.4. Food and Agriculture
- 6.2.5. Metalworking Fluids
- 6.2.6. Personal Care Products
- 6.2.7. Other Applications
- 6.1. Market Analysis, Insights and Forecast - by Type
- 7. Asia Pacific Fatty Acid Methyl Ester Industry Analysis, Insights and Forecast, 2021-2033
- 7.1. Market Analysis, Insights and Forecast - by Type
- 7.1.1. Rapeseed Methyl Ester
- 7.1.2. Soy Methyl Ester
- 7.1.3. Palm Oil Methyl Ester
- 7.1.4. Other Types
- 7.2. Market Analysis, Insights and Forecast - by Application
- 7.2.1. Fuel
- 7.2.2. Lubricants
- 7.2.3. Coatings
- 7.2.4. Food and Agriculture
- 7.2.5. Metalworking Fluids
- 7.2.6. Personal Care Products
- 7.2.7. Other Applications
- 7.1. Market Analysis, Insights and Forecast - by Type
- 8. North America Fatty Acid Methyl Ester Industry Analysis, Insights and Forecast, 2021-2033
- 8.1. Market Analysis, Insights and Forecast - by Type
- 8.1.1. Rapeseed Methyl Ester
- 8.1.2. Soy Methyl Ester
- 8.1.3. Palm Oil Methyl Ester
- 8.1.4. Other Types
- 8.2. Market Analysis, Insights and Forecast - by Application
- 8.2.1. Fuel
- 8.2.2. Lubricants
- 8.2.3. Coatings
- 8.2.4. Food and Agriculture
- 8.2.5. Metalworking Fluids
- 8.2.6. Personal Care Products
- 8.2.7. Other Applications
- 8.1. Market Analysis, Insights and Forecast - by Type
- 9. Europe Fatty Acid Methyl Ester Industry Analysis, Insights and Forecast, 2021-2033
- 9.1. Market Analysis, Insights and Forecast - by Type
- 9.1.1. Rapeseed Methyl Ester
- 9.1.2. Soy Methyl Ester
- 9.1.3. Palm Oil Methyl Ester
- 9.1.4. Other Types
- 9.2. Market Analysis, Insights and Forecast - by Application
- 9.2.1. Fuel
- 9.2.2. Lubricants
- 9.2.3. Coatings
- 9.2.4. Food and Agriculture
- 9.2.5. Metalworking Fluids
- 9.2.6. Personal Care Products
- 9.2.7. Other Applications
- 9.1. Market Analysis, Insights and Forecast - by Type
- 10. South America Fatty Acid Methyl Ester Industry Analysis, Insights and Forecast, 2021-2033
- 10.1. Market Analysis, Insights and Forecast - by Type
- 10.1.1. Rapeseed Methyl Ester
- 10.1.2. Soy Methyl Ester
- 10.1.3. Palm Oil Methyl Ester
- 10.1.4. Other Types
- 10.2. Market Analysis, Insights and Forecast - by Application
- 10.2.1. Fuel
- 10.2.2. Lubricants
- 10.2.3. Coatings
- 10.2.4. Food and Agriculture
- 10.2.5. Metalworking Fluids
- 10.2.6. Personal Care Products
- 10.2.7. Other Applications
- 10.1. Market Analysis, Insights and Forecast - by Type
- 11. Middle East and Africa Fatty Acid Methyl Ester Industry Analysis, Insights and Forecast, 2021-2033
- 11.1. Market Analysis, Insights and Forecast - by Type
- 11.1.1. Rapeseed Methyl Ester
- 11.1.2. Soy Methyl Ester
- 11.1.3. Palm Oil Methyl Ester
- 11.1.4. Other Types
- 11.2. Market Analysis, Insights and Forecast - by Application
- 11.2.1. Fuel
- 11.2.2. Lubricants
- 11.2.3. Coatings
- 11.2.4. Food and Agriculture
- 11.2.5. Metalworking Fluids
- 11.2.6. Personal Care Products
- 11.2.7. Other Applications
- 11.1. Market Analysis, Insights and Forecast - by Type
- 12. Competitive Analysis
- 12.1. Company Profiles
- 12.1.1 Elevance Renewable Sciences Inc
- 12.1.1.1. Company Overview
- 12.1.1.2. Products
- 12.1.1.3. Company Financials
- 12.1.1.4. SWOT Analysis
- 12.1.2 Arkema
- 12.1.2.1. Company Overview
- 12.1.2.2. Products
- 12.1.2.3. Company Financials
- 12.1.2.4. SWOT Analysis
- 12.1.3 Cargill Incorporated
- 12.1.3.1. Company Overview
- 12.1.3.2. Products
- 12.1.3.3. Company Financials
- 12.1.3.4. SWOT Analysis
- 12.1.4 Merck KGaA
- 12.1.4.1. Company Overview
- 12.1.4.2. Products
- 12.1.4.3. Company Financials
- 12.1.4.4. SWOT Analysis
- 12.1.5 KLK OLEO
- 12.1.5.1. Company Overview
- 12.1.5.2. Products
- 12.1.5.3. Company Financials
- 12.1.5.4. SWOT Analysis
- 12.1.6 Wilmar International Ltd
- 12.1.6.1. Company Overview
- 12.1.6.2. Products
- 12.1.6.3. Company Financials
- 12.1.6.4. SWOT Analysis
- 12.1.7 TCI Chemicals (India) Pvt Ltd
- 12.1.7.1. Company Overview
- 12.1.7.2. Products
- 12.1.7.3. Company Financials
- 12.1.7.4. SWOT Analysis
- 12.1.8 BASF SE
- 12.1.8.1. Company Overview
- 12.1.8.2. Products
- 12.1.8.3. Company Financials
- 12.1.8.4. SWOT Analysis
- 12.1.9 Krishi Oils Limited
- 12.1.9.1. Company Overview
- 12.1.9.2. Products
- 12.1.9.3. Company Financials
- 12.1.9.4. SWOT Analysis
- 12.1.10 Larodan AB (ABITEC)
- 12.1.10.1. Company Overview
- 12.1.10.2. Products
- 12.1.10.3. Company Financials
- 12.1.10.4. SWOT Analysis
- 12.1.11 Univar Solutions Inc
- 12.1.11.1. Company Overview
- 12.1.11.2. Products
- 12.1.11.3. Company Financials
- 12.1.11.4. SWOT Analysis
- 12.1.12 Cayman Chemical
- 12.1.12.1. Company Overview
- 12.1.12.2. Products
- 12.1.12.3. Company Financials
- 12.1.12.4. SWOT Analysis
- 12.1.1 Elevance Renewable Sciences Inc
- 12.2. Market Entropy
- 12.2.1 Company's Key Areas Served
- 12.2.2 Recent Developments
- 12.3. Company Market Share Analysis 2025
- 12.3.1 Top 5 Companies Market Share Analysis
- 12.3.2 Top 3 Companies Market Share Analysis
- 12.4. List of Potential Customers
- 13. Research Methodology
List of Figures
- Figure 1: Global Fatty Acid Methyl Ester Industry Revenue Breakdown (billion, %) by Region 2025 & 2033
- Figure 2: Global Fatty Acid Methyl Ester Industry Volume Breakdown (K Tons, %) by Region 2025 & 2033
- Figure 3: Asia Pacific Fatty Acid Methyl Ester Industry Revenue (billion), by Type 2025 & 2033
- Figure 4: Asia Pacific Fatty Acid Methyl Ester Industry Volume (K Tons), by Type 2025 & 2033
- Figure 5: Asia Pacific Fatty Acid Methyl Ester Industry Revenue Share (%), by Type 2025 & 2033
- Figure 6: Asia Pacific Fatty Acid Methyl Ester Industry Volume Share (%), by Type 2025 & 2033
- Figure 7: Asia Pacific Fatty Acid Methyl Ester Industry Revenue (billion), by Application 2025 & 2033
- Figure 8: Asia Pacific Fatty Acid Methyl Ester Industry Volume (K Tons), by Application 2025 & 2033
- Figure 9: Asia Pacific Fatty Acid Methyl Ester Industry Revenue Share (%), by Application 2025 & 2033
- Figure 10: Asia Pacific Fatty Acid Methyl Ester Industry Volume Share (%), by Application 2025 & 2033
- Figure 11: Asia Pacific Fatty Acid Methyl Ester Industry Revenue (billion), by Country 2025 & 2033
- Figure 12: Asia Pacific Fatty Acid Methyl Ester Industry Volume (K Tons), by Country 2025 & 2033
- Figure 13: Asia Pacific Fatty Acid Methyl Ester Industry Revenue Share (%), by Country 2025 & 2033
- Figure 14: Asia Pacific Fatty Acid Methyl Ester Industry Volume Share (%), by Country 2025 & 2033
- Figure 15: North America Fatty Acid Methyl Ester Industry Revenue (billion), by Type 2025 & 2033
- Figure 16: North America Fatty Acid Methyl Ester Industry Volume (K Tons), by Type 2025 & 2033
- Figure 17: North America Fatty Acid Methyl Ester Industry Revenue Share (%), by Type 2025 & 2033
- Figure 18: North America Fatty Acid Methyl Ester Industry Volume Share (%), by Type 2025 & 2033
- Figure 19: North America Fatty Acid Methyl Ester Industry Revenue (billion), by Application 2025 & 2033
- Figure 20: North America Fatty Acid Methyl Ester Industry Volume (K Tons), by Application 2025 & 2033
- Figure 21: North America Fatty Acid Methyl Ester Industry Revenue Share (%), by Application 2025 & 2033
- Figure 22: North America Fatty Acid Methyl Ester Industry Volume Share (%), by Application 2025 & 2033
- Figure 23: North America Fatty Acid Methyl Ester Industry Revenue (billion), by Country 2025 & 2033
- Figure 24: North America Fatty Acid Methyl Ester Industry Volume (K Tons), by Country 2025 & 2033
- Figure 25: North America Fatty Acid Methyl Ester Industry Revenue Share (%), by Country 2025 & 2033
- Figure 26: North America Fatty Acid Methyl Ester Industry Volume Share (%), by Country 2025 & 2033
- Figure 27: Europe Fatty Acid Methyl Ester Industry Revenue (billion), by Type 2025 & 2033
- Figure 28: Europe Fatty Acid Methyl Ester Industry Volume (K Tons), by Type 2025 & 2033
- Figure 29: Europe Fatty Acid Methyl Ester Industry Revenue Share (%), by Type 2025 & 2033
- Figure 30: Europe Fatty Acid Methyl Ester Industry Volume Share (%), by Type 2025 & 2033
- Figure 31: Europe Fatty Acid Methyl Ester Industry Revenue (billion), by Application 2025 & 2033
- Figure 32: Europe Fatty Acid Methyl Ester Industry Volume (K Tons), by Application 2025 & 2033
- Figure 33: Europe Fatty Acid Methyl Ester Industry Revenue Share (%), by Application 2025 & 2033
- Figure 34: Europe Fatty Acid Methyl Ester Industry Volume Share (%), by Application 2025 & 2033
- Figure 35: Europe Fatty Acid Methyl Ester Industry Revenue (billion), by Country 2025 & 2033
- Figure 36: Europe Fatty Acid Methyl Ester Industry Volume (K Tons), by Country 2025 & 2033
- Figure 37: Europe Fatty Acid Methyl Ester Industry Revenue Share (%), by Country 2025 & 2033
- Figure 38: Europe Fatty Acid Methyl Ester Industry Volume Share (%), by Country 2025 & 2033
- Figure 39: South America Fatty Acid Methyl Ester Industry Revenue (billion), by Type 2025 & 2033
- Figure 40: South America Fatty Acid Methyl Ester Industry Volume (K Tons), by Type 2025 & 2033
- Figure 41: South America Fatty Acid Methyl Ester Industry Revenue Share (%), by Type 2025 & 2033
- Figure 42: South America Fatty Acid Methyl Ester Industry Volume Share (%), by Type 2025 & 2033
- Figure 43: South America Fatty Acid Methyl Ester Industry Revenue (billion), by Application 2025 & 2033
- Figure 44: South America Fatty Acid Methyl Ester Industry Volume (K Tons), by Application 2025 & 2033
- Figure 45: South America Fatty Acid Methyl Ester Industry Revenue Share (%), by Application 2025 & 2033
- Figure 46: South America Fatty Acid Methyl Ester Industry Volume Share (%), by Application 2025 & 2033
- Figure 47: South America Fatty Acid Methyl Ester Industry Revenue (billion), by Country 2025 & 2033
- Figure 48: South America Fatty Acid Methyl Ester Industry Volume (K Tons), by Country 2025 & 2033
- Figure 49: South America Fatty Acid Methyl Ester Industry Revenue Share (%), by Country 2025 & 2033
- Figure 50: South America Fatty Acid Methyl Ester Industry Volume Share (%), by Country 2025 & 2033
- Figure 51: Middle East and Africa Fatty Acid Methyl Ester Industry Revenue (billion), by Type 2025 & 2033
- Figure 52: Middle East and Africa Fatty Acid Methyl Ester Industry Volume (K Tons), by Type 2025 & 2033
- Figure 53: Middle East and Africa Fatty Acid Methyl Ester Industry Revenue Share (%), by Type 2025 & 2033
- Figure 54: Middle East and Africa Fatty Acid Methyl Ester Industry Volume Share (%), by Type 2025 & 2033
- Figure 55: Middle East and Africa Fatty Acid Methyl Ester Industry Revenue (billion), by Application 2025 & 2033
- Figure 56: Middle East and Africa Fatty Acid Methyl Ester Industry Volume (K Tons), by Application 2025 & 2033
- Figure 57: Middle East and Africa Fatty Acid Methyl Ester Industry Revenue Share (%), by Application 2025 & 2033
- Figure 58: Middle East and Africa Fatty Acid Methyl Ester Industry Volume Share (%), by Application 2025 & 2033
- Figure 59: Middle East and Africa Fatty Acid Methyl Ester Industry Revenue (billion), by Country 2025 & 2033
- Figure 60: Middle East and Africa Fatty Acid Methyl Ester Industry Volume (K Tons), by Country 2025 & 2033
- Figure 61: Middle East and Africa Fatty Acid Methyl Ester Industry Revenue Share (%), by Country 2025 & 2033
- Figure 62: Middle East and Africa Fatty Acid Methyl Ester Industry Volume Share (%), by Country 2025 & 2033
List of Tables
- Table 1: Global Fatty Acid Methyl Ester Industry Revenue billion Forecast, by Type 2020 & 2033
- Table 2: Global Fatty Acid Methyl Ester Industry Volume K Tons Forecast, by Type 2020 & 2033
- Table 3: Global Fatty Acid Methyl Ester Industry Revenue billion Forecast, by Application 2020 & 2033
- Table 4: Global Fatty Acid Methyl Ester Industry Volume K Tons Forecast, by Application 2020 & 2033
- Table 5: Global Fatty Acid Methyl Ester Industry Revenue billion Forecast, by Region 2020 & 2033
- Table 6: Global Fatty Acid Methyl Ester Industry Volume K Tons Forecast, by Region 2020 & 2033
- Table 7: Global Fatty Acid Methyl Ester Industry Revenue billion Forecast, by Type 2020 & 2033
- Table 8: Global Fatty Acid Methyl Ester Industry Volume K Tons Forecast, by Type 2020 & 2033
- Table 9: Global Fatty Acid Methyl Ester Industry Revenue billion Forecast, by Application 2020 & 2033
- Table 10: Global Fatty Acid Methyl Ester Industry Volume K Tons Forecast, by Application 2020 & 2033
- Table 11: Global Fatty Acid Methyl Ester Industry Revenue billion Forecast, by Country 2020 & 2033
- Table 12: Global Fatty Acid Methyl Ester Industry Volume K Tons Forecast, by Country 2020 & 2033
- Table 13: China Fatty Acid Methyl Ester Industry Revenue (billion) Forecast, by Application 2020 & 2033
- Table 14: China Fatty Acid Methyl Ester Industry Volume (K Tons) Forecast, by Application 2020 & 2033
- Table 15: India Fatty Acid Methyl Ester Industry Revenue (billion) Forecast, by Application 2020 & 2033
- Table 16: India Fatty Acid Methyl Ester Industry Volume (K Tons) Forecast, by Application 2020 & 2033
- Table 17: Japan Fatty Acid Methyl Ester Industry Revenue (billion) Forecast, by Application 2020 & 2033
- Table 18: Japan Fatty Acid Methyl Ester Industry Volume (K Tons) Forecast, by Application 2020 & 2033
- Table 19: South Korea Fatty Acid Methyl Ester Industry Revenue (billion) Forecast, by Application 2020 & 2033
- Table 20: South Korea Fatty Acid Methyl Ester Industry Volume (K Tons) Forecast, by Application 2020 & 2033
- Table 21: Rest of Asia Pacific Fatty Acid Methyl Ester Industry Revenue (billion) Forecast, by Application 2020 & 2033
- Table 22: Rest of Asia Pacific Fatty Acid Methyl Ester Industry Volume (K Tons) Forecast, by Application 2020 & 2033
- Table 23: Global Fatty Acid Methyl Ester Industry Revenue billion Forecast, by Type 2020 & 2033
- Table 24: Global Fatty Acid Methyl Ester Industry Volume K Tons Forecast, by Type 2020 & 2033
- Table 25: Global Fatty Acid Methyl Ester Industry Revenue billion Forecast, by Application 2020 & 2033
- Table 26: Global Fatty Acid Methyl Ester Industry Volume K Tons Forecast, by Application 2020 & 2033
- Table 27: Global Fatty Acid Methyl Ester Industry Revenue billion Forecast, by Country 2020 & 2033
- Table 28: Global Fatty Acid Methyl Ester Industry Volume K Tons Forecast, by Country 2020 & 2033
- Table 29: United States Fatty Acid Methyl Ester Industry Revenue (billion) Forecast, by Application 2020 & 2033
- Table 30: United States Fatty Acid Methyl Ester Industry Volume (K Tons) Forecast, by Application 2020 & 2033
- Table 31: Canada Fatty Acid Methyl Ester Industry Revenue (billion) Forecast, by Application 2020 & 2033
- Table 32: Canada Fatty Acid Methyl Ester Industry Volume (K Tons) Forecast, by Application 2020 & 2033
- Table 33: Mexico Fatty Acid Methyl Ester Industry Revenue (billion) Forecast, by Application 2020 & 2033
- Table 34: Mexico Fatty Acid Methyl Ester Industry Volume (K Tons) Forecast, by Application 2020 & 2033
- Table 35: Global Fatty Acid Methyl Ester Industry Revenue billion Forecast, by Type 2020 & 2033
- Table 36: Global Fatty Acid Methyl Ester Industry Volume K Tons Forecast, by Type 2020 & 2033
- Table 37: Global Fatty Acid Methyl Ester Industry Revenue billion Forecast, by Application 2020 & 2033
- Table 38: Global Fatty Acid Methyl Ester Industry Volume K Tons Forecast, by Application 2020 & 2033
- Table 39: Global Fatty Acid Methyl Ester Industry Revenue billion Forecast, by Country 2020 & 2033
- Table 40: Global Fatty Acid Methyl Ester Industry Volume K Tons Forecast, by Country 2020 & 2033
- Table 41: Germany Fatty Acid Methyl Ester Industry Revenue (billion) Forecast, by Application 2020 & 2033
- Table 42: Germany Fatty Acid Methyl Ester Industry Volume (K Tons) Forecast, by Application 2020 & 2033
- Table 43: United Kingdom Fatty Acid Methyl Ester Industry Revenue (billion) Forecast, by Application 2020 & 2033
- Table 44: United Kingdom Fatty Acid Methyl Ester Industry Volume (K Tons) Forecast, by Application 2020 & 2033
- Table 45: France Fatty Acid Methyl Ester Industry Revenue (billion) Forecast, by Application 2020 & 2033
- Table 46: France Fatty Acid Methyl Ester Industry Volume (K Tons) Forecast, by Application 2020 & 2033
- Table 47: Italy Fatty Acid Methyl Ester Industry Revenue (billion) Forecast, by Application 2020 & 2033
- Table 48: Italy Fatty Acid Methyl Ester Industry Volume (K Tons) Forecast, by Application 2020 & 2033
- Table 49: Rest of Europe Fatty Acid Methyl Ester Industry Revenue (billion) Forecast, by Application 2020 & 2033
- Table 50: Rest of Europe Fatty Acid Methyl Ester Industry Volume (K Tons) Forecast, by Application 2020 & 2033
- Table 51: Global Fatty Acid Methyl Ester Industry Revenue billion Forecast, by Type 2020 & 2033
- Table 52: Global Fatty Acid Methyl Ester Industry Volume K Tons Forecast, by Type 2020 & 2033
- Table 53: Global Fatty Acid Methyl Ester Industry Revenue billion Forecast, by Application 2020 & 2033
- Table 54: Global Fatty Acid Methyl Ester Industry Volume K Tons Forecast, by Application 2020 & 2033
- Table 55: Global Fatty Acid Methyl Ester Industry Revenue billion Forecast, by Country 2020 & 2033
- Table 56: Global Fatty Acid Methyl Ester Industry Volume K Tons Forecast, by Country 2020 & 2033
- Table 57: Brazil Fatty Acid Methyl Ester Industry Revenue (billion) Forecast, by Application 2020 & 2033
- Table 58: Brazil Fatty Acid Methyl Ester Industry Volume (K Tons) Forecast, by Application 2020 & 2033
- Table 59: Argentina Fatty Acid Methyl Ester Industry Revenue (billion) Forecast, by Application 2020 & 2033
- Table 60: Argentina Fatty Acid Methyl Ester Industry Volume (K Tons) Forecast, by Application 2020 & 2033
- Table 61: Rest of South America Fatty Acid Methyl Ester Industry Revenue (billion) Forecast, by Application 2020 & 2033
- Table 62: Rest of South America Fatty Acid Methyl Ester Industry Volume (K Tons) Forecast, by Application 2020 & 2033
- Table 63: Global Fatty Acid Methyl Ester Industry Revenue billion Forecast, by Type 2020 & 2033
- Table 64: Global Fatty Acid Methyl Ester Industry Volume K Tons Forecast, by Type 2020 & 2033
- Table 65: Global Fatty Acid Methyl Ester Industry Revenue billion Forecast, by Application 2020 & 2033
- Table 66: Global Fatty Acid Methyl Ester Industry Volume K Tons Forecast, by Application 2020 & 2033
- Table 67: Global Fatty Acid Methyl Ester Industry Revenue billion Forecast, by Country 2020 & 2033
- Table 68: Global Fatty Acid Methyl Ester Industry Volume K Tons Forecast, by Country 2020 & 2033
- Table 69: Saudi Arabia Fatty Acid Methyl Ester Industry Revenue (billion) Forecast, by Application 2020 & 2033
- Table 70: Saudi Arabia Fatty Acid Methyl Ester Industry Volume (K Tons) Forecast, by Application 2020 & 2033
- Table 71: South Africa Fatty Acid Methyl Ester Industry Revenue (billion) Forecast, by Application 2020 & 2033
- Table 72: South Africa Fatty Acid Methyl Ester Industry Volume (K Tons) Forecast, by Application 2020 & 2033
- Table 73: Rest of Middle East and Africa Fatty Acid Methyl Ester Industry Revenue (billion) Forecast, by Application 2020 & 2033
- Table 74: Rest of Middle East and Africa Fatty Acid Methyl Ester Industry Volume (K Tons) Forecast, by Application 2020 & 2033
Frequently Asked Questions
1. What is the projected Compound Annual Growth Rate (CAGR) of the Fatty Acid Methyl Ester Industry?
The projected CAGR is approximately 5.6%.
2. Which companies are prominent players in the Fatty Acid Methyl Ester Industry?
Key companies in the market include Elevance Renewable Sciences Inc, Arkema, Cargill Incorporated, Merck KGaA, KLK OLEO, Wilmar International Ltd, TCI Chemicals (India) Pvt Ltd, BASF SE, Krishi Oils Limited, Larodan AB (ABITEC), Univar Solutions Inc, Cayman Chemical.
3. What are the main segments of the Fatty Acid Methyl Ester Industry?
The market segments include Type, Application.
4. Can you provide details about the market size?
The market size is estimated to be USD 23.2 billion as of 2022.
5. What are some drivers contributing to market growth?
Growing Production of Biodiesel; Other Drivers.
6. What are the notable trends driving market growth?
The Fuel Sector is Expected to Dominate the Market.
7. Are there any restraints impacting market growth?
High Manufacturing Cost Due to Volatile Raw Material Price; Other Restraints.
8. Can you provide examples of recent developments in the market?
Recent developments will be provided in the complete report.
9. What pricing options are available for accessing the report?
Pricing options include single-user, multi-user, and enterprise licenses priced at USD 4750, USD 5250, and USD 8750 respectively.
10. Is the market size provided in terms of value or volume?
The market size is provided in terms of value, measured in billion and volume, measured in K Tons.
11. Are there any specific market keywords associated with the report?
Yes, the market keyword associated with the report is "Fatty Acid Methyl Ester Industry," which aids in identifying and referencing the specific market segment covered.
12. How do I determine which pricing option suits my needs best?
The pricing options vary based on user requirements and access needs. Individual users may opt for single-user licenses, while businesses requiring broader access may choose multi-user or enterprise licenses for cost-effective access to the report.
13. Are there any additional resources or data provided in the Fatty Acid Methyl Ester Industry report?
While the report offers comprehensive insights, it's advisable to review the specific contents or supplementary materials provided to ascertain if additional resources or data are available.
14. How can I stay updated on further developments or reports in the Fatty Acid Methyl Ester Industry?
To stay informed about further developments, trends, and reports in the Fatty Acid Methyl Ester Industry, consider subscribing to industry newsletters, following relevant companies and organizations, or regularly checking reputable industry news sources and publications.
Methodology
Step 1 - Identification of Relevant Samples Size from Population Database


Step 2 - Approaches for Defining Global Market Size (Value, Volume* & Price*)

Note*: In applicable scenarios
Step 3 - Data Sources
Primary Research
- Web Analytics
- Survey Reports
- Research Institute
- Latest Research Reports
- Opinion Leaders
Secondary Research
- Annual Reports
- White Paper
- Latest Press Release
- Industry Association
- Paid Database
- Investor Presentations

Step 4 - Data Triangulation
Involves using different sources of information in order to increase the validity of a study
These sources are likely to be stakeholders in a program - participants, other researchers, program staff, other community members, and so on.
Then we put all data in single framework & apply various statistical tools to find out the dynamic on the market.
During the analysis stage, feedback from the stakeholder groups would be compared to determine areas of agreement as well as areas of divergence