
Key Insights
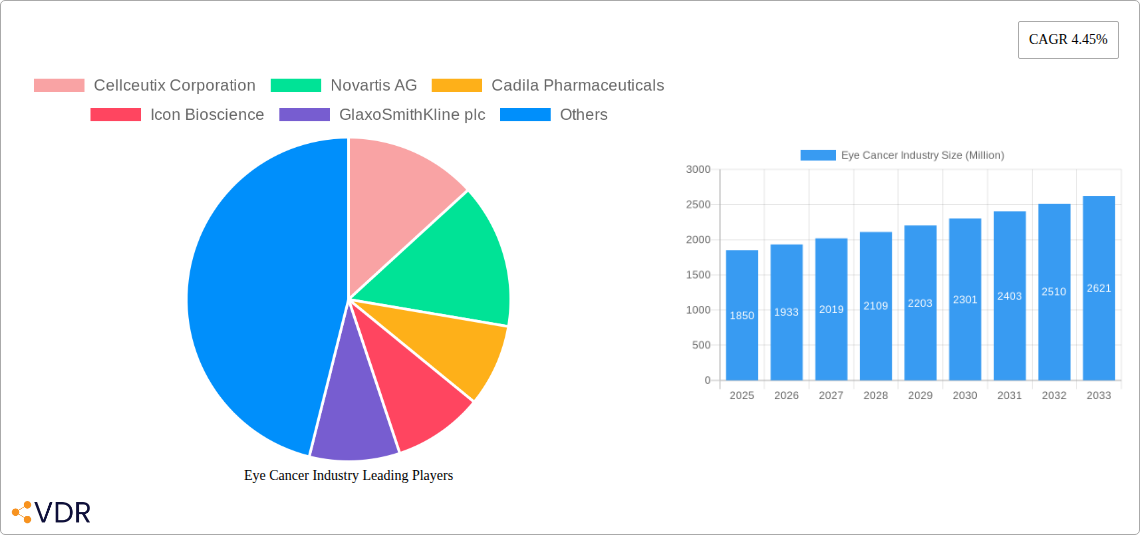
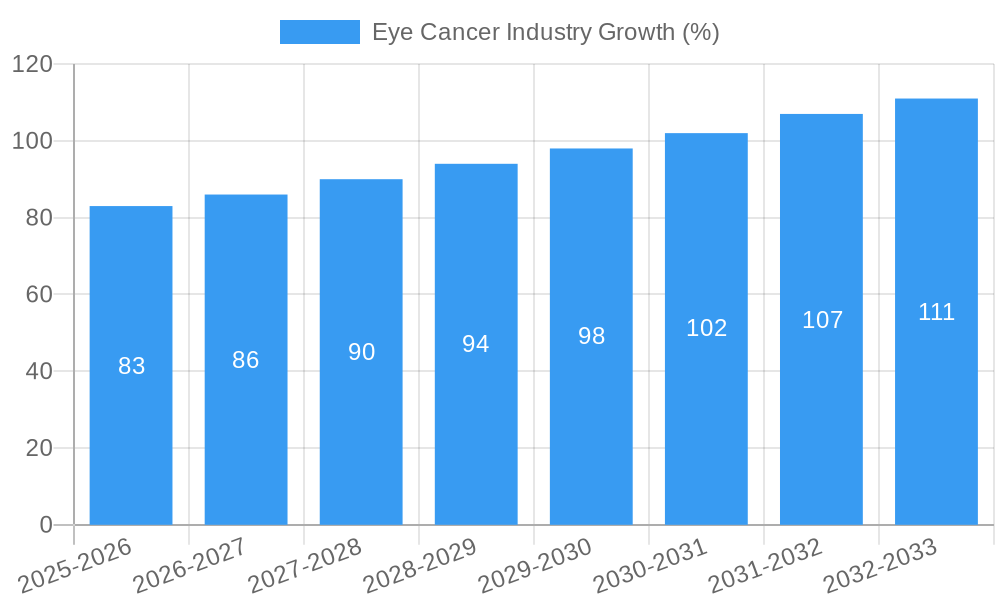
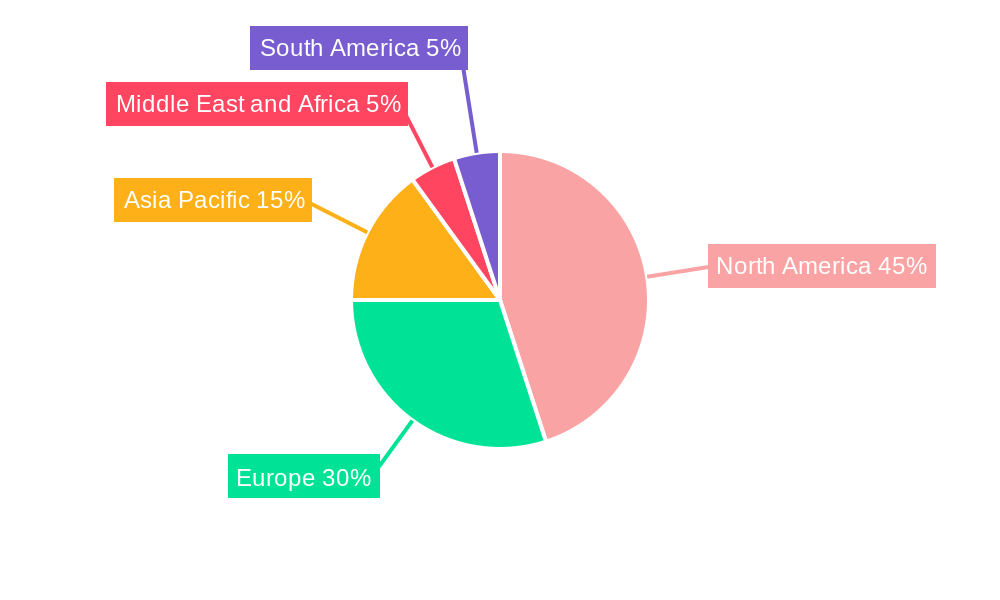
The global eye cancer market, currently valued at $1.85 billion (2025), is projected to experience steady growth, exhibiting a compound annual growth rate (CAGR) of 4.45% from 2025 to 2033. This expansion is driven by several factors. Increasing prevalence of retinoblastoma, particularly in developing nations with limited access to early diagnosis and treatment, contributes significantly to market growth. Advancements in diagnostic technologies, such as improved imaging techniques and genetic testing, enable earlier and more accurate detection, leading to improved treatment outcomes and fueling market demand. Furthermore, the development of novel targeted therapies and immunotherapies offers hope for improved survival rates and quality of life for patients, further stimulating market growth. The market is segmented by retinoblastoma type (intraocular, extraocular), treatment modality (surgery, radiation, chemotherapy, etc.), and hereditary status. While surgical interventions remain prevalent, the increasing adoption of less invasive procedures like laser therapy and cryotherapy reflects ongoing technological advancements. The North American market currently holds a substantial share, owing to advanced healthcare infrastructure and higher healthcare expenditure. However, the Asia-Pacific region is poised for significant growth, driven by rising awareness, increasing disposable incomes, and expanding healthcare infrastructure. Competition within the market is intense, with major pharmaceutical and biotechnology companies like Novartis, Johnson & Johnson, and Pfizer playing key roles in research, development, and commercialization of eye cancer treatments. Despite the positive growth outlook, challenges remain, including high treatment costs, potential side effects of certain therapies, and geographical disparities in access to care.
The continued research and development efforts focused on personalized medicine, targeted therapies, and improved diagnostic tools are expected to significantly shape the future of the eye cancer treatment landscape. The focus on early detection and preventative measures, along with improved access to care, particularly in underserved regions, will further influence market trajectory. The competitive landscape is likely to remain dynamic, with continued innovation and strategic partnerships driving market evolution. The next decade will witness a shift towards more effective and less invasive treatment options, contributing to improved patient outcomes and sustained market expansion. Understanding the intricate interplay of these factors is crucial for effective strategic planning within the eye cancer treatment market.
Eye Cancer Industry Market Report: 2019-2033
This comprehensive report provides a detailed analysis of the Eye Cancer industry, encompassing market dynamics, growth trends, regional analysis, product landscape, key players, and future outlook. With a focus on retinoblastoma (a primary eye cancer in children), the report segments the market by type of staging, treatment type, and hereditary status, offering invaluable insights for industry professionals, investors, and researchers. The study period covers 2019-2033, with 2025 as the base and estimated year.
Eye Cancer Industry Market Dynamics & Structure
The global eye cancer market, valued at xx million in 2025, is characterized by a moderately concentrated landscape with several major pharmaceutical companies dominating. Technological innovation, particularly in targeted therapies and early detection methods, is a key driver. Stringent regulatory frameworks govern drug approvals and clinical trials, influencing market entry and product development. The market faces competition from alternative treatments, including surgery and radiation therapy, which influences market share. End-user demographics, primarily children for retinoblastoma and adults for other eye cancers, significantly influence market demand. M&A activity is moderate, with a xx number of deals recorded in the last five years, often driven by the desire to expand product portfolios and gain access to new technologies.
- Market Concentration: Moderately concentrated, with top 5 players holding approximately xx% market share in 2025.
- Technological Innovation: Focus on targeted therapies, advanced imaging techniques, and personalized medicine.
- Regulatory Framework: Stringent approvals processes impacting time-to-market for new therapies.
- Competitive Substitutes: Surgical procedures and radiation therapy remain significant competitors.
- End-User Demographics: Predominantly children (retinoblastoma) and adults (other eye cancers).
- M&A Activity: Moderate activity, primarily driven by portfolio expansion and technology acquisition. xx deals recorded between 2020-2025.
Eye Cancer Industry Growth Trends & Insights
The eye cancer market exhibits robust growth, driven by increasing prevalence, advancements in diagnostics and treatment, and rising healthcare expenditure. The market size is projected to reach xx million by 2033, exhibiting a CAGR of xx% during the forecast period (2025-2033). Increased awareness about early detection is boosting diagnosis rates, fueling market growth. Technological disruptions, such as the development of novel targeted therapies and improved imaging technologies, are significantly impacting treatment approaches and market expansion. Consumer behavior is shifting towards a preference for less invasive and more effective treatments. Market penetration of advanced therapies is gradually increasing, further driving market growth. The historical period (2019-2024) witnessed a CAGR of xx%.
Dominant Regions, Countries, or Segments in Eye Cancer Industry
North America currently holds the largest market share in the eye cancer market, followed by Europe. This dominance is primarily attributed to higher healthcare expenditure, advanced healthcare infrastructure, and a relatively high prevalence of eye cancer. Within retinoblastoma, intraocular retinoblastoma represents the larger segment due to its higher incidence. In terms of treatment, surgery remains a prevalent method, although chemotherapy and targeted therapies are gaining traction. Hereditary retinoblastoma contributes significantly to the overall market due to its recurring nature within families.
- Key Drivers: High healthcare expenditure in North America and Europe, advanced healthcare infrastructure, high prevalence in developed nations, and the availability of sophisticated treatment options.
- Dominant Segments: Intraocular retinoblastoma (by staging), surgery (by treatment type), and hereditary retinoblastoma (by type).
- Growth Potential: Significant growth potential exists in emerging markets driven by increasing awareness, improving healthcare infrastructure, and the introduction of affordable treatment options.
Eye Cancer Industry Product Landscape
The eye cancer product landscape is diverse, encompassing various pharmaceutical drugs, including targeted therapies, chemotherapeutic agents, and supportive care medications. Technological advancements focus on improving drug efficacy, reducing side effects, and developing personalized treatment approaches. Unique selling propositions center around improved treatment outcomes, reduced toxicity profiles, and enhanced patient compliance. Recent innovations include the development of novel targeted therapies and improved diagnostic tools.
Key Drivers, Barriers & Challenges in Eye Cancer Industry
Key Drivers: The increasing prevalence of eye cancers, particularly retinoblastoma in children, coupled with technological advancements in diagnostic and therapeutic tools, drives significant market growth. Rising healthcare expenditure and growing awareness about early detection and treatment further fuel market expansion.
Key Challenges: High cost of treatment, particularly for advanced therapies, and limited access to specialized healthcare facilities in developing nations remain major obstacles. Stringent regulatory approvals for new drugs and the potential for treatment resistance pose challenges to market expansion. Supply chain disruptions can also impact the availability of essential medications and equipment. The cost of new therapies, estimated to be in the range of xx million USD annually, represents a major barrier to access.
Emerging Opportunities in Eye Cancer Industry
Emerging opportunities lie in the development of novel targeted therapies with enhanced efficacy and reduced toxicity. Expansion into untapped markets in developing nations holds significant potential. The growing use of telemedicine and digital health technologies for remote patient monitoring and management presents a new avenue for growth. Further research into the genetic basis of eye cancers and personalized medicine approaches could revolutionize treatment strategies.
Growth Accelerators in the Eye Cancer Industry
Technological breakthroughs in targeted therapies, improved diagnostic tools, and personalized medicine approaches are key catalysts for long-term growth. Strategic partnerships between pharmaceutical companies, research institutions, and healthcare providers can accelerate innovation and market access. Expansion into emerging markets and improved patient access to advanced treatment options will further stimulate market expansion.
Key Players Shaping the Eye Cancer Industry Market
- Cellceutix Corporation
- Novartis AG
- Cadila Pharmaceuticals
- Icon Bioscience
- GlaxoSmithKline plc
- Teva Pharmaceutical Industries Ltd
- Johnson & Johnson
- RXi Pharmaceuticals
- Merck & Co
- Baxter International Inc
- Bristol-Myers Squibb Company
- Pfizer Inc
Notable Milestones in Eye Cancer Industry Sector
- May 2022: The UK's National Health Service launched a new test to detect retinoblastoma in unborn babies.
- September 2022: Researchers discovered the ESRRG molecule's role in retinoblastoma tumor cell survival, opening avenues for targeted therapies.
In-Depth Eye Cancer Industry Market Outlook
The eye cancer market is poised for significant growth, driven by ongoing research and development, advancements in treatment modalities, and increased awareness. Strategic partnerships and collaborations are expected to accelerate innovation and market expansion. The development and adoption of personalized medicine approaches will significantly shape the future of eye cancer treatment, offering improved outcomes and tailored therapies for specific patient populations. The market’s future potential is substantial, with opportunities for new drug development, diagnostic advancements, and improved access to care, especially in underserved regions.
Eye Cancer Industry Segmentation
-
1. Treatment Type
- 1.1. Surgery
- 1.2. Radiation therapy
- 1.3. Laser Therapy
- 1.4. Cryotherapy
- 1.5. Chemotherapy
- 1.6. Bone Marrow Transplantation/Stem Cell Transplant
-
2. Type of Retinoblastoma
- 2.1. Non-hereditary Retinoblastoma
- 2.2. Hereditary Retinoblastoma
-
3. Type of Staging
- 3.1. Intraocular Retinoblastoma
- 3.2. Extraocular Retinoblastoma
Eye Cancer Industry Segmentation By Geography
-
1. North America
- 1.1. United States
- 1.2. Canada
- 1.3. Mexico
-
2. Europe
- 2.1. Germany
- 2.2. United Kingdom
- 2.3. France
- 2.4. Italy
- 2.5. Spain
- 2.6. Rest of Europe
-
3. Asia Pacific
- 3.1. China
- 3.2. Japan
- 3.3. India
- 3.4. Australia
- 3.5. South Korea
- 3.6. Rest of Asia Pacific
-
4. Middle East and Africa
- 4.1. GCC
- 4.2. South Africa
- 4.3. Rest of Middle East and Africa
-
5. South America
- 5.1. Brazil
- 5.2. Argentina
- 5.3. Rest of South America
Eye Cancer Industry REPORT HIGHLIGHTS
| Aspects | Details |
|---|---|
| Study Period | 2019-2033 |
| Base Year | 2024 |
| Estimated Year | 2025 |
| Forecast Period | 2025-2033 |
| Historical Period | 2019-2024 |
| Growth Rate | CAGR of 4.45% from 2019-2033 |
| Segmentation |
|
Table of Contents
- 1. Introduction
- 1.1. Research Scope
- 1.2. Market Segmentation
- 1.3. Research Methodology
- 1.4. Definitions and Assumptions
- 2. Executive Summary
- 2.1. Introduction
- 3. Market Dynamics
- 3.1. Introduction
- 3.2. Market Drivers
- 3.2.1. Remission and the Chance of Recurrence of Retinoblastoma; Increasing Public Awareness on Retinoblastoma
- 3.3. Market Restrains
- 3.3.1. Side Effects of Retinoblastoma Surgery and High Cost of Treatment in Developing Countries
- 3.4. Market Trends
- 3.4.1. Non-hereditary Retinoblastoma is Expected to hold a Significant Market Share Over the Forecast Period
- 4. Market Factor Analysis
- 4.1. Porters Five Forces
- 4.2. Supply/Value Chain
- 4.3. PESTEL analysis
- 4.4. Market Entropy
- 4.5. Patent/Trademark Analysis
- 5. Global Eye Cancer Industry Analysis, Insights and Forecast, 2019-2031
- 5.1. Market Analysis, Insights and Forecast - by Treatment Type
- 5.1.1. Surgery
- 5.1.2. Radiation therapy
- 5.1.3. Laser Therapy
- 5.1.4. Cryotherapy
- 5.1.5. Chemotherapy
- 5.1.6. Bone Marrow Transplantation/Stem Cell Transplant
- 5.2. Market Analysis, Insights and Forecast - by Type of Retinoblastoma
- 5.2.1. Non-hereditary Retinoblastoma
- 5.2.2. Hereditary Retinoblastoma
- 5.3. Market Analysis, Insights and Forecast - by Type of Staging
- 5.3.1. Intraocular Retinoblastoma
- 5.3.2. Extraocular Retinoblastoma
- 5.4. Market Analysis, Insights and Forecast - by Region
- 5.4.1. North America
- 5.4.2. Europe
- 5.4.3. Asia Pacific
- 5.4.4. Middle East and Africa
- 5.4.5. South America
- 5.1. Market Analysis, Insights and Forecast - by Treatment Type
- 6. North America Eye Cancer Industry Analysis, Insights and Forecast, 2019-2031
- 6.1. Market Analysis, Insights and Forecast - by Treatment Type
- 6.1.1. Surgery
- 6.1.2. Radiation therapy
- 6.1.3. Laser Therapy
- 6.1.4. Cryotherapy
- 6.1.5. Chemotherapy
- 6.1.6. Bone Marrow Transplantation/Stem Cell Transplant
- 6.2. Market Analysis, Insights and Forecast - by Type of Retinoblastoma
- 6.2.1. Non-hereditary Retinoblastoma
- 6.2.2. Hereditary Retinoblastoma
- 6.3. Market Analysis, Insights and Forecast - by Type of Staging
- 6.3.1. Intraocular Retinoblastoma
- 6.3.2. Extraocular Retinoblastoma
- 6.1. Market Analysis, Insights and Forecast - by Treatment Type
- 7. Europe Eye Cancer Industry Analysis, Insights and Forecast, 2019-2031
- 7.1. Market Analysis, Insights and Forecast - by Treatment Type
- 7.1.1. Surgery
- 7.1.2. Radiation therapy
- 7.1.3. Laser Therapy
- 7.1.4. Cryotherapy
- 7.1.5. Chemotherapy
- 7.1.6. Bone Marrow Transplantation/Stem Cell Transplant
- 7.2. Market Analysis, Insights and Forecast - by Type of Retinoblastoma
- 7.2.1. Non-hereditary Retinoblastoma
- 7.2.2. Hereditary Retinoblastoma
- 7.3. Market Analysis, Insights and Forecast - by Type of Staging
- 7.3.1. Intraocular Retinoblastoma
- 7.3.2. Extraocular Retinoblastoma
- 7.1. Market Analysis, Insights and Forecast - by Treatment Type
- 8. Asia Pacific Eye Cancer Industry Analysis, Insights and Forecast, 2019-2031
- 8.1. Market Analysis, Insights and Forecast - by Treatment Type
- 8.1.1. Surgery
- 8.1.2. Radiation therapy
- 8.1.3. Laser Therapy
- 8.1.4. Cryotherapy
- 8.1.5. Chemotherapy
- 8.1.6. Bone Marrow Transplantation/Stem Cell Transplant
- 8.2. Market Analysis, Insights and Forecast - by Type of Retinoblastoma
- 8.2.1. Non-hereditary Retinoblastoma
- 8.2.2. Hereditary Retinoblastoma
- 8.3. Market Analysis, Insights and Forecast - by Type of Staging
- 8.3.1. Intraocular Retinoblastoma
- 8.3.2. Extraocular Retinoblastoma
- 8.1. Market Analysis, Insights and Forecast - by Treatment Type
- 9. Middle East and Africa Eye Cancer Industry Analysis, Insights and Forecast, 2019-2031
- 9.1. Market Analysis, Insights and Forecast - by Treatment Type
- 9.1.1. Surgery
- 9.1.2. Radiation therapy
- 9.1.3. Laser Therapy
- 9.1.4. Cryotherapy
- 9.1.5. Chemotherapy
- 9.1.6. Bone Marrow Transplantation/Stem Cell Transplant
- 9.2. Market Analysis, Insights and Forecast - by Type of Retinoblastoma
- 9.2.1. Non-hereditary Retinoblastoma
- 9.2.2. Hereditary Retinoblastoma
- 9.3. Market Analysis, Insights and Forecast - by Type of Staging
- 9.3.1. Intraocular Retinoblastoma
- 9.3.2. Extraocular Retinoblastoma
- 9.1. Market Analysis, Insights and Forecast - by Treatment Type
- 10. South America Eye Cancer Industry Analysis, Insights and Forecast, 2019-2031
- 10.1. Market Analysis, Insights and Forecast - by Treatment Type
- 10.1.1. Surgery
- 10.1.2. Radiation therapy
- 10.1.3. Laser Therapy
- 10.1.4. Cryotherapy
- 10.1.5. Chemotherapy
- 10.1.6. Bone Marrow Transplantation/Stem Cell Transplant
- 10.2. Market Analysis, Insights and Forecast - by Type of Retinoblastoma
- 10.2.1. Non-hereditary Retinoblastoma
- 10.2.2. Hereditary Retinoblastoma
- 10.3. Market Analysis, Insights and Forecast - by Type of Staging
- 10.3.1. Intraocular Retinoblastoma
- 10.3.2. Extraocular Retinoblastoma
- 10.1. Market Analysis, Insights and Forecast - by Treatment Type
- 11. North America Eye Cancer Industry Analysis, Insights and Forecast, 2019-2031
- 11.1. Market Analysis, Insights and Forecast - By Country/Sub-region
- 11.1.1 United States
- 11.1.2 Canada
- 11.1.3 Mexico
- 12. Europe Eye Cancer Industry Analysis, Insights and Forecast, 2019-2031
- 12.1. Market Analysis, Insights and Forecast - By Country/Sub-region
- 12.1.1 Germany
- 12.1.2 United Kingdom
- 12.1.3 France
- 12.1.4 Italy
- 12.1.5 Spain
- 12.1.6 Rest of Europe
- 13. Asia Pacific Eye Cancer Industry Analysis, Insights and Forecast, 2019-2031
- 13.1. Market Analysis, Insights and Forecast - By Country/Sub-region
- 13.1.1 China
- 13.1.2 Japan
- 13.1.3 India
- 13.1.4 Australia
- 13.1.5 South Korea
- 13.1.6 Rest of Asia Pacific
- 14. Middle East and Africa Eye Cancer Industry Analysis, Insights and Forecast, 2019-2031
- 14.1. Market Analysis, Insights and Forecast - By Country/Sub-region
- 14.1.1 GCC
- 14.1.2 South Africa
- 14.1.3 Rest of Middle East and Africa
- 15. South America Eye Cancer Industry Analysis, Insights and Forecast, 2019-2031
- 15.1. Market Analysis, Insights and Forecast - By Country/Sub-region
- 15.1.1 Brazil
- 15.1.2 Argentina
- 15.1.3 Rest of South America
- 16. Competitive Analysis
- 16.1. Global Market Share Analysis 2024
- 16.2. Company Profiles
- 16.2.1 Cellceutix Corporation
- 16.2.1.1. Overview
- 16.2.1.2. Products
- 16.2.1.3. SWOT Analysis
- 16.2.1.4. Recent Developments
- 16.2.1.5. Financials (Based on Availability)
- 16.2.2 Novartis AG
- 16.2.2.1. Overview
- 16.2.2.2. Products
- 16.2.2.3. SWOT Analysis
- 16.2.2.4. Recent Developments
- 16.2.2.5. Financials (Based on Availability)
- 16.2.3 Cadila Pharmaceuticals
- 16.2.3.1. Overview
- 16.2.3.2. Products
- 16.2.3.3. SWOT Analysis
- 16.2.3.4. Recent Developments
- 16.2.3.5. Financials (Based on Availability)
- 16.2.4 Icon Bioscience
- 16.2.4.1. Overview
- 16.2.4.2. Products
- 16.2.4.3. SWOT Analysis
- 16.2.4.4. Recent Developments
- 16.2.4.5. Financials (Based on Availability)
- 16.2.5 GlaxoSmithKline plc
- 16.2.5.1. Overview
- 16.2.5.2. Products
- 16.2.5.3. SWOT Analysis
- 16.2.5.4. Recent Developments
- 16.2.5.5. Financials (Based on Availability)
- 16.2.6 Teva Pharmaceutical Industries Ltd
- 16.2.6.1. Overview
- 16.2.6.2. Products
- 16.2.6.3. SWOT Analysis
- 16.2.6.4. Recent Developments
- 16.2.6.5. Financials (Based on Availability)
- 16.2.7 Johnson & Johnson
- 16.2.7.1. Overview
- 16.2.7.2. Products
- 16.2.7.3. SWOT Analysis
- 16.2.7.4. Recent Developments
- 16.2.7.5. Financials (Based on Availability)
- 16.2.8 RXi Pharmaceuticals*List Not Exhaustive
- 16.2.8.1. Overview
- 16.2.8.2. Products
- 16.2.8.3. SWOT Analysis
- 16.2.8.4. Recent Developments
- 16.2.8.5. Financials (Based on Availability)
- 16.2.9 Merck & Co
- 16.2.9.1. Overview
- 16.2.9.2. Products
- 16.2.9.3. SWOT Analysis
- 16.2.9.4. Recent Developments
- 16.2.9.5. Financials (Based on Availability)
- 16.2.10 Baxter International Inc
- 16.2.10.1. Overview
- 16.2.10.2. Products
- 16.2.10.3. SWOT Analysis
- 16.2.10.4. Recent Developments
- 16.2.10.5. Financials (Based on Availability)
- 16.2.11 Bristol-Myers Squibb Company
- 16.2.11.1. Overview
- 16.2.11.2. Products
- 16.2.11.3. SWOT Analysis
- 16.2.11.4. Recent Developments
- 16.2.11.5. Financials (Based on Availability)
- 16.2.12 Pfizer Inc
- 16.2.12.1. Overview
- 16.2.12.2. Products
- 16.2.12.3. SWOT Analysis
- 16.2.12.4. Recent Developments
- 16.2.12.5. Financials (Based on Availability)
- 16.2.1 Cellceutix Corporation
List of Figures
- Figure 1: Global Eye Cancer Industry Revenue Breakdown (Million, %) by Region 2024 & 2032
- Figure 2: North America Eye Cancer Industry Revenue (Million), by Country 2024 & 2032
- Figure 3: North America Eye Cancer Industry Revenue Share (%), by Country 2024 & 2032
- Figure 4: Europe Eye Cancer Industry Revenue (Million), by Country 2024 & 2032
- Figure 5: Europe Eye Cancer Industry Revenue Share (%), by Country 2024 & 2032
- Figure 6: Asia Pacific Eye Cancer Industry Revenue (Million), by Country 2024 & 2032
- Figure 7: Asia Pacific Eye Cancer Industry Revenue Share (%), by Country 2024 & 2032
- Figure 8: Middle East and Africa Eye Cancer Industry Revenue (Million), by Country 2024 & 2032
- Figure 9: Middle East and Africa Eye Cancer Industry Revenue Share (%), by Country 2024 & 2032
- Figure 10: South America Eye Cancer Industry Revenue (Million), by Country 2024 & 2032
- Figure 11: South America Eye Cancer Industry Revenue Share (%), by Country 2024 & 2032
- Figure 12: North America Eye Cancer Industry Revenue (Million), by Treatment Type 2024 & 2032
- Figure 13: North America Eye Cancer Industry Revenue Share (%), by Treatment Type 2024 & 2032
- Figure 14: North America Eye Cancer Industry Revenue (Million), by Type of Retinoblastoma 2024 & 2032
- Figure 15: North America Eye Cancer Industry Revenue Share (%), by Type of Retinoblastoma 2024 & 2032
- Figure 16: North America Eye Cancer Industry Revenue (Million), by Type of Staging 2024 & 2032
- Figure 17: North America Eye Cancer Industry Revenue Share (%), by Type of Staging 2024 & 2032
- Figure 18: North America Eye Cancer Industry Revenue (Million), by Country 2024 & 2032
- Figure 19: North America Eye Cancer Industry Revenue Share (%), by Country 2024 & 2032
- Figure 20: Europe Eye Cancer Industry Revenue (Million), by Treatment Type 2024 & 2032
- Figure 21: Europe Eye Cancer Industry Revenue Share (%), by Treatment Type 2024 & 2032
- Figure 22: Europe Eye Cancer Industry Revenue (Million), by Type of Retinoblastoma 2024 & 2032
- Figure 23: Europe Eye Cancer Industry Revenue Share (%), by Type of Retinoblastoma 2024 & 2032
- Figure 24: Europe Eye Cancer Industry Revenue (Million), by Type of Staging 2024 & 2032
- Figure 25: Europe Eye Cancer Industry Revenue Share (%), by Type of Staging 2024 & 2032
- Figure 26: Europe Eye Cancer Industry Revenue (Million), by Country 2024 & 2032
- Figure 27: Europe Eye Cancer Industry Revenue Share (%), by Country 2024 & 2032
- Figure 28: Asia Pacific Eye Cancer Industry Revenue (Million), by Treatment Type 2024 & 2032
- Figure 29: Asia Pacific Eye Cancer Industry Revenue Share (%), by Treatment Type 2024 & 2032
- Figure 30: Asia Pacific Eye Cancer Industry Revenue (Million), by Type of Retinoblastoma 2024 & 2032
- Figure 31: Asia Pacific Eye Cancer Industry Revenue Share (%), by Type of Retinoblastoma 2024 & 2032
- Figure 32: Asia Pacific Eye Cancer Industry Revenue (Million), by Type of Staging 2024 & 2032
- Figure 33: Asia Pacific Eye Cancer Industry Revenue Share (%), by Type of Staging 2024 & 2032
- Figure 34: Asia Pacific Eye Cancer Industry Revenue (Million), by Country 2024 & 2032
- Figure 35: Asia Pacific Eye Cancer Industry Revenue Share (%), by Country 2024 & 2032
- Figure 36: Middle East and Africa Eye Cancer Industry Revenue (Million), by Treatment Type 2024 & 2032
- Figure 37: Middle East and Africa Eye Cancer Industry Revenue Share (%), by Treatment Type 2024 & 2032
- Figure 38: Middle East and Africa Eye Cancer Industry Revenue (Million), by Type of Retinoblastoma 2024 & 2032
- Figure 39: Middle East and Africa Eye Cancer Industry Revenue Share (%), by Type of Retinoblastoma 2024 & 2032
- Figure 40: Middle East and Africa Eye Cancer Industry Revenue (Million), by Type of Staging 2024 & 2032
- Figure 41: Middle East and Africa Eye Cancer Industry Revenue Share (%), by Type of Staging 2024 & 2032
- Figure 42: Middle East and Africa Eye Cancer Industry Revenue (Million), by Country 2024 & 2032
- Figure 43: Middle East and Africa Eye Cancer Industry Revenue Share (%), by Country 2024 & 2032
- Figure 44: South America Eye Cancer Industry Revenue (Million), by Treatment Type 2024 & 2032
- Figure 45: South America Eye Cancer Industry Revenue Share (%), by Treatment Type 2024 & 2032
- Figure 46: South America Eye Cancer Industry Revenue (Million), by Type of Retinoblastoma 2024 & 2032
- Figure 47: South America Eye Cancer Industry Revenue Share (%), by Type of Retinoblastoma 2024 & 2032
- Figure 48: South America Eye Cancer Industry Revenue (Million), by Type of Staging 2024 & 2032
- Figure 49: South America Eye Cancer Industry Revenue Share (%), by Type of Staging 2024 & 2032
- Figure 50: South America Eye Cancer Industry Revenue (Million), by Country 2024 & 2032
- Figure 51: South America Eye Cancer Industry Revenue Share (%), by Country 2024 & 2032
List of Tables
- Table 1: Global Eye Cancer Industry Revenue Million Forecast, by Region 2019 & 2032
- Table 2: Global Eye Cancer Industry Revenue Million Forecast, by Treatment Type 2019 & 2032
- Table 3: Global Eye Cancer Industry Revenue Million Forecast, by Type of Retinoblastoma 2019 & 2032
- Table 4: Global Eye Cancer Industry Revenue Million Forecast, by Type of Staging 2019 & 2032
- Table 5: Global Eye Cancer Industry Revenue Million Forecast, by Region 2019 & 2032
- Table 6: Global Eye Cancer Industry Revenue Million Forecast, by Country 2019 & 2032
- Table 7: United States Eye Cancer Industry Revenue (Million) Forecast, by Application 2019 & 2032
- Table 8: Canada Eye Cancer Industry Revenue (Million) Forecast, by Application 2019 & 2032
- Table 9: Mexico Eye Cancer Industry Revenue (Million) Forecast, by Application 2019 & 2032
- Table 10: Global Eye Cancer Industry Revenue Million Forecast, by Country 2019 & 2032
- Table 11: Germany Eye Cancer Industry Revenue (Million) Forecast, by Application 2019 & 2032
- Table 12: United Kingdom Eye Cancer Industry Revenue (Million) Forecast, by Application 2019 & 2032
- Table 13: France Eye Cancer Industry Revenue (Million) Forecast, by Application 2019 & 2032
- Table 14: Italy Eye Cancer Industry Revenue (Million) Forecast, by Application 2019 & 2032
- Table 15: Spain Eye Cancer Industry Revenue (Million) Forecast, by Application 2019 & 2032
- Table 16: Rest of Europe Eye Cancer Industry Revenue (Million) Forecast, by Application 2019 & 2032
- Table 17: Global Eye Cancer Industry Revenue Million Forecast, by Country 2019 & 2032
- Table 18: China Eye Cancer Industry Revenue (Million) Forecast, by Application 2019 & 2032
- Table 19: Japan Eye Cancer Industry Revenue (Million) Forecast, by Application 2019 & 2032
- Table 20: India Eye Cancer Industry Revenue (Million) Forecast, by Application 2019 & 2032
- Table 21: Australia Eye Cancer Industry Revenue (Million) Forecast, by Application 2019 & 2032
- Table 22: South Korea Eye Cancer Industry Revenue (Million) Forecast, by Application 2019 & 2032
- Table 23: Rest of Asia Pacific Eye Cancer Industry Revenue (Million) Forecast, by Application 2019 & 2032
- Table 24: Global Eye Cancer Industry Revenue Million Forecast, by Country 2019 & 2032
- Table 25: GCC Eye Cancer Industry Revenue (Million) Forecast, by Application 2019 & 2032
- Table 26: South Africa Eye Cancer Industry Revenue (Million) Forecast, by Application 2019 & 2032
- Table 27: Rest of Middle East and Africa Eye Cancer Industry Revenue (Million) Forecast, by Application 2019 & 2032
- Table 28: Global Eye Cancer Industry Revenue Million Forecast, by Country 2019 & 2032
- Table 29: Brazil Eye Cancer Industry Revenue (Million) Forecast, by Application 2019 & 2032
- Table 30: Argentina Eye Cancer Industry Revenue (Million) Forecast, by Application 2019 & 2032
- Table 31: Rest of South America Eye Cancer Industry Revenue (Million) Forecast, by Application 2019 & 2032
- Table 32: Global Eye Cancer Industry Revenue Million Forecast, by Treatment Type 2019 & 2032
- Table 33: Global Eye Cancer Industry Revenue Million Forecast, by Type of Retinoblastoma 2019 & 2032
- Table 34: Global Eye Cancer Industry Revenue Million Forecast, by Type of Staging 2019 & 2032
- Table 35: Global Eye Cancer Industry Revenue Million Forecast, by Country 2019 & 2032
- Table 36: United States Eye Cancer Industry Revenue (Million) Forecast, by Application 2019 & 2032
- Table 37: Canada Eye Cancer Industry Revenue (Million) Forecast, by Application 2019 & 2032
- Table 38: Mexico Eye Cancer Industry Revenue (Million) Forecast, by Application 2019 & 2032
- Table 39: Global Eye Cancer Industry Revenue Million Forecast, by Treatment Type 2019 & 2032
- Table 40: Global Eye Cancer Industry Revenue Million Forecast, by Type of Retinoblastoma 2019 & 2032
- Table 41: Global Eye Cancer Industry Revenue Million Forecast, by Type of Staging 2019 & 2032
- Table 42: Global Eye Cancer Industry Revenue Million Forecast, by Country 2019 & 2032
- Table 43: Germany Eye Cancer Industry Revenue (Million) Forecast, by Application 2019 & 2032
- Table 44: United Kingdom Eye Cancer Industry Revenue (Million) Forecast, by Application 2019 & 2032
- Table 45: France Eye Cancer Industry Revenue (Million) Forecast, by Application 2019 & 2032
- Table 46: Italy Eye Cancer Industry Revenue (Million) Forecast, by Application 2019 & 2032
- Table 47: Spain Eye Cancer Industry Revenue (Million) Forecast, by Application 2019 & 2032
- Table 48: Rest of Europe Eye Cancer Industry Revenue (Million) Forecast, by Application 2019 & 2032
- Table 49: Global Eye Cancer Industry Revenue Million Forecast, by Treatment Type 2019 & 2032
- Table 50: Global Eye Cancer Industry Revenue Million Forecast, by Type of Retinoblastoma 2019 & 2032
- Table 51: Global Eye Cancer Industry Revenue Million Forecast, by Type of Staging 2019 & 2032
- Table 52: Global Eye Cancer Industry Revenue Million Forecast, by Country 2019 & 2032
- Table 53: China Eye Cancer Industry Revenue (Million) Forecast, by Application 2019 & 2032
- Table 54: Japan Eye Cancer Industry Revenue (Million) Forecast, by Application 2019 & 2032
- Table 55: India Eye Cancer Industry Revenue (Million) Forecast, by Application 2019 & 2032
- Table 56: Australia Eye Cancer Industry Revenue (Million) Forecast, by Application 2019 & 2032
- Table 57: South Korea Eye Cancer Industry Revenue (Million) Forecast, by Application 2019 & 2032
- Table 58: Rest of Asia Pacific Eye Cancer Industry Revenue (Million) Forecast, by Application 2019 & 2032
- Table 59: Global Eye Cancer Industry Revenue Million Forecast, by Treatment Type 2019 & 2032
- Table 60: Global Eye Cancer Industry Revenue Million Forecast, by Type of Retinoblastoma 2019 & 2032
- Table 61: Global Eye Cancer Industry Revenue Million Forecast, by Type of Staging 2019 & 2032
- Table 62: Global Eye Cancer Industry Revenue Million Forecast, by Country 2019 & 2032
- Table 63: GCC Eye Cancer Industry Revenue (Million) Forecast, by Application 2019 & 2032
- Table 64: South Africa Eye Cancer Industry Revenue (Million) Forecast, by Application 2019 & 2032
- Table 65: Rest of Middle East and Africa Eye Cancer Industry Revenue (Million) Forecast, by Application 2019 & 2032
- Table 66: Global Eye Cancer Industry Revenue Million Forecast, by Treatment Type 2019 & 2032
- Table 67: Global Eye Cancer Industry Revenue Million Forecast, by Type of Retinoblastoma 2019 & 2032
- Table 68: Global Eye Cancer Industry Revenue Million Forecast, by Type of Staging 2019 & 2032
- Table 69: Global Eye Cancer Industry Revenue Million Forecast, by Country 2019 & 2032
- Table 70: Brazil Eye Cancer Industry Revenue (Million) Forecast, by Application 2019 & 2032
- Table 71: Argentina Eye Cancer Industry Revenue (Million) Forecast, by Application 2019 & 2032
- Table 72: Rest of South America Eye Cancer Industry Revenue (Million) Forecast, by Application 2019 & 2032
Frequently Asked Questions
1. What is the projected Compound Annual Growth Rate (CAGR) of the Eye Cancer Industry?
The projected CAGR is approximately 4.45%.
2. Which companies are prominent players in the Eye Cancer Industry?
Key companies in the market include Cellceutix Corporation, Novartis AG, Cadila Pharmaceuticals, Icon Bioscience, GlaxoSmithKline plc, Teva Pharmaceutical Industries Ltd, Johnson & Johnson, RXi Pharmaceuticals*List Not Exhaustive, Merck & Co, Baxter International Inc, Bristol-Myers Squibb Company, Pfizer Inc.
3. What are the main segments of the Eye Cancer Industry?
The market segments include Treatment Type, Type of Retinoblastoma, Type of Staging.
4. Can you provide details about the market size?
The market size is estimated to be USD 1.85 Million as of 2022.
5. What are some drivers contributing to market growth?
Remission and the Chance of Recurrence of Retinoblastoma; Increasing Public Awareness on Retinoblastoma.
6. What are the notable trends driving market growth?
Non-hereditary Retinoblastoma is Expected to hold a Significant Market Share Over the Forecast Period.
7. Are there any restraints impacting market growth?
Side Effects of Retinoblastoma Surgery and High Cost of Treatment in Developing Countries.
8. Can you provide examples of recent developments in the market?
September 2022: researchers at UT Southwestern and the University of Miami discovered a molecule, estrogen-related receptor gamma, or ESRRG that is hyperactive and promotes tumor cell survival in retinoblastoma. Blocking ESRRG, the team reported in Science Advances, kills retinoblastoma cells.
9. What pricing options are available for accessing the report?
Pricing options include single-user, multi-user, and enterprise licenses priced at USD 4750, USD 5250, and USD 8750 respectively.
10. Is the market size provided in terms of value or volume?
The market size is provided in terms of value, measured in Million.
11. Are there any specific market keywords associated with the report?
Yes, the market keyword associated with the report is "Eye Cancer Industry," which aids in identifying and referencing the specific market segment covered.
12. How do I determine which pricing option suits my needs best?
The pricing options vary based on user requirements and access needs. Individual users may opt for single-user licenses, while businesses requiring broader access may choose multi-user or enterprise licenses for cost-effective access to the report.
13. Are there any additional resources or data provided in the Eye Cancer Industry report?
While the report offers comprehensive insights, it's advisable to review the specific contents or supplementary materials provided to ascertain if additional resources or data are available.
14. How can I stay updated on further developments or reports in the Eye Cancer Industry?
To stay informed about further developments, trends, and reports in the Eye Cancer Industry, consider subscribing to industry newsletters, following relevant companies and organizations, or regularly checking reputable industry news sources and publications.
Methodology
Step 1 - Identification of Relevant Samples Size from Population Database


Step 2 - Approaches for Defining Global Market Size (Value, Volume* & Price*)

Note*: In applicable scenarios
Step 3 - Data Sources
Primary Research
- Web Analytics
- Survey Reports
- Research Institute
- Latest Research Reports
- Opinion Leaders
Secondary Research
- Annual Reports
- White Paper
- Latest Press Release
- Industry Association
- Paid Database
- Investor Presentations

Step 4 - Data Triangulation
Involves using different sources of information in order to increase the validity of a study
These sources are likely to be stakeholders in a program - participants, other researchers, program staff, other community members, and so on.
Then we put all data in single framework & apply various statistical tools to find out the dynamic on the market.
During the analysis stage, feedback from the stakeholder groups would be compared to determine areas of agreement as well as areas of divergence


