

Key Insights
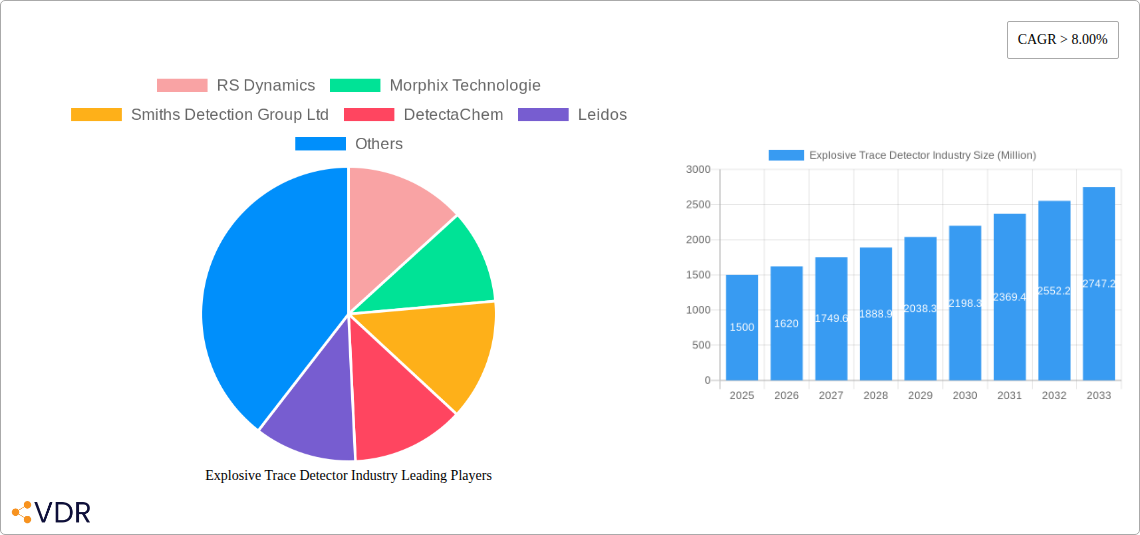
The Explosive Trace Detector (ETD) market is experiencing significant expansion, propelled by escalating global security imperatives and the rise in security threats. The market is projected to grow at a Compound Annual Growth Rate (CAGR) of 8.57%, reaching a market size of $1.71 billion by 2025. Key growth drivers include stringent aviation security protocols, enhanced border surveillance, and the increasing deployment of ETDs in high-traffic public venues. Technological innovations, such as the development of advanced, portable, and highly sensitive detectors, are further accelerating market penetration. The market is segmented by end-use, including commercial, defense, and public safety sectors, and by product type, such as handheld, portable, and fixed detectors. The defense sector represents a substantial market share due to critical requirements in military and counter-terrorism operations, while handheld devices lead in product adoption owing to their operational flexibility.
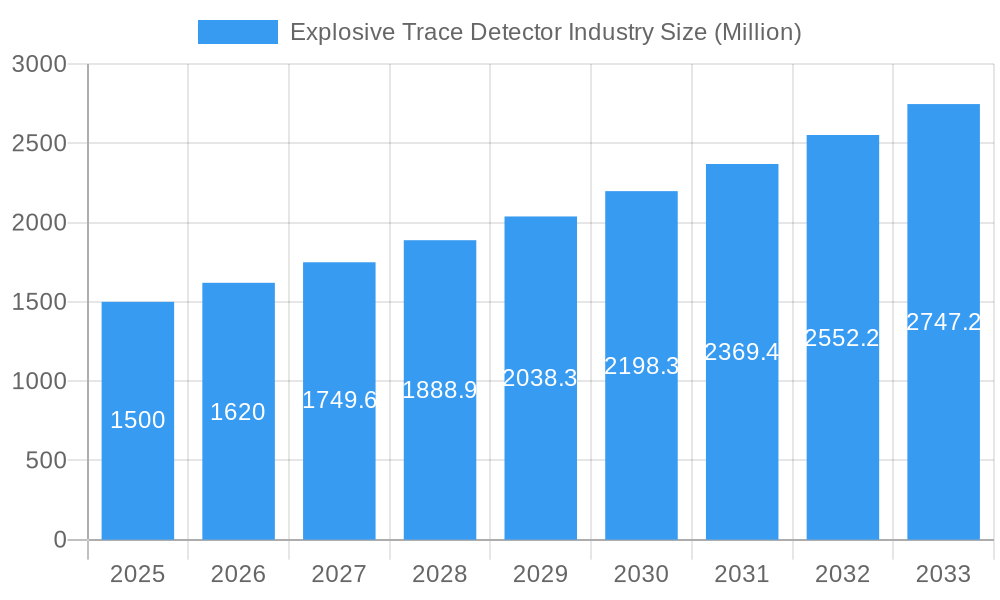
Explosive Trace Detector Industry Market Size (In Billion)
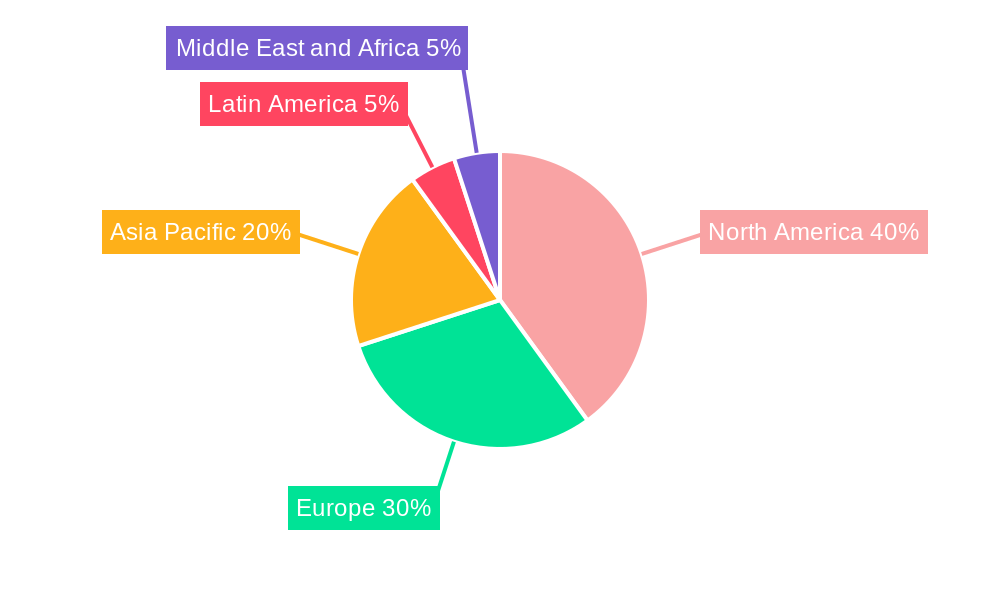
North America and Europe currently dominate the ETD market, supported by robust security infrastructure and high technology adoption rates. However, the Asia-Pacific region is anticipated to exhibit the fastest growth, driven by rapid urban development and substantial investments in homeland security initiatives. While market growth may be tempered by initial acquisition costs and ongoing maintenance requirements, the outlook remains strongly positive. Major industry participants, including RS Dynamics, Morphix Technologie, and Smiths Detection, are focusing on innovation and strategic collaborations to solidify their market standing and meet the increasing demand for sophisticated ETD solutions. Future market expansion will be contingent upon continuous advancements in detection sensitivity, minimization of false alarms, and the development of intuitive user interfaces.
Explosive Trace Detector Industry Company Market Share
Explosive Trace Detector Industry Market Report: 2019-2033
This comprehensive report provides a detailed analysis of the Explosive Trace Detector (ETD) industry, offering invaluable insights for industry professionals, investors, and strategic decision-makers. The study period covers 2019-2033, with a base year of 2025 and a forecast period of 2025-2033. The report segments the market by end-use (Commercial, Defense, Others – including Public safety, Law Enforcement, and Homeland Security) and product type (Handheld, Portable/Movable, Fixed). Key players analyzed include RS Dynamics, Morphix Technologie, Smiths Detection Group Ltd, DetectaChem, Leidos, Bruker, Analogic Corporation, OSI Systems Inc, Autoclear LLC, and Teledyne FLIR LLC. The global market size is projected to reach xx Million units by 2033.
Explosive Trace Detector Industry Market Dynamics & Structure
The ETD market is characterized by moderate concentration, with a few major players holding significant market share, while numerous smaller companies compete in niche segments. Technological innovation, driven by advancements in sensor technology and data analytics, is a key growth driver. Stringent regulatory frameworks and safety standards influence product development and market access. Competitive substitutes, such as canine detection units, exist, but ETDs offer advantages in speed, consistency, and scalability. The end-user demographic is diverse, encompassing government agencies, commercial airports, and private security firms. M&A activity has been relatively moderate in recent years, with xx deals recorded between 2019 and 2024, primarily focused on consolidating technological capabilities and expanding market reach.
- Market Concentration: Moderately concentrated, with top 5 players holding approximately xx% market share in 2025.
- Technological Innovation: Advancements in sensor technology (e.g., Ion Mobility Spectrometry, Mass Spectrometry) and AI-powered data analysis are driving improved sensitivity and accuracy.
- Regulatory Landscape: Stringent regulations regarding sensitivity, reliability, and safety standards influence product development and market entry.
- Competitive Substitutes: Canine detection remains a significant alternative, but ETDs offer advantages in speed and consistency.
- M&A Activity: xx M&A deals between 2019-2024, focused on technological integration and market expansion. Deal value estimated at xx Million USD.
Explosive Trace Detector Industry Growth Trends & Insights
The ETD market experienced significant growth during the historical period (2019-2024), driven by increasing security concerns globally and advancements in technology. The market size grew from xx Million units in 2019 to xx Million units in 2024, exhibiting a CAGR of xx%. Adoption rates are highest in developed nations with robust security infrastructure and stringent regulatory environments. Technological disruptions, such as the integration of AI and machine learning, are enhancing the accuracy and speed of detection, further boosting market growth. Shifting consumer behavior towards prioritizing security and safety also fuels demand. The forecast period (2025-2033) anticipates continued growth, with a projected CAGR of xx%, driven by factors such as increasing global terrorism threats, expanding commercial aviation, and rising adoption in public safety applications. Market penetration is expected to reach xx% by 2033.
Dominant Regions, Countries, or Segments in Explosive Trace Detector Industry
North America currently holds the largest market share, driven by robust government spending on security and the presence of major industry players. Within North America, the US dominates due to its significant defense budget and stringent security measures. The Defense segment leads the end-use market, contributing approximately xx% of total revenue in 2025, followed by the Commercial and Others segments. Handheld devices account for the largest share of the product market, owing to their portability and ease of use.
- Key Drivers for North America Dominance: High government spending on defense and homeland security, stringent security regulations, and a strong presence of major ETD manufacturers.
- Growth Potential in Other Regions: Asia-Pacific is anticipated to experience the fastest growth rate during the forecast period, driven by increasing investments in infrastructure and security, coupled with rising terrorism concerns.
- Market Share: North America (xx%), Europe (xx%), Asia-Pacific (xx%), Rest of World (xx%) in 2025.
Explosive Trace Detector Industry Product Landscape
The ETD market offers a diverse range of products, categorized by their portability and detection technology. Handheld devices prioritize mobility and ease of use, while portable/movable units provide enhanced sensitivity and analytical capabilities. Fixed systems are often deployed in high-security locations for continuous monitoring. Recent innovations include improved sensitivity, reduced false positives, and faster detection times. Unique selling propositions often focus on ease of use, portability, and the integration of advanced technologies such as AI for enhanced data analysis and improved accuracy.
Key Drivers, Barriers & Challenges in Explosive Trace Detector Industry
Key Drivers:
- Increasing global security concerns and terrorist threats.
- Stringent government regulations and security protocols.
- Advancements in detection technologies (e.g., improved sensitivity and reduced false positives).
- Growing demand for ETDs in commercial aviation and public spaces.
Challenges & Restraints:
- High initial investment costs associated with acquiring and maintaining ETDs.
- Potential for false positives, leading to operational delays and inconvenience.
- Dependence on specialized training and expertise for effective operation and maintenance.
- The emergence of new, evolving explosive threats requires constant technological upgrades and adaptation. This represents an estimated xx% increase in operational costs annually.
Emerging Opportunities in Explosive Trace Detector Industry
- Expansion into developing markets with rising security concerns.
- Development of more sophisticated, AI-powered ETD systems with improved accuracy and reduced false positives.
- Integration of ETDs with other security technologies for enhanced threat detection and response capabilities.
- Development of portable, user-friendly devices for wider adoption in public safety and law enforcement.
Growth Accelerators in the Explosive Trace Detector Industry
Technological advancements, particularly in areas such as miniaturization, improved sensitivity, and AI-driven data analysis, are key growth catalysts. Strategic partnerships between ETD manufacturers and security integrators facilitate market expansion and adoption. Expansion into new markets, especially in developing nations experiencing increased security concerns, will significantly contribute to long-term growth.
Key Players Shaping the Explosive Trace Detector Industry Market
- RS Dynamics
- Morphix Technologie
- Smiths Detection Group Ltd
- DetectaChem
- Leidos
- Bruker
- Analogic Corporation
- OSI Systems Inc
- Autoclear LLC
- Teledyne FLIR LLC
Notable Milestones in Explosive Trace Detector Industry Sector
- 2020: Smiths Detection launched a new handheld ETD with enhanced sensitivity and reduced false positives.
- 2021: Leidos secured a major contract to supply ETDs to a major airport authority.
- 2022: Bruker acquired a smaller ETD company, expanding its product portfolio and technological capabilities.
- 2023: Increased investment in R&D by major players focused on AI integration and miniaturization.
In-Depth Explosive Trace Detector Industry Market Outlook
The ETD market is poised for robust growth driven by ongoing technological innovation, increasing security concerns globally, and expanding applications across various sectors. Strategic partnerships, market expansion into developing economies, and the development of advanced, AI-powered systems will be pivotal in shaping the future market landscape. The potential for significant market expansion exists, particularly in integrating ETDs with other security technologies to create a comprehensive and effective security solution.
Explosive Trace Detector Industry Segmentation
-
1. Product
- 1.1. Handheld
- 1.2. Portable/Movable
- 1.3. Fixed
-
2. End Use
- 2.1. Commercial
- 2.2. Defense
- 2.3. Others (
Explosive Trace Detector Industry Segmentation By Geography
-
1. North America
- 1.1. United States
- 1.2. Canada
-
2. Europe
- 2.1. Germany
- 2.2. United Kingdom
- 2.3. France
- 2.4. Russia
- 2.5. Rest of Europe
-
3. Asia Pacific
- 3.1. India
- 3.2. China
- 3.3. Japan
- 3.4. South Korea
- 3.5. Rest of Asia Pacific
-
4. Latin America
- 4.1. Brazil
- 4.2. Rest of Latin America
-
5. Middle East and Africa
- 5.1. United Arab Emirates
- 5.2. Saudi Arabia
- 5.3. Egypt
- 5.4. Rest of Middle East and Africa
Explosive Trace Detector Industry Regional Market Share
Geographic Coverage of Explosive Trace Detector Industry
Explosive Trace Detector Industry REPORT HIGHLIGHTS
| Aspects | Details |
|---|---|
| Study Period | 2020-2034 |
| Base Year | 2025 |
| Estimated Year | 2026 |
| Forecast Period | 2026-2034 |
| Historical Period | 2020-2025 |
| Growth Rate | CAGR of 8.57% from 2020-2034 |
| Segmentation |
|
Table of Contents
- 1. Introduction
- 1.1. Research Scope
- 1.2. Market Segmentation
- 1.3. Research Objective
- 1.4. Definitions and Assumptions
- 2. Executive Summary
- 2.1. Market Snapshot
- 3. Market Dynamics
- 3.1. Market Drivers
- 3.2. Market Restrains
- 3.3. Market Trends
- 3.4. Market Opportunities
- 4. Market Factor Analysis
- 4.1. Porters Five Forces
- 4.1.1. Bargaining Power of Suppliers
- 4.1.2. Bargaining Power of Buyers
- 4.1.3. Threat of New Entrants
- 4.1.4. Threat of Substitutes
- 4.1.5. Competitive Rivalry
- 4.2. PESTEL analysis
- 4.3. BCG Analysis
- 4.3.1. Stars (High Growth, High Market Share)
- 4.3.2. Cash Cows (Low Growth, High Market Share)
- 4.3.3. Question Mark (High Growth, Low Market Share)
- 4.3.4. Dogs (Low Growth, Low Market Share)
- 4.4. Ansoff Matrix Analysis
- 4.5. Supply Chain Analysis
- 4.6. Regulatory Landscape
- 4.7. Current Market Potential and Opportunity Assessment (TAM–SAM–SOM Framework)
- 4.8. VDR Analyst Note
- 4.1. Porters Five Forces
- 5. Market Analysis, Insights and Forecast 2021-2033
- 5.1. Market Analysis, Insights and Forecast - by Product
- 5.1.1. Handheld
- 5.1.2. Portable/Movable
- 5.1.3. Fixed
- 5.2. Market Analysis, Insights and Forecast - by End Use
- 5.2.1. Commercial
- 5.2.2. Defense
- 5.2.3. Others (
- 5.3. Market Analysis, Insights and Forecast - by Region
- 5.3.1. North America
- 5.3.2. Europe
- 5.3.3. Asia Pacific
- 5.3.4. Latin America
- 5.3.5. Middle East and Africa
- 5.1. Market Analysis, Insights and Forecast - by Product
- 6. Global Explosive Trace Detector Industry Analysis, Insights and Forecast, 2021-2033
- 6.1. Market Analysis, Insights and Forecast - by Product
- 6.1.1. Handheld
- 6.1.2. Portable/Movable
- 6.1.3. Fixed
- 6.2. Market Analysis, Insights and Forecast - by End Use
- 6.2.1. Commercial
- 6.2.2. Defense
- 6.2.3. Others (
- 6.1. Market Analysis, Insights and Forecast - by Product
- 7. North America Explosive Trace Detector Industry Analysis, Insights and Forecast, 2021-2033
- 7.1. Market Analysis, Insights and Forecast - by Product
- 7.1.1. Handheld
- 7.1.2. Portable/Movable
- 7.1.3. Fixed
- 7.2. Market Analysis, Insights and Forecast - by End Use
- 7.2.1. Commercial
- 7.2.2. Defense
- 7.2.3. Others (
- 7.1. Market Analysis, Insights and Forecast - by Product
- 8. Europe Explosive Trace Detector Industry Analysis, Insights and Forecast, 2021-2033
- 8.1. Market Analysis, Insights and Forecast - by Product
- 8.1.1. Handheld
- 8.1.2. Portable/Movable
- 8.1.3. Fixed
- 8.2. Market Analysis, Insights and Forecast - by End Use
- 8.2.1. Commercial
- 8.2.2. Defense
- 8.2.3. Others (
- 8.1. Market Analysis, Insights and Forecast - by Product
- 9. Asia Pacific Explosive Trace Detector Industry Analysis, Insights and Forecast, 2021-2033
- 9.1. Market Analysis, Insights and Forecast - by Product
- 9.1.1. Handheld
- 9.1.2. Portable/Movable
- 9.1.3. Fixed
- 9.2. Market Analysis, Insights and Forecast - by End Use
- 9.2.1. Commercial
- 9.2.2. Defense
- 9.2.3. Others (
- 9.1. Market Analysis, Insights and Forecast - by Product
- 10. Latin America Explosive Trace Detector Industry Analysis, Insights and Forecast, 2021-2033
- 10.1. Market Analysis, Insights and Forecast - by Product
- 10.1.1. Handheld
- 10.1.2. Portable/Movable
- 10.1.3. Fixed
- 10.2. Market Analysis, Insights and Forecast - by End Use
- 10.2.1. Commercial
- 10.2.2. Defense
- 10.2.3. Others (
- 10.1. Market Analysis, Insights and Forecast - by Product
- 11. Middle East and Africa Explosive Trace Detector Industry Analysis, Insights and Forecast, 2021-2033
- 11.1. Market Analysis, Insights and Forecast - by Product
- 11.1.1. Handheld
- 11.1.2. Portable/Movable
- 11.1.3. Fixed
- 11.2. Market Analysis, Insights and Forecast - by End Use
- 11.2.1. Commercial
- 11.2.2. Defense
- 11.2.3. Others (
- 11.1. Market Analysis, Insights and Forecast - by Product
- 12. Competitive Analysis
- 12.1. Company Profiles
- 12.1.1 RS Dynamics
- 12.1.1.1. Company Overview
- 12.1.1.2. Products
- 12.1.1.3. Company Financials
- 12.1.1.4. SWOT Analysis
- 12.1.2 Morphix Technologie
- 12.1.2.1. Company Overview
- 12.1.2.2. Products
- 12.1.2.3. Company Financials
- 12.1.2.4. SWOT Analysis
- 12.1.3 Smiths Detection Group Ltd
- 12.1.3.1. Company Overview
- 12.1.3.2. Products
- 12.1.3.3. Company Financials
- 12.1.3.4. SWOT Analysis
- 12.1.4 DetectaChem
- 12.1.4.1. Company Overview
- 12.1.4.2. Products
- 12.1.4.3. Company Financials
- 12.1.4.4. SWOT Analysis
- 12.1.5 Leidos
- 12.1.5.1. Company Overview
- 12.1.5.2. Products
- 12.1.5.3. Company Financials
- 12.1.5.4. SWOT Analysis
- 12.1.6 Bruker
- 12.1.6.1. Company Overview
- 12.1.6.2. Products
- 12.1.6.3. Company Financials
- 12.1.6.4. SWOT Analysis
- 12.1.7 Analogic Corporation
- 12.1.7.1. Company Overview
- 12.1.7.2. Products
- 12.1.7.3. Company Financials
- 12.1.7.4. SWOT Analysis
- 12.1.8 OSI Systems Inc
- 12.1.8.1. Company Overview
- 12.1.8.2. Products
- 12.1.8.3. Company Financials
- 12.1.8.4. SWOT Analysis
- 12.1.9 Autoclear LLC
- 12.1.9.1. Company Overview
- 12.1.9.2. Products
- 12.1.9.3. Company Financials
- 12.1.9.4. SWOT Analysis
- 12.1.10 Teledyne FLIR LLC
- 12.1.10.1. Company Overview
- 12.1.10.2. Products
- 12.1.10.3. Company Financials
- 12.1.10.4. SWOT Analysis
- 12.1.1 RS Dynamics
- 12.2. Market Entropy
- 12.2.1 Company's Key Areas Served
- 12.2.2 Recent Developments
- 12.3. Company Market Share Analysis 2025
- 12.3.1 Top 5 Companies Market Share Analysis
- 12.3.2 Top 3 Companies Market Share Analysis
- 12.4. List of Potential Customers
- 13. Research Methodology
List of Figures
- Figure 1: Global Explosive Trace Detector Industry Revenue Breakdown (billion, %) by Region 2025 & 2033
- Figure 2: North America Explosive Trace Detector Industry Revenue (billion), by Product 2025 & 2033
- Figure 3: North America Explosive Trace Detector Industry Revenue Share (%), by Product 2025 & 2033
- Figure 4: North America Explosive Trace Detector Industry Revenue (billion), by End Use 2025 & 2033
- Figure 5: North America Explosive Trace Detector Industry Revenue Share (%), by End Use 2025 & 2033
- Figure 6: North America Explosive Trace Detector Industry Revenue (billion), by Country 2025 & 2033
- Figure 7: North America Explosive Trace Detector Industry Revenue Share (%), by Country 2025 & 2033
- Figure 8: Europe Explosive Trace Detector Industry Revenue (billion), by Product 2025 & 2033
- Figure 9: Europe Explosive Trace Detector Industry Revenue Share (%), by Product 2025 & 2033
- Figure 10: Europe Explosive Trace Detector Industry Revenue (billion), by End Use 2025 & 2033
- Figure 11: Europe Explosive Trace Detector Industry Revenue Share (%), by End Use 2025 & 2033
- Figure 12: Europe Explosive Trace Detector Industry Revenue (billion), by Country 2025 & 2033
- Figure 13: Europe Explosive Trace Detector Industry Revenue Share (%), by Country 2025 & 2033
- Figure 14: Asia Pacific Explosive Trace Detector Industry Revenue (billion), by Product 2025 & 2033
- Figure 15: Asia Pacific Explosive Trace Detector Industry Revenue Share (%), by Product 2025 & 2033
- Figure 16: Asia Pacific Explosive Trace Detector Industry Revenue (billion), by End Use 2025 & 2033
- Figure 17: Asia Pacific Explosive Trace Detector Industry Revenue Share (%), by End Use 2025 & 2033
- Figure 18: Asia Pacific Explosive Trace Detector Industry Revenue (billion), by Country 2025 & 2033
- Figure 19: Asia Pacific Explosive Trace Detector Industry Revenue Share (%), by Country 2025 & 2033
- Figure 20: Latin America Explosive Trace Detector Industry Revenue (billion), by Product 2025 & 2033
- Figure 21: Latin America Explosive Trace Detector Industry Revenue Share (%), by Product 2025 & 2033
- Figure 22: Latin America Explosive Trace Detector Industry Revenue (billion), by End Use 2025 & 2033
- Figure 23: Latin America Explosive Trace Detector Industry Revenue Share (%), by End Use 2025 & 2033
- Figure 24: Latin America Explosive Trace Detector Industry Revenue (billion), by Country 2025 & 2033
- Figure 25: Latin America Explosive Trace Detector Industry Revenue Share (%), by Country 2025 & 2033
- Figure 26: Middle East and Africa Explosive Trace Detector Industry Revenue (billion), by Product 2025 & 2033
- Figure 27: Middle East and Africa Explosive Trace Detector Industry Revenue Share (%), by Product 2025 & 2033
- Figure 28: Middle East and Africa Explosive Trace Detector Industry Revenue (billion), by End Use 2025 & 2033
- Figure 29: Middle East and Africa Explosive Trace Detector Industry Revenue Share (%), by End Use 2025 & 2033
- Figure 30: Middle East and Africa Explosive Trace Detector Industry Revenue (billion), by Country 2025 & 2033
- Figure 31: Middle East and Africa Explosive Trace Detector Industry Revenue Share (%), by Country 2025 & 2033
List of Tables
- Table 1: Global Explosive Trace Detector Industry Revenue billion Forecast, by Product 2020 & 2033
- Table 2: Global Explosive Trace Detector Industry Revenue billion Forecast, by End Use 2020 & 2033
- Table 3: Global Explosive Trace Detector Industry Revenue billion Forecast, by Region 2020 & 2033
- Table 4: Global Explosive Trace Detector Industry Revenue billion Forecast, by Product 2020 & 2033
- Table 5: Global Explosive Trace Detector Industry Revenue billion Forecast, by End Use 2020 & 2033
- Table 6: Global Explosive Trace Detector Industry Revenue billion Forecast, by Country 2020 & 2033
- Table 7: United States Explosive Trace Detector Industry Revenue (billion) Forecast, by Application 2020 & 2033
- Table 8: Canada Explosive Trace Detector Industry Revenue (billion) Forecast, by Application 2020 & 2033
- Table 9: Global Explosive Trace Detector Industry Revenue billion Forecast, by Product 2020 & 2033
- Table 10: Global Explosive Trace Detector Industry Revenue billion Forecast, by End Use 2020 & 2033
- Table 11: Global Explosive Trace Detector Industry Revenue billion Forecast, by Country 2020 & 2033
- Table 12: Germany Explosive Trace Detector Industry Revenue (billion) Forecast, by Application 2020 & 2033
- Table 13: United Kingdom Explosive Trace Detector Industry Revenue (billion) Forecast, by Application 2020 & 2033
- Table 14: France Explosive Trace Detector Industry Revenue (billion) Forecast, by Application 2020 & 2033
- Table 15: Russia Explosive Trace Detector Industry Revenue (billion) Forecast, by Application 2020 & 2033
- Table 16: Rest of Europe Explosive Trace Detector Industry Revenue (billion) Forecast, by Application 2020 & 2033
- Table 17: Global Explosive Trace Detector Industry Revenue billion Forecast, by Product 2020 & 2033
- Table 18: Global Explosive Trace Detector Industry Revenue billion Forecast, by End Use 2020 & 2033
- Table 19: Global Explosive Trace Detector Industry Revenue billion Forecast, by Country 2020 & 2033
- Table 20: India Explosive Trace Detector Industry Revenue (billion) Forecast, by Application 2020 & 2033
- Table 21: China Explosive Trace Detector Industry Revenue (billion) Forecast, by Application 2020 & 2033
- Table 22: Japan Explosive Trace Detector Industry Revenue (billion) Forecast, by Application 2020 & 2033
- Table 23: South Korea Explosive Trace Detector Industry Revenue (billion) Forecast, by Application 2020 & 2033
- Table 24: Rest of Asia Pacific Explosive Trace Detector Industry Revenue (billion) Forecast, by Application 2020 & 2033
- Table 25: Global Explosive Trace Detector Industry Revenue billion Forecast, by Product 2020 & 2033
- Table 26: Global Explosive Trace Detector Industry Revenue billion Forecast, by End Use 2020 & 2033
- Table 27: Global Explosive Trace Detector Industry Revenue billion Forecast, by Country 2020 & 2033
- Table 28: Brazil Explosive Trace Detector Industry Revenue (billion) Forecast, by Application 2020 & 2033
- Table 29: Rest of Latin America Explosive Trace Detector Industry Revenue (billion) Forecast, by Application 2020 & 2033
- Table 30: Global Explosive Trace Detector Industry Revenue billion Forecast, by Product 2020 & 2033
- Table 31: Global Explosive Trace Detector Industry Revenue billion Forecast, by End Use 2020 & 2033
- Table 32: Global Explosive Trace Detector Industry Revenue billion Forecast, by Country 2020 & 2033
- Table 33: United Arab Emirates Explosive Trace Detector Industry Revenue (billion) Forecast, by Application 2020 & 2033
- Table 34: Saudi Arabia Explosive Trace Detector Industry Revenue (billion) Forecast, by Application 2020 & 2033
- Table 35: Egypt Explosive Trace Detector Industry Revenue (billion) Forecast, by Application 2020 & 2033
- Table 36: Rest of Middle East and Africa Explosive Trace Detector Industry Revenue (billion) Forecast, by Application 2020 & 2033
Frequently Asked Questions
1. What is the projected Compound Annual Growth Rate (CAGR) of the Explosive Trace Detector Industry?
The projected CAGR is approximately 8.57%.
2. Which companies are prominent players in the Explosive Trace Detector Industry?
Key companies in the market include RS Dynamics, Morphix Technologie, Smiths Detection Group Ltd, DetectaChem, Leidos, Bruker, Analogic Corporation, OSI Systems Inc, Autoclear LLC, Teledyne FLIR LLC.
3. What are the main segments of the Explosive Trace Detector Industry?
The market segments include Product, End Use.
4. Can you provide details about the market size?
The market size is estimated to be USD 1.71 billion as of 2022.
5. What are some drivers contributing to market growth?
N/A
6. What are the notable trends driving market growth?
Commercial Segment is Projected to Show Significant Growth During the Forecast Period.
7. Are there any restraints impacting market growth?
N/A
8. Can you provide examples of recent developments in the market?
N/A
9. What pricing options are available for accessing the report?
Pricing options include single-user, multi-user, and enterprise licenses priced at USD 4750, USD 5250, and USD 8750 respectively.
10. Is the market size provided in terms of value or volume?
The market size is provided in terms of value, measured in billion.
11. Are there any specific market keywords associated with the report?
Yes, the market keyword associated with the report is "Explosive Trace Detector Industry," which aids in identifying and referencing the specific market segment covered.
12. How do I determine which pricing option suits my needs best?
The pricing options vary based on user requirements and access needs. Individual users may opt for single-user licenses, while businesses requiring broader access may choose multi-user or enterprise licenses for cost-effective access to the report.
13. Are there any additional resources or data provided in the Explosive Trace Detector Industry report?
While the report offers comprehensive insights, it's advisable to review the specific contents or supplementary materials provided to ascertain if additional resources or data are available.
14. How can I stay updated on further developments or reports in the Explosive Trace Detector Industry?
To stay informed about further developments, trends, and reports in the Explosive Trace Detector Industry, consider subscribing to industry newsletters, following relevant companies and organizations, or regularly checking reputable industry news sources and publications.
Methodology
Step 1 - Identification of Relevant Samples Size from Population Database


Step 2 - Approaches for Defining Global Market Size (Value, Volume* & Price*)

Note*: In applicable scenarios
Step 3 - Data Sources
Primary Research
- Web Analytics
- Survey Reports
- Research Institute
- Latest Research Reports
- Opinion Leaders
Secondary Research
- Annual Reports
- White Paper
- Latest Press Release
- Industry Association
- Paid Database
- Investor Presentations

Step 4 - Data Triangulation
Involves using different sources of information in order to increase the validity of a study
These sources are likely to be stakeholders in a program - participants, other researchers, program staff, other community members, and so on.
Then we put all data in single framework & apply various statistical tools to find out the dynamic on the market.
During the analysis stage, feedback from the stakeholder groups would be compared to determine areas of agreement as well as areas of divergence