
Key Insights
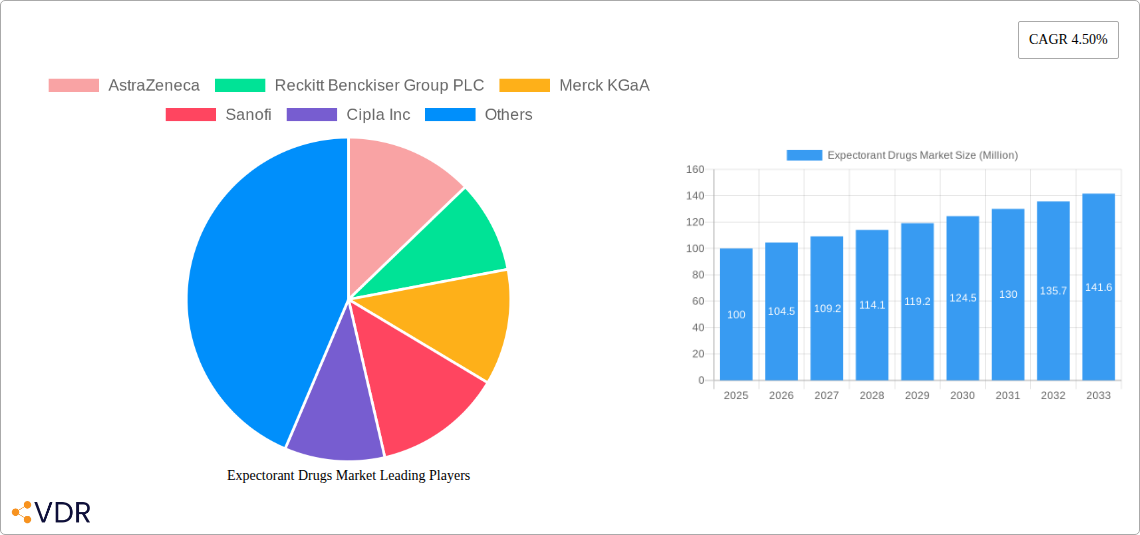
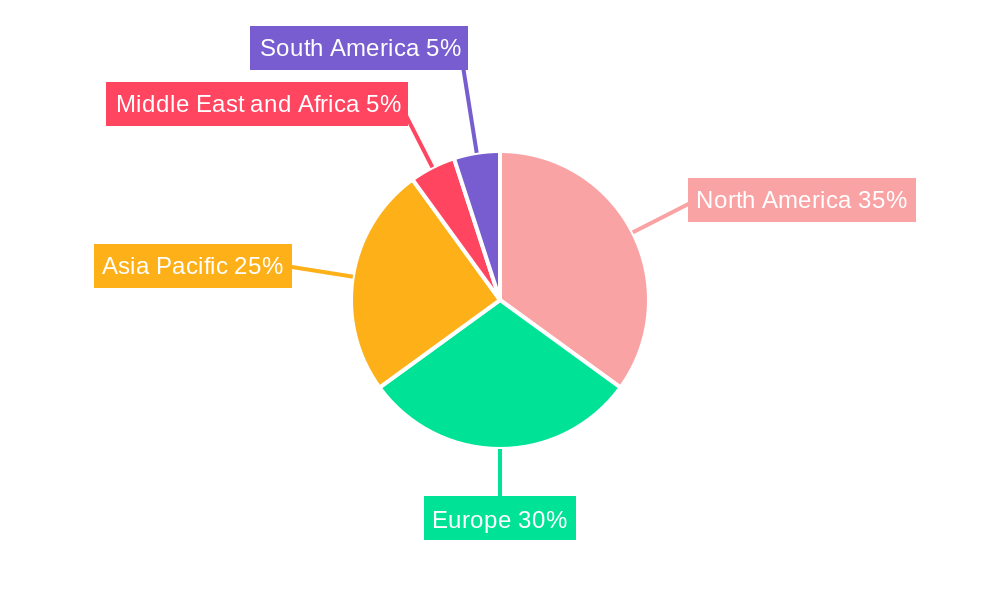
The global expectorant drugs market, valued at approximately $100 million in 2025, is projected to experience steady growth with a compound annual growth rate (CAGR) of 4.50% from 2025 to 2033. This growth is driven by several key factors. Increasing prevalence of respiratory illnesses like bronchitis, asthma, and the common cold fuels demand for effective expectorant medications. The aging global population, particularly in developed nations, contributes significantly to this demand, as older individuals are more susceptible to respiratory issues. Furthermore, rising disposable incomes in emerging economies, coupled with increased healthcare awareness, are expanding market access and driving consumption. The market is segmented by dosage form (inhalants, oral solids, oral liquids), distribution channel (hospital pharmacies, retail stores, online pharmacies), and product type (over-the-counter (OTC) and prescription drugs). The OTC segment is expected to dominate due to ease of access and affordability. North America and Europe currently hold substantial market share, but the Asia-Pacific region is anticipated to exhibit significant growth potential due to its expanding population and rising healthcare expenditure. Competitive dynamics within the market are characterized by the presence of established pharmaceutical companies alongside emerging players, resulting in ongoing innovation and competition in terms of product formulation, efficacy, and pricing.
The market's growth is, however, subject to certain restraints. Stringent regulatory approvals for new drug launches can impede market expansion. Generic competition, particularly in the OTC segment, exerts price pressure on market players. Moreover, the potential for adverse effects associated with some expectorant medications and the availability of alternative treatment options represent challenges. To capitalize on market opportunities, pharmaceutical companies are investing in research and development to develop novel expectorant formulations with improved efficacy and safety profiles. Strategic partnerships, mergers, and acquisitions are also common strategies for market players to enhance their market position and expand their product portfolio. The ongoing trend towards personalized medicine and telemedicine is expected to further shape the future of the expectorant drugs market.
Expectorant Drugs Market: A Comprehensive Report (2019-2033)
This comprehensive report provides an in-depth analysis of the global Expectorant Drugs market, encompassing market dynamics, growth trends, regional segmentation, product landscape, key players, and future outlook. The study period spans from 2019 to 2033, with 2025 serving as the base and estimated year. The report segments the market by dosage form (Inhalant, Oral Solid, Oral Liquid), distribution channel (Hospital Pharmacies, Retail Stores, Drug Stores, Online Pharmacies), and product type (Over-the-Counter (OTC), Prescription Drug). The market is projected to reach xx Million units by 2033, exhibiting a CAGR of xx% during the forecast period (2025-2033).
Expectorant Drugs Market Dynamics & Structure
The global expectorant drugs market is characterized by a moderately consolidated structure, with key players like AstraZeneca, Reckitt Benckiser Group PLC, and GSK plc holding significant market share. Technological innovation, primarily focused on improved drug delivery systems and formulations (e.g., extended-release tablets), is a key driver. Stringent regulatory frameworks, varying across regions, impact market access and product approvals. Competitive pressure from generic substitutes influences pricing and market share. The market also witnesses consistent M&A activity, with companies seeking expansion through acquisitions and strategic partnerships.
- Market Concentration: The top 5 players collectively hold approximately xx% market share in 2025.
- Technological Innovation: Focus on extended-release formulations and targeted drug delivery systems is driving growth.
- Regulatory Landscape: Stringent approval processes, particularly for prescription drugs, pose challenges.
- Competitive Substitutes: The availability of generic alternatives influences market pricing and competition.
- M&A Activity: An estimated xx M&A deals occurred in the expectorant drug sector between 2019 and 2024.
- End-User Demographics: The market is driven by a growing aging population and increasing prevalence of respiratory illnesses.
Expectorant Drugs Market Growth Trends & Insights
The expectorant drugs market experienced significant growth between 2019 and 2024, driven by factors such as the rising prevalence of respiratory infections, increasing healthcare expenditure, and rising awareness about self-medication for common cold and cough. Technological advancements, such as the introduction of extended-release formulations offering improved patient compliance, further fueled market expansion. Changing consumer behavior, with a preference for convenient OTC options, contributed significantly to market growth. The market is expected to witness continued expansion, driven by factors such as rising disposable incomes in emerging economies and increased access to healthcare services. Market penetration of newer formulations and the growing preference for online pharmacies are other notable trends.
The market size is estimated at xx Million units in 2025, with an expected CAGR of xx% from 2025 to 2033. Adoption rates for OTC expectorants are relatively high, while prescription drug adoption is influenced by physician recommendation and disease severity.
Dominant Regions, Countries, or Segments in Expectorant Drugs Market
North America currently holds the largest market share in the global expectorant drugs market, driven by high healthcare expenditure, advanced healthcare infrastructure, and a high prevalence of respiratory illnesses. However, Asia Pacific is projected to exhibit the fastest growth rate during the forecast period, fueled by rising disposable incomes, improving healthcare access, and a growing population susceptible to respiratory infections.
- By Dosage Form: Oral liquids currently dominate, followed by oral solids. Inhalants hold a smaller but growing segment.
- By Distribution Channel: Retail stores comprise the largest distribution channel, followed by drug stores. Online pharmacies are witnessing increasing adoption.
- By Product: OTC expectorants constitute the major segment, reflecting ease of access and self-medication practices.
- Key Drivers: High prevalence of respiratory illnesses, rising healthcare expenditure, increasing awareness campaigns, and growing adoption of online pharmacies.
Expectorant Drugs Market Product Landscape
The expectorant drugs market offers a diverse range of products, including various formulations like syrups, tablets, capsules, and inhalers. Recent innovations focus on extended-release formulations for improved efficacy and reduced dosing frequency. These formulations often incorporate advanced drug delivery systems to enhance bioavailability and patient adherence. The market is witnessing a trend towards combination drugs, integrating expectorants with other medications to treat associated symptoms like pain and fever. Key performance metrics include efficacy, tolerability, patient compliance, and cost-effectiveness.
Key Drivers, Barriers & Challenges in Expectorant Drugs Market
Key Drivers: Rising prevalence of respiratory illnesses, increasing healthcare spending, technological advancements in drug delivery, and growing self-medication practices.
Key Challenges & Restraints: Stringent regulatory approvals, potential for adverse drug reactions, price competition from generics, and supply chain disruptions. The impact of these challenges is estimated to reduce market growth by approximately xx% annually.
Emerging Opportunities in Expectorant Drugs Market
Emerging opportunities lie in the development of novel formulations with enhanced efficacy and reduced side effects, expansion into untapped markets in developing countries, exploring innovative drug delivery methods, and personalized medicine approaches based on individual patient needs. Growing demand for natural and herbal expectorants also presents a significant opportunity.
Growth Accelerators in the Expectorant Drugs Market Industry
Strategic partnerships between pharmaceutical companies and technology providers will accelerate innovation in drug delivery and personalized medicine. Expansion into emerging markets through strategic alliances and investments will further stimulate market growth. Technological breakthroughs in drug discovery and formulation will lead to the introduction of more effective and safer expectorants.
Key Players Shaping the Expectorant Drugs Market Market
- AstraZeneca
- Reckitt Benckiser Group PLC
- Merck KGaA
- Sanofi
- Cipla Inc
- ARPIMED
- GSK plc
- Aurobindo Pharma
- Perrigo company plc
- Johnson & Johnson Private Limited
- Sun Pharmaceutical Industries Ltd
- Genexa Inc
Notable Milestones in Expectorant Drugs Market Sector
- October 2023: Marksans Pharma received FDA approval for Guaifenesin extended-release tablets. This approval expands treatment options and is expected to positively impact market growth.
- August 2022: Granules India Limited received approval for its OTC Guaifenesin and Pseudoephedrine Hydrochloride extended-release tablets. This broadened access to effective combination therapy.
In-Depth Expectorant Drugs Market Market Outlook
The expectorant drugs market is poised for sustained growth, driven by the aforementioned factors. Strategic investments in R&D, focusing on advanced formulations and personalized medicine, will be crucial for market expansion. The increasing prevalence of respiratory illnesses globally, coupled with the growing demand for convenient and effective treatment options, will further fuel market growth. Companies focusing on innovative product development and strategic partnerships will be best positioned to capitalize on emerging opportunities.
Expectorant Drugs Market Segmentation
-
1. Product
- 1.1. Over-the-Counter (OTC)
- 1.2. Prescription Drug
-
2. Dosage Form
- 2.1. Inhalant
- 2.2. Oral Solid
- 2.3. Oral Liquid
-
3. Distribution Channel
- 3.1. Hospital Pharmacies
- 3.2. Retail Stores
- 3.3. Drug Store
- 3.4. Online Pharmacies
Expectorant Drugs Market Segmentation By Geography
-
1. North America
- 1.1. United States
- 1.2. Canada
- 1.3. Mexico
-
2. Europe
- 2.1. Germany
- 2.2. United Kingdom
- 2.3. France
- 2.4. Italy
- 2.5. Spain
- 2.6. Rest of Europe
-
3. Asia Pacific
- 3.1. China
- 3.2. Japan
- 3.3. India
- 3.4. Australia
- 3.5. South Korea
- 3.6. Rest of Asia Pacific
-
4. Middle East and Africa
- 4.1. GCC
- 4.2. South Africa
- 4.3. Rest of Middle East and Africa
-
5. South America
- 5.1. Brazil
- 5.2. Argentina
- 5.3. Rest of South America
Expectorant Drugs Market REPORT HIGHLIGHTS
| Aspects | Details |
|---|---|
| Study Period | 2019-2033 |
| Base Year | 2024 |
| Estimated Year | 2025 |
| Forecast Period | 2025-2033 |
| Historical Period | 2019-2024 |
| Growth Rate | CAGR of 4.50% from 2019-2033 |
| Segmentation |
|
Table of Contents
- 1. Introduction
- 1.1. Research Scope
- 1.2. Market Segmentation
- 1.3. Research Methodology
- 1.4. Definitions and Assumptions
- 2. Executive Summary
- 2.1. Introduction
- 3. Market Dynamics
- 3.1. Introduction
- 3.2. Market Drivers
- 3.2.1. Increasing Prevalence of Respiratory Disease; Growing Demand for OTC Medications
- 3.3. Market Restrains
- 3.3.1. Governments and Regulatory Bodies Impose Strict Guidelines
- 3.4. Market Trends
- 3.4.1. Over-the-counter medications are increasingly popular among consumers due to their convenience and affordability
- 4. Market Factor Analysis
- 4.1. Porters Five Forces
- 4.2. Supply/Value Chain
- 4.3. PESTEL analysis
- 4.4. Market Entropy
- 4.5. Patent/Trademark Analysis
- 5. Global Expectorant Drugs Market Analysis, Insights and Forecast, 2019-2031
- 5.1. Market Analysis, Insights and Forecast - by Product
- 5.1.1. Over-the-Counter (OTC)
- 5.1.2. Prescription Drug
- 5.2. Market Analysis, Insights and Forecast - by Dosage Form
- 5.2.1. Inhalant
- 5.2.2. Oral Solid
- 5.2.3. Oral Liquid
- 5.3. Market Analysis, Insights and Forecast - by Distribution Channel
- 5.3.1. Hospital Pharmacies
- 5.3.2. Retail Stores
- 5.3.3. Drug Store
- 5.3.4. Online Pharmacies
- 5.4. Market Analysis, Insights and Forecast - by Region
- 5.4.1. North America
- 5.4.2. Europe
- 5.4.3. Asia Pacific
- 5.4.4. Middle East and Africa
- 5.4.5. South America
- 5.1. Market Analysis, Insights and Forecast - by Product
- 6. North America Expectorant Drugs Market Analysis, Insights and Forecast, 2019-2031
- 6.1. Market Analysis, Insights and Forecast - by Product
- 6.1.1. Over-the-Counter (OTC)
- 6.1.2. Prescription Drug
- 6.2. Market Analysis, Insights and Forecast - by Dosage Form
- 6.2.1. Inhalant
- 6.2.2. Oral Solid
- 6.2.3. Oral Liquid
- 6.3. Market Analysis, Insights and Forecast - by Distribution Channel
- 6.3.1. Hospital Pharmacies
- 6.3.2. Retail Stores
- 6.3.3. Drug Store
- 6.3.4. Online Pharmacies
- 6.1. Market Analysis, Insights and Forecast - by Product
- 7. Europe Expectorant Drugs Market Analysis, Insights and Forecast, 2019-2031
- 7.1. Market Analysis, Insights and Forecast - by Product
- 7.1.1. Over-the-Counter (OTC)
- 7.1.2. Prescription Drug
- 7.2. Market Analysis, Insights and Forecast - by Dosage Form
- 7.2.1. Inhalant
- 7.2.2. Oral Solid
- 7.2.3. Oral Liquid
- 7.3. Market Analysis, Insights and Forecast - by Distribution Channel
- 7.3.1. Hospital Pharmacies
- 7.3.2. Retail Stores
- 7.3.3. Drug Store
- 7.3.4. Online Pharmacies
- 7.1. Market Analysis, Insights and Forecast - by Product
- 8. Asia Pacific Expectorant Drugs Market Analysis, Insights and Forecast, 2019-2031
- 8.1. Market Analysis, Insights and Forecast - by Product
- 8.1.1. Over-the-Counter (OTC)
- 8.1.2. Prescription Drug
- 8.2. Market Analysis, Insights and Forecast - by Dosage Form
- 8.2.1. Inhalant
- 8.2.2. Oral Solid
- 8.2.3. Oral Liquid
- 8.3. Market Analysis, Insights and Forecast - by Distribution Channel
- 8.3.1. Hospital Pharmacies
- 8.3.2. Retail Stores
- 8.3.3. Drug Store
- 8.3.4. Online Pharmacies
- 8.1. Market Analysis, Insights and Forecast - by Product
- 9. Middle East and Africa Expectorant Drugs Market Analysis, Insights and Forecast, 2019-2031
- 9.1. Market Analysis, Insights and Forecast - by Product
- 9.1.1. Over-the-Counter (OTC)
- 9.1.2. Prescription Drug
- 9.2. Market Analysis, Insights and Forecast - by Dosage Form
- 9.2.1. Inhalant
- 9.2.2. Oral Solid
- 9.2.3. Oral Liquid
- 9.3. Market Analysis, Insights and Forecast - by Distribution Channel
- 9.3.1. Hospital Pharmacies
- 9.3.2. Retail Stores
- 9.3.3. Drug Store
- 9.3.4. Online Pharmacies
- 9.1. Market Analysis, Insights and Forecast - by Product
- 10. South America Expectorant Drugs Market Analysis, Insights and Forecast, 2019-2031
- 10.1. Market Analysis, Insights and Forecast - by Product
- 10.1.1. Over-the-Counter (OTC)
- 10.1.2. Prescription Drug
- 10.2. Market Analysis, Insights and Forecast - by Dosage Form
- 10.2.1. Inhalant
- 10.2.2. Oral Solid
- 10.2.3. Oral Liquid
- 10.3. Market Analysis, Insights and Forecast - by Distribution Channel
- 10.3.1. Hospital Pharmacies
- 10.3.2. Retail Stores
- 10.3.3. Drug Store
- 10.3.4. Online Pharmacies
- 10.1. Market Analysis, Insights and Forecast - by Product
- 11. North America Expectorant Drugs Market Analysis, Insights and Forecast, 2019-2031
- 11.1. Market Analysis, Insights and Forecast - By Country/Sub-region
- 11.1.1 United States
- 11.1.2 Canada
- 11.1.3 Mexico
- 12. Europe Expectorant Drugs Market Analysis, Insights and Forecast, 2019-2031
- 12.1. Market Analysis, Insights and Forecast - By Country/Sub-region
- 12.1.1 Germany
- 12.1.2 United Kingdom
- 12.1.3 France
- 12.1.4 Italy
- 12.1.5 Spain
- 12.1.6 Rest of Europe
- 13. Asia Pacific Expectorant Drugs Market Analysis, Insights and Forecast, 2019-2031
- 13.1. Market Analysis, Insights and Forecast - By Country/Sub-region
- 13.1.1 China
- 13.1.2 Japan
- 13.1.3 India
- 13.1.4 Australia
- 13.1.5 South Korea
- 13.1.6 Rest of Asia Pacific
- 14. Middle East and Africa Expectorant Drugs Market Analysis, Insights and Forecast, 2019-2031
- 14.1. Market Analysis, Insights and Forecast - By Country/Sub-region
- 14.1.1 GCC
- 14.1.2 South Africa
- 14.1.3 Rest of Middle East and Africa
- 15. South America Expectorant Drugs Market Analysis, Insights and Forecast, 2019-2031
- 15.1. Market Analysis, Insights and Forecast - By Country/Sub-region
- 15.1.1 Brazil
- 15.1.2 Argentina
- 15.1.3 Rest of South America
- 16. Competitive Analysis
- 16.1. Global Market Share Analysis 2024
- 16.2. Company Profiles
- 16.2.1 AstraZeneca
- 16.2.1.1. Overview
- 16.2.1.2. Products
- 16.2.1.3. SWOT Analysis
- 16.2.1.4. Recent Developments
- 16.2.1.5. Financials (Based on Availability)
- 16.2.2 Reckitt Benckiser Group PLC
- 16.2.2.1. Overview
- 16.2.2.2. Products
- 16.2.2.3. SWOT Analysis
- 16.2.2.4. Recent Developments
- 16.2.2.5. Financials (Based on Availability)
- 16.2.3 Merck KGaA
- 16.2.3.1. Overview
- 16.2.3.2. Products
- 16.2.3.3. SWOT Analysis
- 16.2.3.4. Recent Developments
- 16.2.3.5. Financials (Based on Availability)
- 16.2.4 Sanofi
- 16.2.4.1. Overview
- 16.2.4.2. Products
- 16.2.4.3. SWOT Analysis
- 16.2.4.4. Recent Developments
- 16.2.4.5. Financials (Based on Availability)
- 16.2.5 Cipla Inc
- 16.2.5.1. Overview
- 16.2.5.2. Products
- 16.2.5.3. SWOT Analysis
- 16.2.5.4. Recent Developments
- 16.2.5.5. Financials (Based on Availability)
- 16.2.6 ARPIMED
- 16.2.6.1. Overview
- 16.2.6.2. Products
- 16.2.6.3. SWOT Analysis
- 16.2.6.4. Recent Developments
- 16.2.6.5. Financials (Based on Availability)
- 16.2.7 GSK plc
- 16.2.7.1. Overview
- 16.2.7.2. Products
- 16.2.7.3. SWOT Analysis
- 16.2.7.4. Recent Developments
- 16.2.7.5. Financials (Based on Availability)
- 16.2.8 Aurobindo Pharma
- 16.2.8.1. Overview
- 16.2.8.2. Products
- 16.2.8.3. SWOT Analysis
- 16.2.8.4. Recent Developments
- 16.2.8.5. Financials (Based on Availability)
- 16.2.9 Perrigo company plc
- 16.2.9.1. Overview
- 16.2.9.2. Products
- 16.2.9.3. SWOT Analysis
- 16.2.9.4. Recent Developments
- 16.2.9.5. Financials (Based on Availability)
- 16.2.10 Johnson & Johnson Private Limited
- 16.2.10.1. Overview
- 16.2.10.2. Products
- 16.2.10.3. SWOT Analysis
- 16.2.10.4. Recent Developments
- 16.2.10.5. Financials (Based on Availability)
- 16.2.11 Sun Pharmaceutical Industries Ltd
- 16.2.11.1. Overview
- 16.2.11.2. Products
- 16.2.11.3. SWOT Analysis
- 16.2.11.4. Recent Developments
- 16.2.11.5. Financials (Based on Availability)
- 16.2.12 Genexa Inc
- 16.2.12.1. Overview
- 16.2.12.2. Products
- 16.2.12.3. SWOT Analysis
- 16.2.12.4. Recent Developments
- 16.2.12.5. Financials (Based on Availability)
- 16.2.1 AstraZeneca
List of Figures
- Figure 1: Global Expectorant Drugs Market Revenue Breakdown (Million, %) by Region 2024 & 2032
- Figure 2: Global Expectorant Drugs Market Volume Breakdown (K Unit, %) by Region 2024 & 2032
- Figure 3: North America Expectorant Drugs Market Revenue (Million), by Country 2024 & 2032
- Figure 4: North America Expectorant Drugs Market Volume (K Unit), by Country 2024 & 2032
- Figure 5: North America Expectorant Drugs Market Revenue Share (%), by Country 2024 & 2032
- Figure 6: North America Expectorant Drugs Market Volume Share (%), by Country 2024 & 2032
- Figure 7: Europe Expectorant Drugs Market Revenue (Million), by Country 2024 & 2032
- Figure 8: Europe Expectorant Drugs Market Volume (K Unit), by Country 2024 & 2032
- Figure 9: Europe Expectorant Drugs Market Revenue Share (%), by Country 2024 & 2032
- Figure 10: Europe Expectorant Drugs Market Volume Share (%), by Country 2024 & 2032
- Figure 11: Asia Pacific Expectorant Drugs Market Revenue (Million), by Country 2024 & 2032
- Figure 12: Asia Pacific Expectorant Drugs Market Volume (K Unit), by Country 2024 & 2032
- Figure 13: Asia Pacific Expectorant Drugs Market Revenue Share (%), by Country 2024 & 2032
- Figure 14: Asia Pacific Expectorant Drugs Market Volume Share (%), by Country 2024 & 2032
- Figure 15: Middle East and Africa Expectorant Drugs Market Revenue (Million), by Country 2024 & 2032
- Figure 16: Middle East and Africa Expectorant Drugs Market Volume (K Unit), by Country 2024 & 2032
- Figure 17: Middle East and Africa Expectorant Drugs Market Revenue Share (%), by Country 2024 & 2032
- Figure 18: Middle East and Africa Expectorant Drugs Market Volume Share (%), by Country 2024 & 2032
- Figure 19: South America Expectorant Drugs Market Revenue (Million), by Country 2024 & 2032
- Figure 20: South America Expectorant Drugs Market Volume (K Unit), by Country 2024 & 2032
- Figure 21: South America Expectorant Drugs Market Revenue Share (%), by Country 2024 & 2032
- Figure 22: South America Expectorant Drugs Market Volume Share (%), by Country 2024 & 2032
- Figure 23: North America Expectorant Drugs Market Revenue (Million), by Product 2024 & 2032
- Figure 24: North America Expectorant Drugs Market Volume (K Unit), by Product 2024 & 2032
- Figure 25: North America Expectorant Drugs Market Revenue Share (%), by Product 2024 & 2032
- Figure 26: North America Expectorant Drugs Market Volume Share (%), by Product 2024 & 2032
- Figure 27: North America Expectorant Drugs Market Revenue (Million), by Dosage Form 2024 & 2032
- Figure 28: North America Expectorant Drugs Market Volume (K Unit), by Dosage Form 2024 & 2032
- Figure 29: North America Expectorant Drugs Market Revenue Share (%), by Dosage Form 2024 & 2032
- Figure 30: North America Expectorant Drugs Market Volume Share (%), by Dosage Form 2024 & 2032
- Figure 31: North America Expectorant Drugs Market Revenue (Million), by Distribution Channel 2024 & 2032
- Figure 32: North America Expectorant Drugs Market Volume (K Unit), by Distribution Channel 2024 & 2032
- Figure 33: North America Expectorant Drugs Market Revenue Share (%), by Distribution Channel 2024 & 2032
- Figure 34: North America Expectorant Drugs Market Volume Share (%), by Distribution Channel 2024 & 2032
- Figure 35: North America Expectorant Drugs Market Revenue (Million), by Country 2024 & 2032
- Figure 36: North America Expectorant Drugs Market Volume (K Unit), by Country 2024 & 2032
- Figure 37: North America Expectorant Drugs Market Revenue Share (%), by Country 2024 & 2032
- Figure 38: North America Expectorant Drugs Market Volume Share (%), by Country 2024 & 2032
- Figure 39: Europe Expectorant Drugs Market Revenue (Million), by Product 2024 & 2032
- Figure 40: Europe Expectorant Drugs Market Volume (K Unit), by Product 2024 & 2032
- Figure 41: Europe Expectorant Drugs Market Revenue Share (%), by Product 2024 & 2032
- Figure 42: Europe Expectorant Drugs Market Volume Share (%), by Product 2024 & 2032
- Figure 43: Europe Expectorant Drugs Market Revenue (Million), by Dosage Form 2024 & 2032
- Figure 44: Europe Expectorant Drugs Market Volume (K Unit), by Dosage Form 2024 & 2032
- Figure 45: Europe Expectorant Drugs Market Revenue Share (%), by Dosage Form 2024 & 2032
- Figure 46: Europe Expectorant Drugs Market Volume Share (%), by Dosage Form 2024 & 2032
- Figure 47: Europe Expectorant Drugs Market Revenue (Million), by Distribution Channel 2024 & 2032
- Figure 48: Europe Expectorant Drugs Market Volume (K Unit), by Distribution Channel 2024 & 2032
- Figure 49: Europe Expectorant Drugs Market Revenue Share (%), by Distribution Channel 2024 & 2032
- Figure 50: Europe Expectorant Drugs Market Volume Share (%), by Distribution Channel 2024 & 2032
- Figure 51: Europe Expectorant Drugs Market Revenue (Million), by Country 2024 & 2032
- Figure 52: Europe Expectorant Drugs Market Volume (K Unit), by Country 2024 & 2032
- Figure 53: Europe Expectorant Drugs Market Revenue Share (%), by Country 2024 & 2032
- Figure 54: Europe Expectorant Drugs Market Volume Share (%), by Country 2024 & 2032
- Figure 55: Asia Pacific Expectorant Drugs Market Revenue (Million), by Product 2024 & 2032
- Figure 56: Asia Pacific Expectorant Drugs Market Volume (K Unit), by Product 2024 & 2032
- Figure 57: Asia Pacific Expectorant Drugs Market Revenue Share (%), by Product 2024 & 2032
- Figure 58: Asia Pacific Expectorant Drugs Market Volume Share (%), by Product 2024 & 2032
- Figure 59: Asia Pacific Expectorant Drugs Market Revenue (Million), by Dosage Form 2024 & 2032
- Figure 60: Asia Pacific Expectorant Drugs Market Volume (K Unit), by Dosage Form 2024 & 2032
- Figure 61: Asia Pacific Expectorant Drugs Market Revenue Share (%), by Dosage Form 2024 & 2032
- Figure 62: Asia Pacific Expectorant Drugs Market Volume Share (%), by Dosage Form 2024 & 2032
- Figure 63: Asia Pacific Expectorant Drugs Market Revenue (Million), by Distribution Channel 2024 & 2032
- Figure 64: Asia Pacific Expectorant Drugs Market Volume (K Unit), by Distribution Channel 2024 & 2032
- Figure 65: Asia Pacific Expectorant Drugs Market Revenue Share (%), by Distribution Channel 2024 & 2032
- Figure 66: Asia Pacific Expectorant Drugs Market Volume Share (%), by Distribution Channel 2024 & 2032
- Figure 67: Asia Pacific Expectorant Drugs Market Revenue (Million), by Country 2024 & 2032
- Figure 68: Asia Pacific Expectorant Drugs Market Volume (K Unit), by Country 2024 & 2032
- Figure 69: Asia Pacific Expectorant Drugs Market Revenue Share (%), by Country 2024 & 2032
- Figure 70: Asia Pacific Expectorant Drugs Market Volume Share (%), by Country 2024 & 2032
- Figure 71: Middle East and Africa Expectorant Drugs Market Revenue (Million), by Product 2024 & 2032
- Figure 72: Middle East and Africa Expectorant Drugs Market Volume (K Unit), by Product 2024 & 2032
- Figure 73: Middle East and Africa Expectorant Drugs Market Revenue Share (%), by Product 2024 & 2032
- Figure 74: Middle East and Africa Expectorant Drugs Market Volume Share (%), by Product 2024 & 2032
- Figure 75: Middle East and Africa Expectorant Drugs Market Revenue (Million), by Dosage Form 2024 & 2032
- Figure 76: Middle East and Africa Expectorant Drugs Market Volume (K Unit), by Dosage Form 2024 & 2032
- Figure 77: Middle East and Africa Expectorant Drugs Market Revenue Share (%), by Dosage Form 2024 & 2032
- Figure 78: Middle East and Africa Expectorant Drugs Market Volume Share (%), by Dosage Form 2024 & 2032
- Figure 79: Middle East and Africa Expectorant Drugs Market Revenue (Million), by Distribution Channel 2024 & 2032
- Figure 80: Middle East and Africa Expectorant Drugs Market Volume (K Unit), by Distribution Channel 2024 & 2032
- Figure 81: Middle East and Africa Expectorant Drugs Market Revenue Share (%), by Distribution Channel 2024 & 2032
- Figure 82: Middle East and Africa Expectorant Drugs Market Volume Share (%), by Distribution Channel 2024 & 2032
- Figure 83: Middle East and Africa Expectorant Drugs Market Revenue (Million), by Country 2024 & 2032
- Figure 84: Middle East and Africa Expectorant Drugs Market Volume (K Unit), by Country 2024 & 2032
- Figure 85: Middle East and Africa Expectorant Drugs Market Revenue Share (%), by Country 2024 & 2032
- Figure 86: Middle East and Africa Expectorant Drugs Market Volume Share (%), by Country 2024 & 2032
- Figure 87: South America Expectorant Drugs Market Revenue (Million), by Product 2024 & 2032
- Figure 88: South America Expectorant Drugs Market Volume (K Unit), by Product 2024 & 2032
- Figure 89: South America Expectorant Drugs Market Revenue Share (%), by Product 2024 & 2032
- Figure 90: South America Expectorant Drugs Market Volume Share (%), by Product 2024 & 2032
- Figure 91: South America Expectorant Drugs Market Revenue (Million), by Dosage Form 2024 & 2032
- Figure 92: South America Expectorant Drugs Market Volume (K Unit), by Dosage Form 2024 & 2032
- Figure 93: South America Expectorant Drugs Market Revenue Share (%), by Dosage Form 2024 & 2032
- Figure 94: South America Expectorant Drugs Market Volume Share (%), by Dosage Form 2024 & 2032
- Figure 95: South America Expectorant Drugs Market Revenue (Million), by Distribution Channel 2024 & 2032
- Figure 96: South America Expectorant Drugs Market Volume (K Unit), by Distribution Channel 2024 & 2032
- Figure 97: South America Expectorant Drugs Market Revenue Share (%), by Distribution Channel 2024 & 2032
- Figure 98: South America Expectorant Drugs Market Volume Share (%), by Distribution Channel 2024 & 2032
- Figure 99: South America Expectorant Drugs Market Revenue (Million), by Country 2024 & 2032
- Figure 100: South America Expectorant Drugs Market Volume (K Unit), by Country 2024 & 2032
- Figure 101: South America Expectorant Drugs Market Revenue Share (%), by Country 2024 & 2032
- Figure 102: South America Expectorant Drugs Market Volume Share (%), by Country 2024 & 2032
List of Tables
- Table 1: Global Expectorant Drugs Market Revenue Million Forecast, by Region 2019 & 2032
- Table 2: Global Expectorant Drugs Market Volume K Unit Forecast, by Region 2019 & 2032
- Table 3: Global Expectorant Drugs Market Revenue Million Forecast, by Product 2019 & 2032
- Table 4: Global Expectorant Drugs Market Volume K Unit Forecast, by Product 2019 & 2032
- Table 5: Global Expectorant Drugs Market Revenue Million Forecast, by Dosage Form 2019 & 2032
- Table 6: Global Expectorant Drugs Market Volume K Unit Forecast, by Dosage Form 2019 & 2032
- Table 7: Global Expectorant Drugs Market Revenue Million Forecast, by Distribution Channel 2019 & 2032
- Table 8: Global Expectorant Drugs Market Volume K Unit Forecast, by Distribution Channel 2019 & 2032
- Table 9: Global Expectorant Drugs Market Revenue Million Forecast, by Region 2019 & 2032
- Table 10: Global Expectorant Drugs Market Volume K Unit Forecast, by Region 2019 & 2032
- Table 11: Global Expectorant Drugs Market Revenue Million Forecast, by Country 2019 & 2032
- Table 12: Global Expectorant Drugs Market Volume K Unit Forecast, by Country 2019 & 2032
- Table 13: United States Expectorant Drugs Market Revenue (Million) Forecast, by Application 2019 & 2032
- Table 14: United States Expectorant Drugs Market Volume (K Unit) Forecast, by Application 2019 & 2032
- Table 15: Canada Expectorant Drugs Market Revenue (Million) Forecast, by Application 2019 & 2032
- Table 16: Canada Expectorant Drugs Market Volume (K Unit) Forecast, by Application 2019 & 2032
- Table 17: Mexico Expectorant Drugs Market Revenue (Million) Forecast, by Application 2019 & 2032
- Table 18: Mexico Expectorant Drugs Market Volume (K Unit) Forecast, by Application 2019 & 2032
- Table 19: Global Expectorant Drugs Market Revenue Million Forecast, by Country 2019 & 2032
- Table 20: Global Expectorant Drugs Market Volume K Unit Forecast, by Country 2019 & 2032
- Table 21: Germany Expectorant Drugs Market Revenue (Million) Forecast, by Application 2019 & 2032
- Table 22: Germany Expectorant Drugs Market Volume (K Unit) Forecast, by Application 2019 & 2032
- Table 23: United Kingdom Expectorant Drugs Market Revenue (Million) Forecast, by Application 2019 & 2032
- Table 24: United Kingdom Expectorant Drugs Market Volume (K Unit) Forecast, by Application 2019 & 2032
- Table 25: France Expectorant Drugs Market Revenue (Million) Forecast, by Application 2019 & 2032
- Table 26: France Expectorant Drugs Market Volume (K Unit) Forecast, by Application 2019 & 2032
- Table 27: Italy Expectorant Drugs Market Revenue (Million) Forecast, by Application 2019 & 2032
- Table 28: Italy Expectorant Drugs Market Volume (K Unit) Forecast, by Application 2019 & 2032
- Table 29: Spain Expectorant Drugs Market Revenue (Million) Forecast, by Application 2019 & 2032
- Table 30: Spain Expectorant Drugs Market Volume (K Unit) Forecast, by Application 2019 & 2032
- Table 31: Rest of Europe Expectorant Drugs Market Revenue (Million) Forecast, by Application 2019 & 2032
- Table 32: Rest of Europe Expectorant Drugs Market Volume (K Unit) Forecast, by Application 2019 & 2032
- Table 33: Global Expectorant Drugs Market Revenue Million Forecast, by Country 2019 & 2032
- Table 34: Global Expectorant Drugs Market Volume K Unit Forecast, by Country 2019 & 2032
- Table 35: China Expectorant Drugs Market Revenue (Million) Forecast, by Application 2019 & 2032
- Table 36: China Expectorant Drugs Market Volume (K Unit) Forecast, by Application 2019 & 2032
- Table 37: Japan Expectorant Drugs Market Revenue (Million) Forecast, by Application 2019 & 2032
- Table 38: Japan Expectorant Drugs Market Volume (K Unit) Forecast, by Application 2019 & 2032
- Table 39: India Expectorant Drugs Market Revenue (Million) Forecast, by Application 2019 & 2032
- Table 40: India Expectorant Drugs Market Volume (K Unit) Forecast, by Application 2019 & 2032
- Table 41: Australia Expectorant Drugs Market Revenue (Million) Forecast, by Application 2019 & 2032
- Table 42: Australia Expectorant Drugs Market Volume (K Unit) Forecast, by Application 2019 & 2032
- Table 43: South Korea Expectorant Drugs Market Revenue (Million) Forecast, by Application 2019 & 2032
- Table 44: South Korea Expectorant Drugs Market Volume (K Unit) Forecast, by Application 2019 & 2032
- Table 45: Rest of Asia Pacific Expectorant Drugs Market Revenue (Million) Forecast, by Application 2019 & 2032
- Table 46: Rest of Asia Pacific Expectorant Drugs Market Volume (K Unit) Forecast, by Application 2019 & 2032
- Table 47: Global Expectorant Drugs Market Revenue Million Forecast, by Country 2019 & 2032
- Table 48: Global Expectorant Drugs Market Volume K Unit Forecast, by Country 2019 & 2032
- Table 49: GCC Expectorant Drugs Market Revenue (Million) Forecast, by Application 2019 & 2032
- Table 50: GCC Expectorant Drugs Market Volume (K Unit) Forecast, by Application 2019 & 2032
- Table 51: South Africa Expectorant Drugs Market Revenue (Million) Forecast, by Application 2019 & 2032
- Table 52: South Africa Expectorant Drugs Market Volume (K Unit) Forecast, by Application 2019 & 2032
- Table 53: Rest of Middle East and Africa Expectorant Drugs Market Revenue (Million) Forecast, by Application 2019 & 2032
- Table 54: Rest of Middle East and Africa Expectorant Drugs Market Volume (K Unit) Forecast, by Application 2019 & 2032
- Table 55: Global Expectorant Drugs Market Revenue Million Forecast, by Country 2019 & 2032
- Table 56: Global Expectorant Drugs Market Volume K Unit Forecast, by Country 2019 & 2032
- Table 57: Brazil Expectorant Drugs Market Revenue (Million) Forecast, by Application 2019 & 2032
- Table 58: Brazil Expectorant Drugs Market Volume (K Unit) Forecast, by Application 2019 & 2032
- Table 59: Argentina Expectorant Drugs Market Revenue (Million) Forecast, by Application 2019 & 2032
- Table 60: Argentina Expectorant Drugs Market Volume (K Unit) Forecast, by Application 2019 & 2032
- Table 61: Rest of South America Expectorant Drugs Market Revenue (Million) Forecast, by Application 2019 & 2032
- Table 62: Rest of South America Expectorant Drugs Market Volume (K Unit) Forecast, by Application 2019 & 2032
- Table 63: Global Expectorant Drugs Market Revenue Million Forecast, by Product 2019 & 2032
- Table 64: Global Expectorant Drugs Market Volume K Unit Forecast, by Product 2019 & 2032
- Table 65: Global Expectorant Drugs Market Revenue Million Forecast, by Dosage Form 2019 & 2032
- Table 66: Global Expectorant Drugs Market Volume K Unit Forecast, by Dosage Form 2019 & 2032
- Table 67: Global Expectorant Drugs Market Revenue Million Forecast, by Distribution Channel 2019 & 2032
- Table 68: Global Expectorant Drugs Market Volume K Unit Forecast, by Distribution Channel 2019 & 2032
- Table 69: Global Expectorant Drugs Market Revenue Million Forecast, by Country 2019 & 2032
- Table 70: Global Expectorant Drugs Market Volume K Unit Forecast, by Country 2019 & 2032
- Table 71: United States Expectorant Drugs Market Revenue (Million) Forecast, by Application 2019 & 2032
- Table 72: United States Expectorant Drugs Market Volume (K Unit) Forecast, by Application 2019 & 2032
- Table 73: Canada Expectorant Drugs Market Revenue (Million) Forecast, by Application 2019 & 2032
- Table 74: Canada Expectorant Drugs Market Volume (K Unit) Forecast, by Application 2019 & 2032
- Table 75: Mexico Expectorant Drugs Market Revenue (Million) Forecast, by Application 2019 & 2032
- Table 76: Mexico Expectorant Drugs Market Volume (K Unit) Forecast, by Application 2019 & 2032
- Table 77: Global Expectorant Drugs Market Revenue Million Forecast, by Product 2019 & 2032
- Table 78: Global Expectorant Drugs Market Volume K Unit Forecast, by Product 2019 & 2032
- Table 79: Global Expectorant Drugs Market Revenue Million Forecast, by Dosage Form 2019 & 2032
- Table 80: Global Expectorant Drugs Market Volume K Unit Forecast, by Dosage Form 2019 & 2032
- Table 81: Global Expectorant Drugs Market Revenue Million Forecast, by Distribution Channel 2019 & 2032
- Table 82: Global Expectorant Drugs Market Volume K Unit Forecast, by Distribution Channel 2019 & 2032
- Table 83: Global Expectorant Drugs Market Revenue Million Forecast, by Country 2019 & 2032
- Table 84: Global Expectorant Drugs Market Volume K Unit Forecast, by Country 2019 & 2032
- Table 85: Germany Expectorant Drugs Market Revenue (Million) Forecast, by Application 2019 & 2032
- Table 86: Germany Expectorant Drugs Market Volume (K Unit) Forecast, by Application 2019 & 2032
- Table 87: United Kingdom Expectorant Drugs Market Revenue (Million) Forecast, by Application 2019 & 2032
- Table 88: United Kingdom Expectorant Drugs Market Volume (K Unit) Forecast, by Application 2019 & 2032
- Table 89: France Expectorant Drugs Market Revenue (Million) Forecast, by Application 2019 & 2032
- Table 90: France Expectorant Drugs Market Volume (K Unit) Forecast, by Application 2019 & 2032
- Table 91: Italy Expectorant Drugs Market Revenue (Million) Forecast, by Application 2019 & 2032
- Table 92: Italy Expectorant Drugs Market Volume (K Unit) Forecast, by Application 2019 & 2032
- Table 93: Spain Expectorant Drugs Market Revenue (Million) Forecast, by Application 2019 & 2032
- Table 94: Spain Expectorant Drugs Market Volume (K Unit) Forecast, by Application 2019 & 2032
- Table 95: Rest of Europe Expectorant Drugs Market Revenue (Million) Forecast, by Application 2019 & 2032
- Table 96: Rest of Europe Expectorant Drugs Market Volume (K Unit) Forecast, by Application 2019 & 2032
- Table 97: Global Expectorant Drugs Market Revenue Million Forecast, by Product 2019 & 2032
- Table 98: Global Expectorant Drugs Market Volume K Unit Forecast, by Product 2019 & 2032
- Table 99: Global Expectorant Drugs Market Revenue Million Forecast, by Dosage Form 2019 & 2032
- Table 100: Global Expectorant Drugs Market Volume K Unit Forecast, by Dosage Form 2019 & 2032
- Table 101: Global Expectorant Drugs Market Revenue Million Forecast, by Distribution Channel 2019 & 2032
- Table 102: Global Expectorant Drugs Market Volume K Unit Forecast, by Distribution Channel 2019 & 2032
- Table 103: Global Expectorant Drugs Market Revenue Million Forecast, by Country 2019 & 2032
- Table 104: Global Expectorant Drugs Market Volume K Unit Forecast, by Country 2019 & 2032
- Table 105: China Expectorant Drugs Market Revenue (Million) Forecast, by Application 2019 & 2032
- Table 106: China Expectorant Drugs Market Volume (K Unit) Forecast, by Application 2019 & 2032
- Table 107: Japan Expectorant Drugs Market Revenue (Million) Forecast, by Application 2019 & 2032
- Table 108: Japan Expectorant Drugs Market Volume (K Unit) Forecast, by Application 2019 & 2032
- Table 109: India Expectorant Drugs Market Revenue (Million) Forecast, by Application 2019 & 2032
- Table 110: India Expectorant Drugs Market Volume (K Unit) Forecast, by Application 2019 & 2032
- Table 111: Australia Expectorant Drugs Market Revenue (Million) Forecast, by Application 2019 & 2032
- Table 112: Australia Expectorant Drugs Market Volume (K Unit) Forecast, by Application 2019 & 2032
- Table 113: South Korea Expectorant Drugs Market Revenue (Million) Forecast, by Application 2019 & 2032
- Table 114: South Korea Expectorant Drugs Market Volume (K Unit) Forecast, by Application 2019 & 2032
- Table 115: Rest of Asia Pacific Expectorant Drugs Market Revenue (Million) Forecast, by Application 2019 & 2032
- Table 116: Rest of Asia Pacific Expectorant Drugs Market Volume (K Unit) Forecast, by Application 2019 & 2032
- Table 117: Global Expectorant Drugs Market Revenue Million Forecast, by Product 2019 & 2032
- Table 118: Global Expectorant Drugs Market Volume K Unit Forecast, by Product 2019 & 2032
- Table 119: Global Expectorant Drugs Market Revenue Million Forecast, by Dosage Form 2019 & 2032
- Table 120: Global Expectorant Drugs Market Volume K Unit Forecast, by Dosage Form 2019 & 2032
- Table 121: Global Expectorant Drugs Market Revenue Million Forecast, by Distribution Channel 2019 & 2032
- Table 122: Global Expectorant Drugs Market Volume K Unit Forecast, by Distribution Channel 2019 & 2032
- Table 123: Global Expectorant Drugs Market Revenue Million Forecast, by Country 2019 & 2032
- Table 124: Global Expectorant Drugs Market Volume K Unit Forecast, by Country 2019 & 2032
- Table 125: GCC Expectorant Drugs Market Revenue (Million) Forecast, by Application 2019 & 2032
- Table 126: GCC Expectorant Drugs Market Volume (K Unit) Forecast, by Application 2019 & 2032
- Table 127: South Africa Expectorant Drugs Market Revenue (Million) Forecast, by Application 2019 & 2032
- Table 128: South Africa Expectorant Drugs Market Volume (K Unit) Forecast, by Application 2019 & 2032
- Table 129: Rest of Middle East and Africa Expectorant Drugs Market Revenue (Million) Forecast, by Application 2019 & 2032
- Table 130: Rest of Middle East and Africa Expectorant Drugs Market Volume (K Unit) Forecast, by Application 2019 & 2032
- Table 131: Global Expectorant Drugs Market Revenue Million Forecast, by Product 2019 & 2032
- Table 132: Global Expectorant Drugs Market Volume K Unit Forecast, by Product 2019 & 2032
- Table 133: Global Expectorant Drugs Market Revenue Million Forecast, by Dosage Form 2019 & 2032
- Table 134: Global Expectorant Drugs Market Volume K Unit Forecast, by Dosage Form 2019 & 2032
- Table 135: Global Expectorant Drugs Market Revenue Million Forecast, by Distribution Channel 2019 & 2032
- Table 136: Global Expectorant Drugs Market Volume K Unit Forecast, by Distribution Channel 2019 & 2032
- Table 137: Global Expectorant Drugs Market Revenue Million Forecast, by Country 2019 & 2032
- Table 138: Global Expectorant Drugs Market Volume K Unit Forecast, by Country 2019 & 2032
- Table 139: Brazil Expectorant Drugs Market Revenue (Million) Forecast, by Application 2019 & 2032
- Table 140: Brazil Expectorant Drugs Market Volume (K Unit) Forecast, by Application 2019 & 2032
- Table 141: Argentina Expectorant Drugs Market Revenue (Million) Forecast, by Application 2019 & 2032
- Table 142: Argentina Expectorant Drugs Market Volume (K Unit) Forecast, by Application 2019 & 2032
- Table 143: Rest of South America Expectorant Drugs Market Revenue (Million) Forecast, by Application 2019 & 2032
- Table 144: Rest of South America Expectorant Drugs Market Volume (K Unit) Forecast, by Application 2019 & 2032
Frequently Asked Questions
1. What is the projected Compound Annual Growth Rate (CAGR) of the Expectorant Drugs Market?
The projected CAGR is approximately 4.50%.
2. Which companies are prominent players in the Expectorant Drugs Market?
Key companies in the market include AstraZeneca, Reckitt Benckiser Group PLC, Merck KGaA, Sanofi, Cipla Inc, ARPIMED, GSK plc, Aurobindo Pharma, Perrigo company plc, Johnson & Johnson Private Limited, Sun Pharmaceutical Industries Ltd, Genexa Inc.
3. What are the main segments of the Expectorant Drugs Market?
The market segments include Product, Dosage Form, Distribution Channel.
4. Can you provide details about the market size?
The market size is estimated to be USD 100 Million as of 2022.
5. What are some drivers contributing to market growth?
Increasing Prevalence of Respiratory Disease; Growing Demand for OTC Medications.
6. What are the notable trends driving market growth?
Over-the-counter medications are increasingly popular among consumers due to their convenience and affordability.
7. Are there any restraints impacting market growth?
Governments and Regulatory Bodies Impose Strict Guidelines.
8. Can you provide examples of recent developments in the market?
October 2023: Marksans Pharma received FDA approval for Guaifenesin extended-release tablets for the treatment of cough and chest congestion in adults and children 12 years of age and older.
9. What pricing options are available for accessing the report?
Pricing options include single-user, multi-user, and enterprise licenses priced at USD 4750, USD 5250, and USD 8750 respectively.
10. Is the market size provided in terms of value or volume?
The market size is provided in terms of value, measured in Million and volume, measured in K Unit.
11. Are there any specific market keywords associated with the report?
Yes, the market keyword associated with the report is "Expectorant Drugs Market," which aids in identifying and referencing the specific market segment covered.
12. How do I determine which pricing option suits my needs best?
The pricing options vary based on user requirements and access needs. Individual users may opt for single-user licenses, while businesses requiring broader access may choose multi-user or enterprise licenses for cost-effective access to the report.
13. Are there any additional resources or data provided in the Expectorant Drugs Market report?
While the report offers comprehensive insights, it's advisable to review the specific contents or supplementary materials provided to ascertain if additional resources or data are available.
14. How can I stay updated on further developments or reports in the Expectorant Drugs Market?
To stay informed about further developments, trends, and reports in the Expectorant Drugs Market, consider subscribing to industry newsletters, following relevant companies and organizations, or regularly checking reputable industry news sources and publications.
Methodology
Step 1 - Identification of Relevant Samples Size from Population Database


Step 2 - Approaches for Defining Global Market Size (Value, Volume* & Price*)

Note*: In applicable scenarios
Step 3 - Data Sources
Primary Research
- Web Analytics
- Survey Reports
- Research Institute
- Latest Research Reports
- Opinion Leaders
Secondary Research
- Annual Reports
- White Paper
- Latest Press Release
- Industry Association
- Paid Database
- Investor Presentations

Step 4 - Data Triangulation
Involves using different sources of information in order to increase the validity of a study
These sources are likely to be stakeholders in a program - participants, other researchers, program staff, other community members, and so on.
Then we put all data in single framework & apply various statistical tools to find out the dynamic on the market.
During the analysis stage, feedback from the stakeholder groups would be compared to determine areas of agreement as well as areas of divergence


