

Key Insights
The European Union Omega-3 market is poised for substantial growth, projected to achieve a Compound Annual Growth Rate (CAGR) of 7% from 2025 to 2033. This expansion is driven by heightened consumer awareness of Omega-3's health benefits, including cardiovascular support, cognitive function enhancement, and anti-inflammatory properties. The rising incidence of chronic diseases across Europe further elevates demand for nutritional supplements like Omega-3s. Increased integration into functional foods and dietary supplements, alongside broader distribution via grocery retailers, pharmacies, health stores, and online channels, significantly fuels market advancement. The EU Omega-3 market size is estimated at 3.59 billion in the base year of 2025, reflecting the robust expansion within the health and wellness sector.
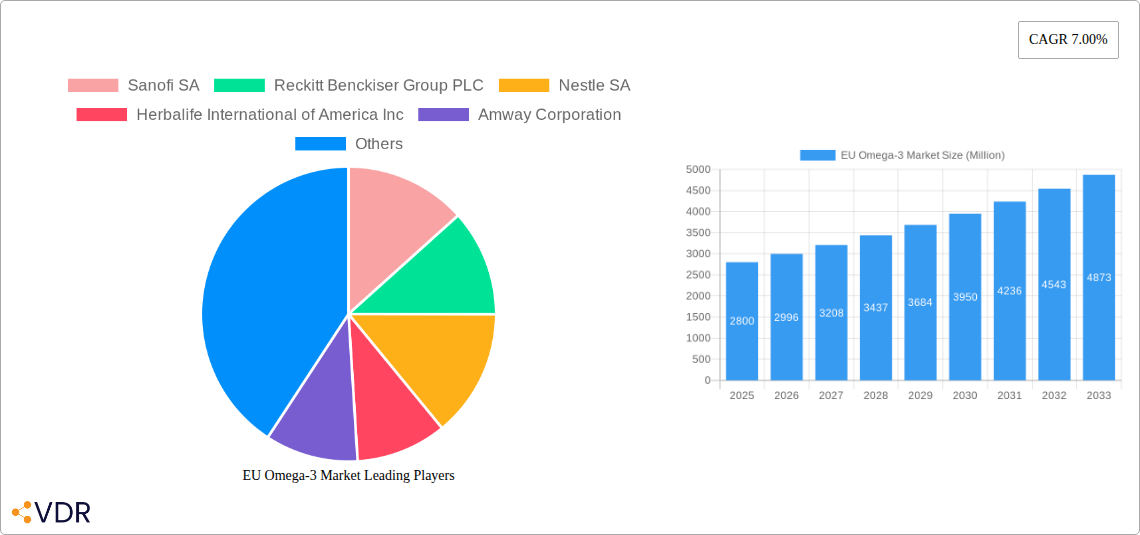
EU Omega-3 Market Market Size (In Billion)
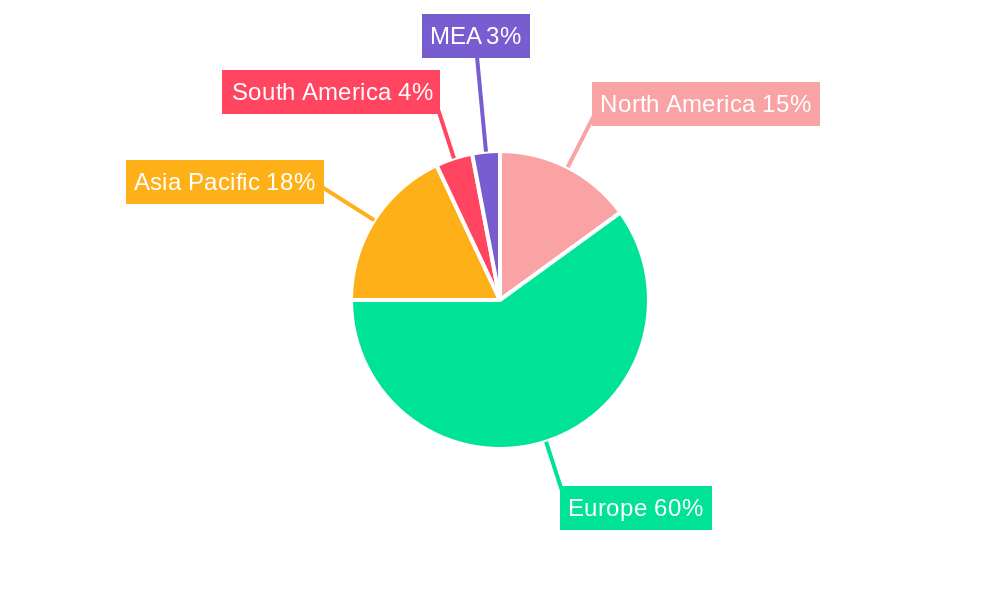
Key regional markets include Germany, the United Kingdom, and France, anticipated to lead due to their substantial populations and developed healthcare systems. Nonetheless, other European nations are experiencing escalating interest in Omega-3 supplements and functional foods, fostering regional market expansion. Market segmentation by product type—including functional foods, dietary supplements, infant nutrition, pet food, pharmaceuticals, and clinical nutrition—reveals considerable opportunities. The dietary supplement segment currently dominates, attributed to convenience and targeted benefits, while functional foods are emerging as a significant area of interest due to consumer preference for healthier alternatives. Competitive dynamics among leading companies such as Sanofi SA, Reckitt Benckiser Group PLC, and Nestlé SA are stimulating innovation and the introduction of novel products with improved bioavailability and efficacy. Potential challenges include navigating regulatory landscapes and addressing consumer price sensitivity.
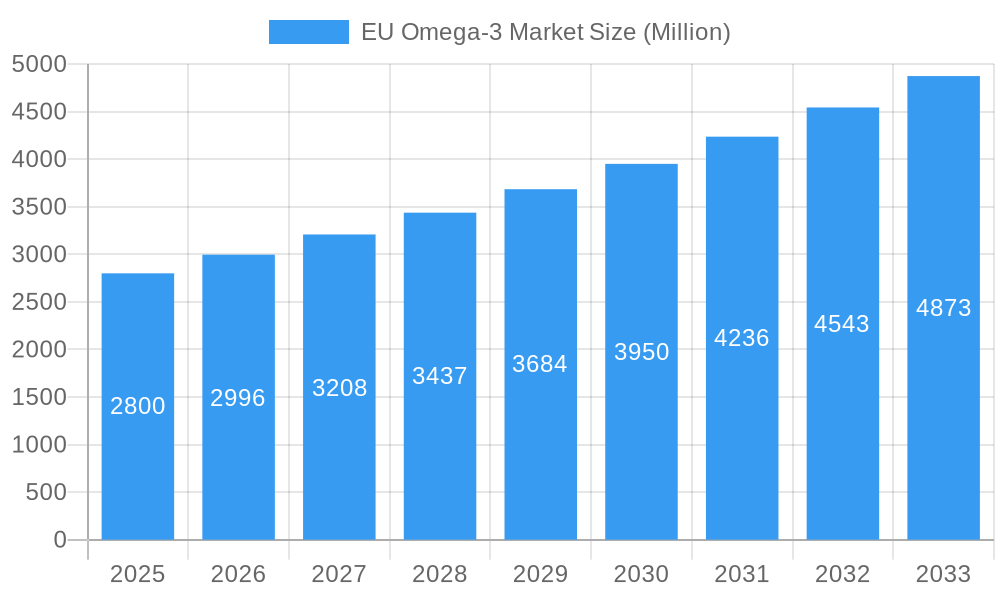
EU Omega-3 Market Company Market Share
EU Omega-3 Market: A Comprehensive Market Report (2019-2033)
This in-depth report provides a comprehensive analysis of the EU Omega-3 market, covering market dynamics, growth trends, regional dominance, product landscape, key players, and future outlook. The study period spans from 2019 to 2033, with 2025 serving as the base and estimated year. The report segments the market by product type (Functional Food, Dietary Supplements, Infant Nutrition, Pet Food and Feed, Pharmaceutical, Clinical Nutrition), distribution channel (Grocery Retailers, Pharmacies, Health Stores, Internet Retailing, Other Distribution Channels), and key European countries (Germany, United Kingdom, France, Italy, Russia, Spain, Rest of Europe). The report is invaluable for industry professionals, investors, and strategists seeking to understand and capitalize on the opportunities within this dynamic market. Total market value is predicted to reach xx Million units by 2033.
EU Omega-3 Market Dynamics & Structure
The EU Omega-3 market is characterized by a moderately concentrated landscape, with key players like Sanofi SA, Reckitt Benckiser Group PLC, and Nestlé SA holding significant market share. However, the market also features numerous smaller players, particularly in the dietary supplement and pet food segments. Technological innovation, driven by advancements in extraction methods and delivery systems, is a key growth driver. Stringent regulatory frameworks governing food safety and labeling influence market practices. The presence of competitive substitutes, such as other fatty acids and fortified foods, presents a challenge. End-user demographics are shifting towards an increasingly health-conscious population, boosting demand for omega-3 products. M&A activity has been moderate, with a total of xx deals recorded between 2019 and 2024, reflecting consolidation efforts within the industry.
- Market Concentration: Moderately concentrated, with top 5 players holding xx% market share in 2024.
- Technological Innovation: Advancements in algae-based omega-3 production and encapsulation technologies.
- Regulatory Framework: Stringent EU regulations on food safety and labeling impacting product development and marketing.
- Competitive Substitutes: Other fatty acids (e.g., ALA) and fortified foods pose competition.
- End-User Demographics: Growing health consciousness and awareness of omega-3 benefits drive demand.
- M&A Trends: Moderate activity, with xx M&A deals between 2019 and 2024.
EU Omega-3 Market Growth Trends & Insights
The EU Omega-3 market experienced steady growth during the historical period (2019-2024), with a CAGR of xx%. This growth is attributed to increasing consumer awareness of the health benefits of omega-3 fatty acids, rising prevalence of chronic diseases, and the increasing availability of omega-3-rich products across various distribution channels. Market penetration in key segments, like dietary supplements, remains significant, though there's potential for expansion into other segments such as functional foods and infant nutrition. Technological disruptions, such as the rise of sustainable and cost-effective algae-based omega-3 production, are expected to further fuel market expansion. Consumer behavior shifts, marked by a preference for natural and sustainable products, are influencing product development and marketing strategies. The forecast period (2025-2033) projects continued growth, driven by these factors, with a projected CAGR of xx%.
Dominant Regions, Countries, or Segments in EU Omega-3 Market
Germany, the United Kingdom, and France are the leading markets within the EU, accounting for xx% of the total market value in 2024. These countries boast robust healthcare infrastructure, high consumer spending on health and wellness products, and strong regulatory frameworks. Dietary supplements and functional foods dominate the product type segment, reflecting consumer preference for convenient and readily available omega-3 sources. Grocery retailers and pharmacies remain the primary distribution channels, indicating established distribution networks and consumer purchasing habits.
- Key Drivers in Germany: Strong healthcare infrastructure, high health consciousness among consumers.
- Key Drivers in the UK: High consumer spending on health supplements, strong retail infrastructure.
- Key Drivers in France: Growing awareness of omega-3 benefits, expanding functional food market.
- Dominant Product Type: Dietary Supplements and Functional foods (xx% combined market share).
- Dominant Distribution Channel: Grocery Retailers and Pharmacies (xx% combined market share).
EU Omega-3 Market Product Landscape
The EU Omega-3 market showcases a diverse product landscape, with innovations in delivery formats (e.g., capsules, liquids, powders) and sourcing (e.g., fish oil, algae oil, krill oil). Many products highlight specific omega-3 fatty acids (EPA and DHA) and their associated health benefits (e.g., cardiovascular health, brain function). Technological advancements focus on improving product stability, bioavailability, and sustainability. Unique selling propositions often include certifications (e.g., purity, sustainability) and focus on specific health concerns (e.g., heart health, cognitive function).
Key Drivers, Barriers & Challenges in EU Omega-3 Market
Key Drivers:
- Growing consumer awareness of health benefits.
- Increasing prevalence of chronic diseases.
- Advancements in production technologies (algae-based omega-3).
- Rise in demand for convenient and readily available products.
Challenges:
- Price fluctuations in raw materials (fish oil, algae).
- Stringent regulatory requirements and labeling complexities.
- Competition from alternative supplements and fortified foods.
- Concerns regarding environmental sustainability of fish oil sourcing (xx% of production still relies on fish oil).
Emerging Opportunities in EU Omega-3 Market
Emerging opportunities lie in expanding into untapped markets (e.g., specific regional demographics with low omega-3 consumption), developing innovative product formulations (e.g., targeted delivery systems for specific health conditions), and catering to evolving consumer preferences (e.g., plant-based omega-3 sources, personalized nutrition). Furthermore, capitalizing on the growing demand for sustainable and ethically sourced omega-3 products presents significant potential.
Growth Accelerators in the EU Omega-3 Market Industry
Long-term growth will be fueled by technological breakthroughs in algae-based omega-3 production, enhancing sustainability and reducing reliance on traditional fish oil. Strategic partnerships between ingredient suppliers, manufacturers, and retailers will facilitate wider distribution and market penetration. Expanding into new markets and product categories, as well as innovative marketing strategies focusing on specific health benefits, will drive continued expansion.
Key Players Shaping the EU Omega-3 Market Market
- Sanofi SA
- Reckitt Benckiser Group PLC
- Nestle SA
- Herbalife International of America Inc
- Amway Corporation
- Procter and Gamble Company
- Anpario Plc
- Unilever Plc
- Royal DSM
- Archer Daniels Midland Company
Notable Milestones in EU Omega-3 Market Sector
- October 2021: Anpario Plc launched a microalgae-derived omega-3 supplement for animal feed, boosting the sustainable omega-3 supply chain.
- January 2022: Procter and Gamble Company launched the omega-3 Max supplement under its Seven Seas brand, strengthening its position in the dietary supplement market in the UK.
- September 2022: Inspired Pet Nutrition launched Harrington's Wet Puppy Food with salmon oil as an omega-3 source, expanding the pet food segment's omega-3 offerings.
In-Depth EU Omega-3 Market Market Outlook
The future of the EU Omega-3 market appears bright, with continued growth driven by the factors mentioned above. Strategic investments in research and development, focusing on sustainable production methods and innovative product formulations, will be crucial for success. The market presents significant opportunities for companies that can effectively address consumer demands for high-quality, sustainable, and efficacious omega-3 products. The forecast predicts a substantial increase in market value by 2033, creating attractive prospects for both established players and new entrants.
EU Omega-3 Market Segmentation
-
1. Product Type
- 1.1. Functional Food
- 1.2. Dietary Supplements
- 1.3. Infant Nutrition
- 1.4. Pet Food and Feed
- 1.5. Pharmaceutical
- 1.6. Clinical Nutrition
-
2. Distribution Channel
- 2.1. Grocery Retailers
- 2.2. Pharmacies
- 2.3. Health Stores
- 2.4. Internet Retailing
- 2.5. Other Distribution Channels
EU Omega-3 Market Segmentation By Geography
-
1. North America
- 1.1. United States
- 1.2. Canada
- 1.3. Mexico
-
2. South America
- 2.1. Brazil
- 2.2. Argentina
- 2.3. Rest of South America
-
3. Europe
- 3.1. United Kingdom
- 3.2. Germany
- 3.3. France
- 3.4. Italy
- 3.5. Spain
- 3.6. Russia
- 3.7. Benelux
- 3.8. Nordics
- 3.9. Rest of Europe
-
4. Middle East & Africa
- 4.1. Turkey
- 4.2. Israel
- 4.3. GCC
- 4.4. North Africa
- 4.5. South Africa
- 4.6. Rest of Middle East & Africa
-
5. Asia Pacific
- 5.1. China
- 5.2. India
- 5.3. Japan
- 5.4. South Korea
- 5.5. ASEAN
- 5.6. Oceania
- 5.7. Rest of Asia Pacific
EU Omega-3 Market Regional Market Share
Geographic Coverage of EU Omega-3 Market
EU Omega-3 Market REPORT HIGHLIGHTS
| Aspects | Details |
|---|---|
| Study Period | 2020-2034 |
| Base Year | 2025 |
| Estimated Year | 2026 |
| Forecast Period | 2026-2034 |
| Historical Period | 2020-2025 |
| Growth Rate | CAGR of 7% from 2020-2034 |
| Segmentation |
|
Table of Contents
- 1. Introduction
- 1.1. Research Scope
- 1.2. Market Segmentation
- 1.3. Research Objective
- 1.4. Definitions and Assumptions
- 2. Executive Summary
- 2.1. Market Snapshot
- 3. Market Dynamics
- 3.1. Market Drivers
- 3.2. Market Restrains
- 3.3. Market Trends
- 3.4. Market Opportunities
- 4. Market Factor Analysis
- 4.1. Porters Five Forces
- 4.1.1. Bargaining Power of Suppliers
- 4.1.2. Bargaining Power of Buyers
- 4.1.3. Threat of New Entrants
- 4.1.4. Threat of Substitutes
- 4.1.5. Competitive Rivalry
- 4.2. PESTEL analysis
- 4.3. BCG Analysis
- 4.3.1. Stars (High Growth, High Market Share)
- 4.3.2. Cash Cows (Low Growth, High Market Share)
- 4.3.3. Question Mark (High Growth, Low Market Share)
- 4.3.4. Dogs (Low Growth, Low Market Share)
- 4.4. Ansoff Matrix Analysis
- 4.5. Supply Chain Analysis
- 4.6. Regulatory Landscape
- 4.7. Current Market Potential and Opportunity Assessment (TAM–SAM–SOM Framework)
- 4.8. VDR Analyst Note
- 4.1. Porters Five Forces
- 5. Market Analysis, Insights and Forecast 2021-2033
- 5.1. Market Analysis, Insights and Forecast - by Product Type
- 5.1.1. Functional Food
- 5.1.2. Dietary Supplements
- 5.1.3. Infant Nutrition
- 5.1.4. Pet Food and Feed
- 5.1.5. Pharmaceutical
- 5.1.6. Clinical Nutrition
- 5.2. Market Analysis, Insights and Forecast - by Distribution Channel
- 5.2.1. Grocery Retailers
- 5.2.2. Pharmacies
- 5.2.3. Health Stores
- 5.2.4. Internet Retailing
- 5.2.5. Other Distribution Channels
- 5.3. Market Analysis, Insights and Forecast - by Region
- 5.3.1. North America
- 5.3.2. South America
- 5.3.3. Europe
- 5.3.4. Middle East & Africa
- 5.3.5. Asia Pacific
- 5.1. Market Analysis, Insights and Forecast - by Product Type
- 6. Global EU Omega-3 Market Analysis, Insights and Forecast, 2021-2033
- 6.1. Market Analysis, Insights and Forecast - by Product Type
- 6.1.1. Functional Food
- 6.1.2. Dietary Supplements
- 6.1.3. Infant Nutrition
- 6.1.4. Pet Food and Feed
- 6.1.5. Pharmaceutical
- 6.1.6. Clinical Nutrition
- 6.2. Market Analysis, Insights and Forecast - by Distribution Channel
- 6.2.1. Grocery Retailers
- 6.2.2. Pharmacies
- 6.2.3. Health Stores
- 6.2.4. Internet Retailing
- 6.2.5. Other Distribution Channels
- 6.1. Market Analysis, Insights and Forecast - by Product Type
- 7. North America EU Omega-3 Market Analysis, Insights and Forecast, 2021-2033
- 7.1. Market Analysis, Insights and Forecast - by Product Type
- 7.1.1. Functional Food
- 7.1.2. Dietary Supplements
- 7.1.3. Infant Nutrition
- 7.1.4. Pet Food and Feed
- 7.1.5. Pharmaceutical
- 7.1.6. Clinical Nutrition
- 7.2. Market Analysis, Insights and Forecast - by Distribution Channel
- 7.2.1. Grocery Retailers
- 7.2.2. Pharmacies
- 7.2.3. Health Stores
- 7.2.4. Internet Retailing
- 7.2.5. Other Distribution Channels
- 7.1. Market Analysis, Insights and Forecast - by Product Type
- 8. South America EU Omega-3 Market Analysis, Insights and Forecast, 2021-2033
- 8.1. Market Analysis, Insights and Forecast - by Product Type
- 8.1.1. Functional Food
- 8.1.2. Dietary Supplements
- 8.1.3. Infant Nutrition
- 8.1.4. Pet Food and Feed
- 8.1.5. Pharmaceutical
- 8.1.6. Clinical Nutrition
- 8.2. Market Analysis, Insights and Forecast - by Distribution Channel
- 8.2.1. Grocery Retailers
- 8.2.2. Pharmacies
- 8.2.3. Health Stores
- 8.2.4. Internet Retailing
- 8.2.5. Other Distribution Channels
- 8.1. Market Analysis, Insights and Forecast - by Product Type
- 9. Europe EU Omega-3 Market Analysis, Insights and Forecast, 2021-2033
- 9.1. Market Analysis, Insights and Forecast - by Product Type
- 9.1.1. Functional Food
- 9.1.2. Dietary Supplements
- 9.1.3. Infant Nutrition
- 9.1.4. Pet Food and Feed
- 9.1.5. Pharmaceutical
- 9.1.6. Clinical Nutrition
- 9.2. Market Analysis, Insights and Forecast - by Distribution Channel
- 9.2.1. Grocery Retailers
- 9.2.2. Pharmacies
- 9.2.3. Health Stores
- 9.2.4. Internet Retailing
- 9.2.5. Other Distribution Channels
- 9.1. Market Analysis, Insights and Forecast - by Product Type
- 10. Middle East & Africa EU Omega-3 Market Analysis, Insights and Forecast, 2021-2033
- 10.1. Market Analysis, Insights and Forecast - by Product Type
- 10.1.1. Functional Food
- 10.1.2. Dietary Supplements
- 10.1.3. Infant Nutrition
- 10.1.4. Pet Food and Feed
- 10.1.5. Pharmaceutical
- 10.1.6. Clinical Nutrition
- 10.2. Market Analysis, Insights and Forecast - by Distribution Channel
- 10.2.1. Grocery Retailers
- 10.2.2. Pharmacies
- 10.2.3. Health Stores
- 10.2.4. Internet Retailing
- 10.2.5. Other Distribution Channels
- 10.1. Market Analysis, Insights and Forecast - by Product Type
- 11. Asia Pacific EU Omega-3 Market Analysis, Insights and Forecast, 2021-2033
- 11.1. Market Analysis, Insights and Forecast - by Product Type
- 11.1.1. Functional Food
- 11.1.2. Dietary Supplements
- 11.1.3. Infant Nutrition
- 11.1.4. Pet Food and Feed
- 11.1.5. Pharmaceutical
- 11.1.6. Clinical Nutrition
- 11.2. Market Analysis, Insights and Forecast - by Distribution Channel
- 11.2.1. Grocery Retailers
- 11.2.2. Pharmacies
- 11.2.3. Health Stores
- 11.2.4. Internet Retailing
- 11.2.5. Other Distribution Channels
- 11.1. Market Analysis, Insights and Forecast - by Product Type
- 12. Competitive Analysis
- 12.1. Company Profiles
- 12.1.1 Sanofi SA
- 12.1.1.1. Company Overview
- 12.1.1.2. Products
- 12.1.1.3. Company Financials
- 12.1.1.4. SWOT Analysis
- 12.1.2 Reckitt Benckiser Group PLC
- 12.1.2.1. Company Overview
- 12.1.2.2. Products
- 12.1.2.3. Company Financials
- 12.1.2.4. SWOT Analysis
- 12.1.3 Nestle SA
- 12.1.3.1. Company Overview
- 12.1.3.2. Products
- 12.1.3.3. Company Financials
- 12.1.3.4. SWOT Analysis
- 12.1.4 Herbalife International of America Inc
- 12.1.4.1. Company Overview
- 12.1.4.2. Products
- 12.1.4.3. Company Financials
- 12.1.4.4. SWOT Analysis
- 12.1.5 Amway Corporation
- 12.1.5.1. Company Overview
- 12.1.5.2. Products
- 12.1.5.3. Company Financials
- 12.1.5.4. SWOT Analysis
- 12.1.6 Procter and Gamble Company
- 12.1.6.1. Company Overview
- 12.1.6.2. Products
- 12.1.6.3. Company Financials
- 12.1.6.4. SWOT Analysis
- 12.1.7 Anpario Plc
- 12.1.7.1. Company Overview
- 12.1.7.2. Products
- 12.1.7.3. Company Financials
- 12.1.7.4. SWOT Analysis
- 12.1.8 Unilever Plc
- 12.1.8.1. Company Overview
- 12.1.8.2. Products
- 12.1.8.3. Company Financials
- 12.1.8.4. SWOT Analysis
- 12.1.9 Royal DSM
- 12.1.9.1. Company Overview
- 12.1.9.2. Products
- 12.1.9.3. Company Financials
- 12.1.9.4. SWOT Analysis
- 12.1.10 Archer Daniels Midland Company
- 12.1.10.1. Company Overview
- 12.1.10.2. Products
- 12.1.10.3. Company Financials
- 12.1.10.4. SWOT Analysis
- 12.1.1 Sanofi SA
- 12.2. Market Entropy
- 12.2.1 Company's Key Areas Served
- 12.2.2 Recent Developments
- 12.3. Company Market Share Analysis 2025
- 12.3.1 Top 5 Companies Market Share Analysis
- 12.3.2 Top 3 Companies Market Share Analysis
- 12.4. List of Potential Customers
- 13. Research Methodology
List of Figures
- Figure 1: Global EU Omega-3 Market Revenue Breakdown (billion, %) by Region 2025 & 2033
- Figure 2: North America EU Omega-3 Market Revenue (billion), by Product Type 2025 & 2033
- Figure 3: North America EU Omega-3 Market Revenue Share (%), by Product Type 2025 & 2033
- Figure 4: North America EU Omega-3 Market Revenue (billion), by Distribution Channel 2025 & 2033
- Figure 5: North America EU Omega-3 Market Revenue Share (%), by Distribution Channel 2025 & 2033
- Figure 6: North America EU Omega-3 Market Revenue (billion), by Country 2025 & 2033
- Figure 7: North America EU Omega-3 Market Revenue Share (%), by Country 2025 & 2033
- Figure 8: South America EU Omega-3 Market Revenue (billion), by Product Type 2025 & 2033
- Figure 9: South America EU Omega-3 Market Revenue Share (%), by Product Type 2025 & 2033
- Figure 10: South America EU Omega-3 Market Revenue (billion), by Distribution Channel 2025 & 2033
- Figure 11: South America EU Omega-3 Market Revenue Share (%), by Distribution Channel 2025 & 2033
- Figure 12: South America EU Omega-3 Market Revenue (billion), by Country 2025 & 2033
- Figure 13: South America EU Omega-3 Market Revenue Share (%), by Country 2025 & 2033
- Figure 14: Europe EU Omega-3 Market Revenue (billion), by Product Type 2025 & 2033
- Figure 15: Europe EU Omega-3 Market Revenue Share (%), by Product Type 2025 & 2033
- Figure 16: Europe EU Omega-3 Market Revenue (billion), by Distribution Channel 2025 & 2033
- Figure 17: Europe EU Omega-3 Market Revenue Share (%), by Distribution Channel 2025 & 2033
- Figure 18: Europe EU Omega-3 Market Revenue (billion), by Country 2025 & 2033
- Figure 19: Europe EU Omega-3 Market Revenue Share (%), by Country 2025 & 2033
- Figure 20: Middle East & Africa EU Omega-3 Market Revenue (billion), by Product Type 2025 & 2033
- Figure 21: Middle East & Africa EU Omega-3 Market Revenue Share (%), by Product Type 2025 & 2033
- Figure 22: Middle East & Africa EU Omega-3 Market Revenue (billion), by Distribution Channel 2025 & 2033
- Figure 23: Middle East & Africa EU Omega-3 Market Revenue Share (%), by Distribution Channel 2025 & 2033
- Figure 24: Middle East & Africa EU Omega-3 Market Revenue (billion), by Country 2025 & 2033
- Figure 25: Middle East & Africa EU Omega-3 Market Revenue Share (%), by Country 2025 & 2033
- Figure 26: Asia Pacific EU Omega-3 Market Revenue (billion), by Product Type 2025 & 2033
- Figure 27: Asia Pacific EU Omega-3 Market Revenue Share (%), by Product Type 2025 & 2033
- Figure 28: Asia Pacific EU Omega-3 Market Revenue (billion), by Distribution Channel 2025 & 2033
- Figure 29: Asia Pacific EU Omega-3 Market Revenue Share (%), by Distribution Channel 2025 & 2033
- Figure 30: Asia Pacific EU Omega-3 Market Revenue (billion), by Country 2025 & 2033
- Figure 31: Asia Pacific EU Omega-3 Market Revenue Share (%), by Country 2025 & 2033
List of Tables
- Table 1: Global EU Omega-3 Market Revenue billion Forecast, by Product Type 2020 & 2033
- Table 2: Global EU Omega-3 Market Revenue billion Forecast, by Distribution Channel 2020 & 2033
- Table 3: Global EU Omega-3 Market Revenue billion Forecast, by Region 2020 & 2033
- Table 4: Global EU Omega-3 Market Revenue billion Forecast, by Product Type 2020 & 2033
- Table 5: Global EU Omega-3 Market Revenue billion Forecast, by Distribution Channel 2020 & 2033
- Table 6: Global EU Omega-3 Market Revenue billion Forecast, by Country 2020 & 2033
- Table 7: United States EU Omega-3 Market Revenue (billion) Forecast, by Application 2020 & 2033
- Table 8: Canada EU Omega-3 Market Revenue (billion) Forecast, by Application 2020 & 2033
- Table 9: Mexico EU Omega-3 Market Revenue (billion) Forecast, by Application 2020 & 2033
- Table 10: Global EU Omega-3 Market Revenue billion Forecast, by Product Type 2020 & 2033
- Table 11: Global EU Omega-3 Market Revenue billion Forecast, by Distribution Channel 2020 & 2033
- Table 12: Global EU Omega-3 Market Revenue billion Forecast, by Country 2020 & 2033
- Table 13: Brazil EU Omega-3 Market Revenue (billion) Forecast, by Application 2020 & 2033
- Table 14: Argentina EU Omega-3 Market Revenue (billion) Forecast, by Application 2020 & 2033
- Table 15: Rest of South America EU Omega-3 Market Revenue (billion) Forecast, by Application 2020 & 2033
- Table 16: Global EU Omega-3 Market Revenue billion Forecast, by Product Type 2020 & 2033
- Table 17: Global EU Omega-3 Market Revenue billion Forecast, by Distribution Channel 2020 & 2033
- Table 18: Global EU Omega-3 Market Revenue billion Forecast, by Country 2020 & 2033
- Table 19: United Kingdom EU Omega-3 Market Revenue (billion) Forecast, by Application 2020 & 2033
- Table 20: Germany EU Omega-3 Market Revenue (billion) Forecast, by Application 2020 & 2033
- Table 21: France EU Omega-3 Market Revenue (billion) Forecast, by Application 2020 & 2033
- Table 22: Italy EU Omega-3 Market Revenue (billion) Forecast, by Application 2020 & 2033
- Table 23: Spain EU Omega-3 Market Revenue (billion) Forecast, by Application 2020 & 2033
- Table 24: Russia EU Omega-3 Market Revenue (billion) Forecast, by Application 2020 & 2033
- Table 25: Benelux EU Omega-3 Market Revenue (billion) Forecast, by Application 2020 & 2033
- Table 26: Nordics EU Omega-3 Market Revenue (billion) Forecast, by Application 2020 & 2033
- Table 27: Rest of Europe EU Omega-3 Market Revenue (billion) Forecast, by Application 2020 & 2033
- Table 28: Global EU Omega-3 Market Revenue billion Forecast, by Product Type 2020 & 2033
- Table 29: Global EU Omega-3 Market Revenue billion Forecast, by Distribution Channel 2020 & 2033
- Table 30: Global EU Omega-3 Market Revenue billion Forecast, by Country 2020 & 2033
- Table 31: Turkey EU Omega-3 Market Revenue (billion) Forecast, by Application 2020 & 2033
- Table 32: Israel EU Omega-3 Market Revenue (billion) Forecast, by Application 2020 & 2033
- Table 33: GCC EU Omega-3 Market Revenue (billion) Forecast, by Application 2020 & 2033
- Table 34: North Africa EU Omega-3 Market Revenue (billion) Forecast, by Application 2020 & 2033
- Table 35: South Africa EU Omega-3 Market Revenue (billion) Forecast, by Application 2020 & 2033
- Table 36: Rest of Middle East & Africa EU Omega-3 Market Revenue (billion) Forecast, by Application 2020 & 2033
- Table 37: Global EU Omega-3 Market Revenue billion Forecast, by Product Type 2020 & 2033
- Table 38: Global EU Omega-3 Market Revenue billion Forecast, by Distribution Channel 2020 & 2033
- Table 39: Global EU Omega-3 Market Revenue billion Forecast, by Country 2020 & 2033
- Table 40: China EU Omega-3 Market Revenue (billion) Forecast, by Application 2020 & 2033
- Table 41: India EU Omega-3 Market Revenue (billion) Forecast, by Application 2020 & 2033
- Table 42: Japan EU Omega-3 Market Revenue (billion) Forecast, by Application 2020 & 2033
- Table 43: South Korea EU Omega-3 Market Revenue (billion) Forecast, by Application 2020 & 2033
- Table 44: ASEAN EU Omega-3 Market Revenue (billion) Forecast, by Application 2020 & 2033
- Table 45: Oceania EU Omega-3 Market Revenue (billion) Forecast, by Application 2020 & 2033
- Table 46: Rest of Asia Pacific EU Omega-3 Market Revenue (billion) Forecast, by Application 2020 & 2033
Frequently Asked Questions
1. What is the projected Compound Annual Growth Rate (CAGR) of the EU Omega-3 Market?
The projected CAGR is approximately 7%.
2. Which companies are prominent players in the EU Omega-3 Market?
Key companies in the market include Sanofi SA, Reckitt Benckiser Group PLC, Nestle SA, Herbalife International of America Inc, Amway Corporation, Procter and Gamble Company, Anpario Plc, Unilever Plc, Royal DSM, Archer Daniels Midland Company.
3. What are the main segments of the EU Omega-3 Market?
The market segments include Product Type, Distribution Channel.
4. Can you provide details about the market size?
The market size is estimated to be USD 3.59 billion as of 2022.
5. What are some drivers contributing to market growth?
Increasing Sports Participation; Increasing Awareness about Health and Fitness.
6. What are the notable trends driving market growth?
Health Benefits Associated with Omega-3 Consumption.
7. Are there any restraints impacting market growth?
Adverse Effects of Over consumption of Products.
8. Can you provide examples of recent developments in the market?
September 2022: Inspired Pet Nutrition launched Harrington's Wet Puppy Food. The product is available in chicken flavor. The product is made with salmon oil as a source of omega-3. The product is available in the United Kingdom.
9. What pricing options are available for accessing the report?
Pricing options include single-user, multi-user, and enterprise licenses priced at USD 4750, USD 5250, and USD 8750 respectively.
10. Is the market size provided in terms of value or volume?
The market size is provided in terms of value, measured in billion.
11. Are there any specific market keywords associated with the report?
Yes, the market keyword associated with the report is "EU Omega-3 Market," which aids in identifying and referencing the specific market segment covered.
12. How do I determine which pricing option suits my needs best?
The pricing options vary based on user requirements and access needs. Individual users may opt for single-user licenses, while businesses requiring broader access may choose multi-user or enterprise licenses for cost-effective access to the report.
13. Are there any additional resources or data provided in the EU Omega-3 Market report?
While the report offers comprehensive insights, it's advisable to review the specific contents or supplementary materials provided to ascertain if additional resources or data are available.
14. How can I stay updated on further developments or reports in the EU Omega-3 Market?
To stay informed about further developments, trends, and reports in the EU Omega-3 Market, consider subscribing to industry newsletters, following relevant companies and organizations, or regularly checking reputable industry news sources and publications.
Methodology
Step 1 - Identification of Relevant Samples Size from Population Database


Step 2 - Approaches for Defining Global Market Size (Value, Volume* & Price*)

Note*: In applicable scenarios
Step 3 - Data Sources
Primary Research
- Web Analytics
- Survey Reports
- Research Institute
- Latest Research Reports
- Opinion Leaders
Secondary Research
- Annual Reports
- White Paper
- Latest Press Release
- Industry Association
- Paid Database
- Investor Presentations

Step 4 - Data Triangulation
Involves using different sources of information in order to increase the validity of a study
These sources are likely to be stakeholders in a program - participants, other researchers, program staff, other community members, and so on.
Then we put all data in single framework & apply various statistical tools to find out the dynamic on the market.
During the analysis stage, feedback from the stakeholder groups would be compared to determine areas of agreement as well as areas of divergence