

Key Insights
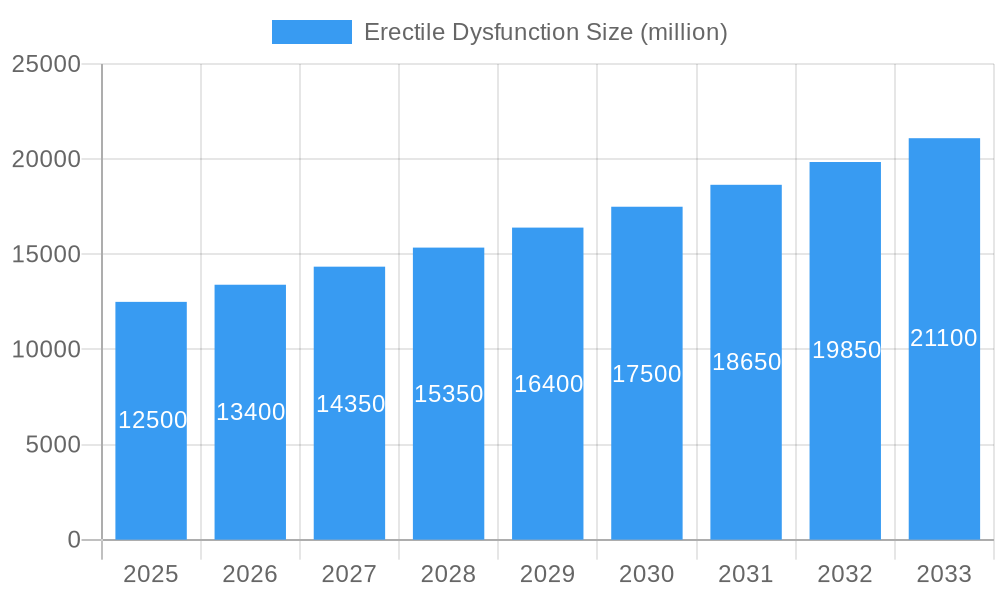
The global Erectile Dysfunction (ED) market is experiencing robust growth, projected to reach an estimated market size of approximately USD 12,500 million by 2025, with a Compound Annual Growth Rate (CAGR) of around 7.5% between 2025 and 2033. This significant expansion is fueled by a confluence of factors, including the increasing prevalence of ED due to an aging global population, rising rates of associated comorbidities like diabetes and cardiovascular disease, and growing awareness and destigmatization surrounding sexual health. The market is further propelled by advancements in pharmaceutical research and development, leading to the introduction of novel and more effective treatment options. Moreover, the expanding reach of e-commerce platforms for both business-to-business (B2B) and business-to-consumer (B2C) sales is democratizing access to ED medications and treatments, contributing to market uplift. Key players like Pfizer, Bayer, and Eli Lilly are actively investing in R&D and strategic partnerships to capture a larger market share, while emerging companies are introducing innovative solutions, intensifying competition and driving market dynamism.
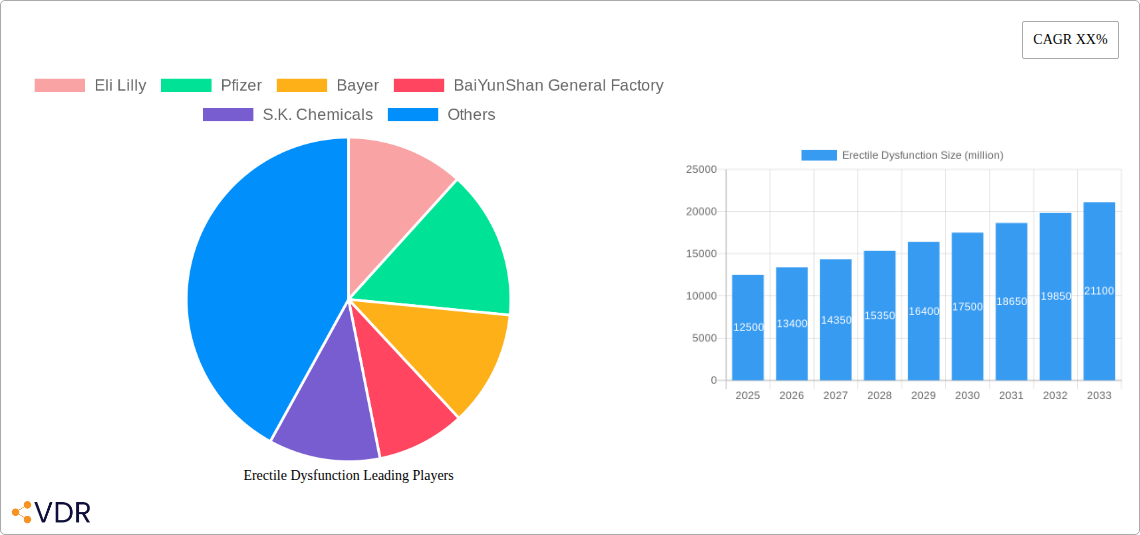
Erectile Dysfunction Market Size (In Billion)
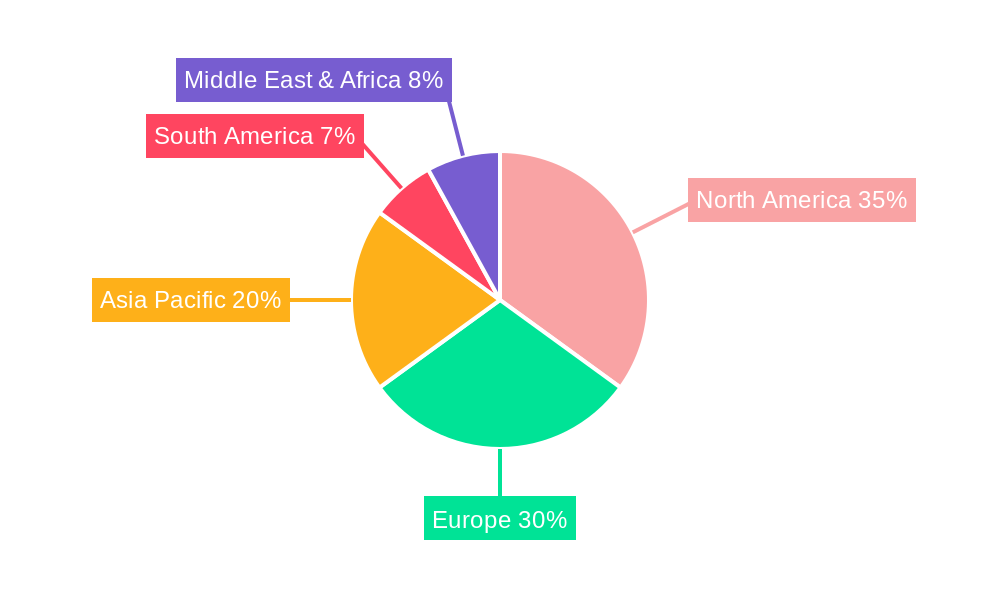
Despite the positive trajectory, the ED market faces certain restraints. These include the high cost of some advanced treatments, potential side effects associated with certain medications, and persistent societal taboos in some regions that may hinder individuals from seeking timely medical advice and treatment. However, the increasing focus on digital health solutions, telemedicine, and direct-to-consumer marketing by pharmaceutical companies is expected to mitigate these challenges. The market is segmented by type, with Sildenafil and Tadalafil dominating the landscape due to their established efficacy and widespread prescription. The "Others" category, however, is poised for growth with the advent of newer therapeutic approaches. Geographically, North America and Europe currently lead the market, driven by high healthcare expenditure and advanced medical infrastructure. Yet, the Asia Pacific region presents significant growth opportunities owing to its large population base, increasing disposable incomes, and a growing emphasis on men's health awareness initiatives.
Erectile Dysfunction Company Market Share
Erectile Dysfunction Market Report: Comprehensive Analysis & Future Outlook (2019-2033)
This in-depth report provides a panoramic view of the global erectile dysfunction (ED) market, meticulously analyzing its current state and projecting its trajectory through 2033. Delving into market dynamics, growth trends, regional dominance, product innovation, and competitive landscapes, this report is an indispensable resource for pharmaceutical companies, healthcare providers, investors, and industry stakeholders seeking to understand and capitalize on opportunities within the erectile dysfunction treatment market. We offer a granular breakdown of the market, segmenting it by application and type, and explore the impact of key players and emerging trends.
Erectile Dysfunction Market Dynamics & Structure
The global erectile dysfunction market exhibits a moderately concentrated structure, with a few dominant players and a growing number of emerging companies. Eli Lilly and Pfizer continue to hold significant market share due to their established brands and robust distribution networks. Technological innovation is a primary driver, with ongoing research into novel drug formulations, delivery mechanisms, and non-pharmacological treatment options. Regulatory frameworks, primarily governed by agencies like the FDA and EMA, significantly influence market entry and product approval processes. Competitive product substitutes are a key consideration, including phosphodiesterase type 5 (PDE5) inhibitors, hormone replacement therapies, and increasingly, lifestyle modifications and psychological interventions. End-user demographics are shifting, with a growing patient population due to an aging global populace and increasing awareness of ED as a treatable condition. Mergers and acquisitions (M&A) trends are moderate, indicating a mature market with strategic consolidations for market expansion and portfolio diversification.
- Market Concentration: Dominated by major pharmaceutical companies, with a growing presence of specialized ED treatment providers.
- Technological Innovation Drivers: Development of next-generation PDE5 inhibitors, combination therapies, and regenerative medicine approaches.
- Regulatory Frameworks: Stringent approval processes for new drug entities and medical devices.
- Competitive Product Substitutes: Advancements in psychological counseling and non-invasive therapies.
- End-User Demographics: Increasing prevalence among aging populations and individuals with comorbidities like diabetes and cardiovascular disease.
- M&A Trends: Strategic acquisitions focused on expanding product pipelines and geographical reach.
Erectile Dysfunction Growth Trends & Insights
The erectile dysfunction market is poised for significant growth, driven by a confluence of factors including increasing awareness, improving diagnostics, and advancements in treatment modalities. The market size is expected to witness a substantial upward trajectory from an estimated US$ XXX million in 2025 to US$ XXX million by 2033, exhibiting a Compound Annual Growth Rate (CAGR) of approximately XX% during the forecast period (2025-2033). Adoption rates of both established and novel ED treatments are on the rise, fueled by greater patient comfort in discussing sexual health concerns and the availability of effective therapeutic options. Technological disruptions, such as the development of oral medications with improved efficacy and fewer side effects, and the exploration of telemedicine for discreet consultations and prescriptions, are further accelerating market penetration. Consumer behavior shifts are also playing a crucial role; patients are becoming more proactive in seeking treatment, influenced by increased access to health information online and a growing emphasis on overall well-being and quality of life. The rising prevalence of chronic conditions like diabetes, hypertension, and obesity, all of which are significant risk factors for ED, further bolsters the demand for effective ED therapies. The global erectile dysfunction market is expanding beyond traditional pharmaceutical treatments, with a growing interest in interventional therapies and medical devices. The base year of 2025 represents a pivotal point, with an estimated market value of US$ XXX million, setting the stage for robust expansion. The historical period of 2019-2024 has witnessed steady growth, laying the groundwork for the accelerated expansion projected in the coming years.
Dominant Regions, Countries, or Segments in Erectile Dysfunction
North America, particularly the United States, currently holds a dominant position in the erectile dysfunction market. This dominance is driven by a combination of factors including a high prevalence of risk factors such as obesity and diabetes, robust healthcare infrastructure, high disposable incomes, and advanced research and development capabilities. The hospital pharmacies segment, alongside private clinics, contributes significantly to the market share in this region, reflecting the preference for professional medical consultation and prescription-based treatments. Tadalafil and Sildenafil are the leading types of drugs driving market growth in this segment due to their proven efficacy and widespread availability. Economic policies that support healthcare access and pharmaceutical innovation further bolster the market.
- North America (USA): Leading market due to high prevalence of risk factors, strong healthcare infrastructure, and advanced R&D.
- Market Share: Estimated at XX% of the global market in 2025.
- Growth Potential: Significant, driven by an aging population and increasing awareness.
- Dominant Application Segments:
- Hospital Pharmacies: Providing access to a wide range of prescription ED medications and specialized treatments.
- Private Clinics: Offering personalized consultations, diagnostics, and tailored treatment plans.
- Dominant Type Segments:
- Tadalafil: Known for its longer duration of action, catering to spontaneous sexual activity.
- Sildenafil: The first-in-class PDE5 inhibitor, maintaining a strong market presence due to brand recognition and efficacy.
- Key Drivers in North America:
- Economic Policies: Favorable reimbursement policies for ED treatments and investment in healthcare research.
- Infrastructure: Well-established hospital networks and a high density of specialized clinics.
- Technological Adoption: Early and widespread adoption of advanced medical devices and pharmaceutical innovations.
The European market follows closely, with countries like Germany, the UK, and France showing substantial growth. Similar to North America, advanced healthcare systems and high awareness levels contribute to the strong performance. Asia Pacific, particularly China and India, represents the fastest-growing region, driven by an expanding middle class, increasing urbanization, and a growing awareness of sexual health issues. The retail pharmacies and e-commerce (B2C) segments are expected to witness significant growth in this region due to increasing internet penetration and a preference for discreet purchasing options. The rise of BaiYunShan General Factory and Yabang Pharmacy signifies the growing influence of local players in these emerging markets.
Erectile Dysfunction Product Landscape
The erectile dysfunction product landscape is characterized by a focus on enhancing efficacy, improving safety profiles, and offering patient convenience. Sildenafil (Viagra) and Tadalafil (Cialis) remain the cornerstone treatments, with ongoing research aimed at developing next-generation formulations with faster onset of action, longer duration, and reduced side effects. Innovations extend to combination therapies, particularly for patients with co-existing conditions, and the development of more advanced medical devices like vacuum erection devices and penile implants. The unique selling propositions of current market leaders revolve around their established efficacy, extensive clinical data, and strong brand recognition. Technological advancements are also exploring novel drug delivery systems, such as orally disintegrating tablets and injectable formulations, to cater to diverse patient needs and preferences. The market also sees innovation in non-pharmacological approaches, including shockwave therapy and regenerative medicine, offering potential long-term solutions.
Key Drivers, Barriers & Challenges in Erectile Dysfunction
Key Drivers:
- Increasing Prevalence of ED: Driven by aging populations, rising rates of chronic diseases (diabetes, cardiovascular disease, obesity), and improved diagnostic capabilities.
- Growing Awareness and Reduced Stigma: Patients are more open to discussing sexual health concerns, leading to increased demand for treatment.
- Technological Advancements: Development of more effective and safer treatment options, including novel drug formulations and medical devices.
- Improved Access to Healthcare: Expanding healthcare infrastructure and growing disposable incomes, particularly in emerging economies.
Barriers & Challenges:
- Regulatory Hurdles: Stringent approval processes for new drugs and medical devices can delay market entry.
- Side Effects and Contraindications: Some treatments can cause adverse effects, limiting their use in certain patient populations.
- Cost of Treatment: Advanced therapies and innovative devices can be expensive, posing affordability challenges for some patients.
- Counterfeit Products: The prevalence of substandard and counterfeit ED medications poses a significant risk to patient safety and market integrity.
- Psychological Factors: ED can have complex psychological components that require comprehensive management beyond pharmacological interventions.
Emerging Opportunities in Erectile Dysfunction
Emerging opportunities within the erectile dysfunction market lie in the development of personalized medicine approaches, leveraging genetic profiling to tailor treatments for individual patients. The burgeoning field of regenerative medicine, including stem cell therapy and platelet-rich plasma (PRP) treatments, holds significant promise for offering long-term solutions beyond symptomatic relief. Furthermore, the growing adoption of telemedicine and digital health platforms presents a substantial opportunity for discreet and accessible consultations, diagnosis, and prescription management, especially in underserved regions. The exploration of novel drug targets beyond PDE5 inhibition, focusing on vascular health and neural pathways involved in erection, also represents a promising avenue for innovation. As awareness around men's sexual health continues to rise globally, untapped markets in developing economies are poised for accelerated growth.
Growth Accelerators in the Erectile Dysfunction Industry
Several catalysts are expected to significantly accelerate growth in the erectile dysfunction industry. Technological breakthroughs in drug discovery and delivery systems, such as the development of orally disintegrating tablets and novel injectable formulations, will enhance patient compliance and treatment efficacy. Strategic partnerships between pharmaceutical giants like Eli Lilly and Pfizer and smaller biotech firms specializing in advanced therapies will foster innovation and accelerate product development. Market expansion strategies targeting emerging economies with increasing disposable incomes and rising awareness of sexual health issues will unlock new revenue streams. The growing focus on non-pharmacological treatments and combination therapies will broaden the market appeal and cater to a wider patient spectrum. Furthermore, advancements in artificial intelligence for drug development and personalized treatment recommendations will streamline R&D processes and improve patient outcomes.
Key Players Shaping the Erectile Dysfunction Market
- Eli Lilly
- Pfizer
- Bayer
- BaiYunShan General Factory
- S.K. Chemicals
- Teva Pharma
- Dong-A ST
- Petros Pharmaceuticals
- Seoul Pharma
- Yabang Pharmacy
Notable Milestones in Erectile Dysfunction Sector
- 2019: Introduction of new clinical guidelines emphasizing a holistic approach to ED management.
- 2020: Increased adoption of telemedicine for ED consultations and prescription renewals due to global events.
- 2021: Launch of new generic versions of established ED medications, increasing accessibility.
- 2022: Advancements in research on stem cell therapy for ED showing promising preclinical results.
- 2023: Growing interest and initial clinical trials for shockwave therapy as a non-invasive ED treatment.
- 2024: Significant advancements in understanding the link between gut microbiome and erectile function.
In-Depth Erectile Dysfunction Market Outlook
The erectile dysfunction market is projected to experience robust and sustained growth, driven by an aging global population, increasing prevalence of associated comorbidities, and a significant shift towards proactive men's health management. Growth accelerators such as the development of next-generation pharmaceuticals with improved safety profiles, personalized medicine approaches, and the expansion of non-pharmacological therapies will be critical. The increasing penetration of e-commerce platforms for discreet and accessible purchasing of ED treatments will further fuel market expansion, particularly in emerging economies. Strategic collaborations and mergers, alongside continuous innovation from key players like Eli Lilly and Pfizer, will shape the competitive landscape and drive the introduction of novel treatment modalities. The market outlook is highly optimistic, indicating substantial opportunities for stakeholders willing to invest in research, development, and market penetration strategies.
Erectile Dysfunction Segmentation
-
1. Application
- 1.1. Hospital Pharmacies
- 1.2. Private Clinics
- 1.3. Retail Pharmacies
- 1.4. E-Commerce (B2B)
- 1.5. E-Commerce (B2C)
-
2. Types
- 2.1. Sildenafil
- 2.2. Tadalafil
- 2.3. Others
Erectile Dysfunction Segmentation By Geography
-
1. North America
- 1.1. United States
- 1.2. Canada
- 1.3. Mexico
-
2. South America
- 2.1. Brazil
- 2.2. Argentina
- 2.3. Rest of South America
-
3. Europe
- 3.1. United Kingdom
- 3.2. Germany
- 3.3. France
- 3.4. Italy
- 3.5. Spain
- 3.6. Russia
- 3.7. Benelux
- 3.8. Nordics
- 3.9. Rest of Europe
-
4. Middle East & Africa
- 4.1. Turkey
- 4.2. Israel
- 4.3. GCC
- 4.4. North Africa
- 4.5. South Africa
- 4.6. Rest of Middle East & Africa
-
5. Asia Pacific
- 5.1. China
- 5.2. India
- 5.3. Japan
- 5.4. South Korea
- 5.5. ASEAN
- 5.6. Oceania
- 5.7. Rest of Asia Pacific
Erectile Dysfunction Regional Market Share
Geographic Coverage of Erectile Dysfunction
Erectile Dysfunction REPORT HIGHLIGHTS
| Aspects | Details |
|---|---|
| Study Period | 2020-2034 |
| Base Year | 2025 |
| Estimated Year | 2026 |
| Forecast Period | 2026-2034 |
| Historical Period | 2020-2025 |
| Growth Rate | CAGR of 11.37% from 2020-2034 |
| Segmentation |
|
Table of Contents
- 1. Introduction
- 1.1. Research Scope
- 1.2. Market Segmentation
- 1.3. Research Objective
- 1.4. Definitions and Assumptions
- 2. Executive Summary
- 2.1. Market Snapshot
- 3. Market Dynamics
- 3.1. Market Drivers
- 3.2. Market Restrains
- 3.3. Market Trends
- 3.4. Market Opportunities
- 4. Market Factor Analysis
- 4.1. Porters Five Forces
- 4.1.1. Bargaining Power of Suppliers
- 4.1.2. Bargaining Power of Buyers
- 4.1.3. Threat of New Entrants
- 4.1.4. Threat of Substitutes
- 4.1.5. Competitive Rivalry
- 4.2. PESTEL analysis
- 4.3. BCG Analysis
- 4.3.1. Stars (High Growth, High Market Share)
- 4.3.2. Cash Cows (Low Growth, High Market Share)
- 4.3.3. Question Mark (High Growth, Low Market Share)
- 4.3.4. Dogs (Low Growth, Low Market Share)
- 4.4. Ansoff Matrix Analysis
- 4.5. Supply Chain Analysis
- 4.6. Regulatory Landscape
- 4.7. Current Market Potential and Opportunity Assessment (TAM–SAM–SOM Framework)
- 4.8. VDR Analyst Note
- 4.1. Porters Five Forces
- 5. Market Analysis, Insights and Forecast 2021-2033
- 5.1. Market Analysis, Insights and Forecast - by Application
- 5.1.1. Hospital Pharmacies
- 5.1.2. Private Clinics
- 5.1.3. Retail Pharmacies
- 5.1.4. E-Commerce (B2B)
- 5.1.5. E-Commerce (B2C)
- 5.2. Market Analysis, Insights and Forecast - by Types
- 5.2.1. Sildenafil
- 5.2.2. Tadalafil
- 5.2.3. Others
- 5.3. Market Analysis, Insights and Forecast - by Region
- 5.3.1. North America
- 5.3.2. South America
- 5.3.3. Europe
- 5.3.4. Middle East & Africa
- 5.3.5. Asia Pacific
- 5.1. Market Analysis, Insights and Forecast - by Application
- 6. Global Erectile Dysfunction Analysis, Insights and Forecast, 2021-2033
- 6.1. Market Analysis, Insights and Forecast - by Application
- 6.1.1. Hospital Pharmacies
- 6.1.2. Private Clinics
- 6.1.3. Retail Pharmacies
- 6.1.4. E-Commerce (B2B)
- 6.1.5. E-Commerce (B2C)
- 6.2. Market Analysis, Insights and Forecast - by Types
- 6.2.1. Sildenafil
- 6.2.2. Tadalafil
- 6.2.3. Others
- 6.1. Market Analysis, Insights and Forecast - by Application
- 7. North America Erectile Dysfunction Analysis, Insights and Forecast, 2021-2033
- 7.1. Market Analysis, Insights and Forecast - by Application
- 7.1.1. Hospital Pharmacies
- 7.1.2. Private Clinics
- 7.1.3. Retail Pharmacies
- 7.1.4. E-Commerce (B2B)
- 7.1.5. E-Commerce (B2C)
- 7.2. Market Analysis, Insights and Forecast - by Types
- 7.2.1. Sildenafil
- 7.2.2. Tadalafil
- 7.2.3. Others
- 7.1. Market Analysis, Insights and Forecast - by Application
- 8. South America Erectile Dysfunction Analysis, Insights and Forecast, 2021-2033
- 8.1. Market Analysis, Insights and Forecast - by Application
- 8.1.1. Hospital Pharmacies
- 8.1.2. Private Clinics
- 8.1.3. Retail Pharmacies
- 8.1.4. E-Commerce (B2B)
- 8.1.5. E-Commerce (B2C)
- 8.2. Market Analysis, Insights and Forecast - by Types
- 8.2.1. Sildenafil
- 8.2.2. Tadalafil
- 8.2.3. Others
- 8.1. Market Analysis, Insights and Forecast - by Application
- 9. Europe Erectile Dysfunction Analysis, Insights and Forecast, 2021-2033
- 9.1. Market Analysis, Insights and Forecast - by Application
- 9.1.1. Hospital Pharmacies
- 9.1.2. Private Clinics
- 9.1.3. Retail Pharmacies
- 9.1.4. E-Commerce (B2B)
- 9.1.5. E-Commerce (B2C)
- 9.2. Market Analysis, Insights and Forecast - by Types
- 9.2.1. Sildenafil
- 9.2.2. Tadalafil
- 9.2.3. Others
- 9.1. Market Analysis, Insights and Forecast - by Application
- 10. Middle East & Africa Erectile Dysfunction Analysis, Insights and Forecast, 2021-2033
- 10.1. Market Analysis, Insights and Forecast - by Application
- 10.1.1. Hospital Pharmacies
- 10.1.2. Private Clinics
- 10.1.3. Retail Pharmacies
- 10.1.4. E-Commerce (B2B)
- 10.1.5. E-Commerce (B2C)
- 10.2. Market Analysis, Insights and Forecast - by Types
- 10.2.1. Sildenafil
- 10.2.2. Tadalafil
- 10.2.3. Others
- 10.1. Market Analysis, Insights and Forecast - by Application
- 11. Asia Pacific Erectile Dysfunction Analysis, Insights and Forecast, 2021-2033
- 11.1. Market Analysis, Insights and Forecast - by Application
- 11.1.1. Hospital Pharmacies
- 11.1.2. Private Clinics
- 11.1.3. Retail Pharmacies
- 11.1.4. E-Commerce (B2B)
- 11.1.5. E-Commerce (B2C)
- 11.2. Market Analysis, Insights and Forecast - by Types
- 11.2.1. Sildenafil
- 11.2.2. Tadalafil
- 11.2.3. Others
- 11.1. Market Analysis, Insights and Forecast - by Application
- 12. Competitive Analysis
- 12.1. Company Profiles
- 12.1.1 Eli Lilly
- 12.1.1.1. Company Overview
- 12.1.1.2. Products
- 12.1.1.3. Company Financials
- 12.1.1.4. SWOT Analysis
- 12.1.2 Pfizer
- 12.1.2.1. Company Overview
- 12.1.2.2. Products
- 12.1.2.3. Company Financials
- 12.1.2.4. SWOT Analysis
- 12.1.3 Bayer
- 12.1.3.1. Company Overview
- 12.1.3.2. Products
- 12.1.3.3. Company Financials
- 12.1.3.4. SWOT Analysis
- 12.1.4 BaiYunShan General Factory
- 12.1.4.1. Company Overview
- 12.1.4.2. Products
- 12.1.4.3. Company Financials
- 12.1.4.4. SWOT Analysis
- 12.1.5 S.K. Chemicals
- 12.1.5.1. Company Overview
- 12.1.5.2. Products
- 12.1.5.3. Company Financials
- 12.1.5.4. SWOT Analysis
- 12.1.6 Teva Pharma
- 12.1.6.1. Company Overview
- 12.1.6.2. Products
- 12.1.6.3. Company Financials
- 12.1.6.4. SWOT Analysis
- 12.1.7 Dong-A ST
- 12.1.7.1. Company Overview
- 12.1.7.2. Products
- 12.1.7.3. Company Financials
- 12.1.7.4. SWOT Analysis
- 12.1.8 Petros Pharmaceuticals
- 12.1.8.1. Company Overview
- 12.1.8.2. Products
- 12.1.8.3. Company Financials
- 12.1.8.4. SWOT Analysis
- 12.1.9 Seoul Pharma
- 12.1.9.1. Company Overview
- 12.1.9.2. Products
- 12.1.9.3. Company Financials
- 12.1.9.4. SWOT Analysis
- 12.1.10 Yabang Pharmacy
- 12.1.10.1. Company Overview
- 12.1.10.2. Products
- 12.1.10.3. Company Financials
- 12.1.10.4. SWOT Analysis
- 12.1.1 Eli Lilly
- 12.2. Market Entropy
- 12.2.1 Company's Key Areas Served
- 12.2.2 Recent Developments
- 12.3. Company Market Share Analysis 2025
- 12.3.1 Top 5 Companies Market Share Analysis
- 12.3.2 Top 3 Companies Market Share Analysis
- 12.4. List of Potential Customers
- 13. Research Methodology
List of Figures
- Figure 1: Global Erectile Dysfunction Revenue Breakdown (undefined, %) by Region 2025 & 2033
- Figure 2: Global Erectile Dysfunction Volume Breakdown (K, %) by Region 2025 & 2033
- Figure 3: North America Erectile Dysfunction Revenue (undefined), by Application 2025 & 2033
- Figure 4: North America Erectile Dysfunction Volume (K), by Application 2025 & 2033
- Figure 5: North America Erectile Dysfunction Revenue Share (%), by Application 2025 & 2033
- Figure 6: North America Erectile Dysfunction Volume Share (%), by Application 2025 & 2033
- Figure 7: North America Erectile Dysfunction Revenue (undefined), by Types 2025 & 2033
- Figure 8: North America Erectile Dysfunction Volume (K), by Types 2025 & 2033
- Figure 9: North America Erectile Dysfunction Revenue Share (%), by Types 2025 & 2033
- Figure 10: North America Erectile Dysfunction Volume Share (%), by Types 2025 & 2033
- Figure 11: North America Erectile Dysfunction Revenue (undefined), by Country 2025 & 2033
- Figure 12: North America Erectile Dysfunction Volume (K), by Country 2025 & 2033
- Figure 13: North America Erectile Dysfunction Revenue Share (%), by Country 2025 & 2033
- Figure 14: North America Erectile Dysfunction Volume Share (%), by Country 2025 & 2033
- Figure 15: South America Erectile Dysfunction Revenue (undefined), by Application 2025 & 2033
- Figure 16: South America Erectile Dysfunction Volume (K), by Application 2025 & 2033
- Figure 17: South America Erectile Dysfunction Revenue Share (%), by Application 2025 & 2033
- Figure 18: South America Erectile Dysfunction Volume Share (%), by Application 2025 & 2033
- Figure 19: South America Erectile Dysfunction Revenue (undefined), by Types 2025 & 2033
- Figure 20: South America Erectile Dysfunction Volume (K), by Types 2025 & 2033
- Figure 21: South America Erectile Dysfunction Revenue Share (%), by Types 2025 & 2033
- Figure 22: South America Erectile Dysfunction Volume Share (%), by Types 2025 & 2033
- Figure 23: South America Erectile Dysfunction Revenue (undefined), by Country 2025 & 2033
- Figure 24: South America Erectile Dysfunction Volume (K), by Country 2025 & 2033
- Figure 25: South America Erectile Dysfunction Revenue Share (%), by Country 2025 & 2033
- Figure 26: South America Erectile Dysfunction Volume Share (%), by Country 2025 & 2033
- Figure 27: Europe Erectile Dysfunction Revenue (undefined), by Application 2025 & 2033
- Figure 28: Europe Erectile Dysfunction Volume (K), by Application 2025 & 2033
- Figure 29: Europe Erectile Dysfunction Revenue Share (%), by Application 2025 & 2033
- Figure 30: Europe Erectile Dysfunction Volume Share (%), by Application 2025 & 2033
- Figure 31: Europe Erectile Dysfunction Revenue (undefined), by Types 2025 & 2033
- Figure 32: Europe Erectile Dysfunction Volume (K), by Types 2025 & 2033
- Figure 33: Europe Erectile Dysfunction Revenue Share (%), by Types 2025 & 2033
- Figure 34: Europe Erectile Dysfunction Volume Share (%), by Types 2025 & 2033
- Figure 35: Europe Erectile Dysfunction Revenue (undefined), by Country 2025 & 2033
- Figure 36: Europe Erectile Dysfunction Volume (K), by Country 2025 & 2033
- Figure 37: Europe Erectile Dysfunction Revenue Share (%), by Country 2025 & 2033
- Figure 38: Europe Erectile Dysfunction Volume Share (%), by Country 2025 & 2033
- Figure 39: Middle East & Africa Erectile Dysfunction Revenue (undefined), by Application 2025 & 2033
- Figure 40: Middle East & Africa Erectile Dysfunction Volume (K), by Application 2025 & 2033
- Figure 41: Middle East & Africa Erectile Dysfunction Revenue Share (%), by Application 2025 & 2033
- Figure 42: Middle East & Africa Erectile Dysfunction Volume Share (%), by Application 2025 & 2033
- Figure 43: Middle East & Africa Erectile Dysfunction Revenue (undefined), by Types 2025 & 2033
- Figure 44: Middle East & Africa Erectile Dysfunction Volume (K), by Types 2025 & 2033
- Figure 45: Middle East & Africa Erectile Dysfunction Revenue Share (%), by Types 2025 & 2033
- Figure 46: Middle East & Africa Erectile Dysfunction Volume Share (%), by Types 2025 & 2033
- Figure 47: Middle East & Africa Erectile Dysfunction Revenue (undefined), by Country 2025 & 2033
- Figure 48: Middle East & Africa Erectile Dysfunction Volume (K), by Country 2025 & 2033
- Figure 49: Middle East & Africa Erectile Dysfunction Revenue Share (%), by Country 2025 & 2033
- Figure 50: Middle East & Africa Erectile Dysfunction Volume Share (%), by Country 2025 & 2033
- Figure 51: Asia Pacific Erectile Dysfunction Revenue (undefined), by Application 2025 & 2033
- Figure 52: Asia Pacific Erectile Dysfunction Volume (K), by Application 2025 & 2033
- Figure 53: Asia Pacific Erectile Dysfunction Revenue Share (%), by Application 2025 & 2033
- Figure 54: Asia Pacific Erectile Dysfunction Volume Share (%), by Application 2025 & 2033
- Figure 55: Asia Pacific Erectile Dysfunction Revenue (undefined), by Types 2025 & 2033
- Figure 56: Asia Pacific Erectile Dysfunction Volume (K), by Types 2025 & 2033
- Figure 57: Asia Pacific Erectile Dysfunction Revenue Share (%), by Types 2025 & 2033
- Figure 58: Asia Pacific Erectile Dysfunction Volume Share (%), by Types 2025 & 2033
- Figure 59: Asia Pacific Erectile Dysfunction Revenue (undefined), by Country 2025 & 2033
- Figure 60: Asia Pacific Erectile Dysfunction Volume (K), by Country 2025 & 2033
- Figure 61: Asia Pacific Erectile Dysfunction Revenue Share (%), by Country 2025 & 2033
- Figure 62: Asia Pacific Erectile Dysfunction Volume Share (%), by Country 2025 & 2033
List of Tables
- Table 1: Global Erectile Dysfunction Revenue undefined Forecast, by Application 2020 & 2033
- Table 2: Global Erectile Dysfunction Volume K Forecast, by Application 2020 & 2033
- Table 3: Global Erectile Dysfunction Revenue undefined Forecast, by Types 2020 & 2033
- Table 4: Global Erectile Dysfunction Volume K Forecast, by Types 2020 & 2033
- Table 5: Global Erectile Dysfunction Revenue undefined Forecast, by Region 2020 & 2033
- Table 6: Global Erectile Dysfunction Volume K Forecast, by Region 2020 & 2033
- Table 7: Global Erectile Dysfunction Revenue undefined Forecast, by Application 2020 & 2033
- Table 8: Global Erectile Dysfunction Volume K Forecast, by Application 2020 & 2033
- Table 9: Global Erectile Dysfunction Revenue undefined Forecast, by Types 2020 & 2033
- Table 10: Global Erectile Dysfunction Volume K Forecast, by Types 2020 & 2033
- Table 11: Global Erectile Dysfunction Revenue undefined Forecast, by Country 2020 & 2033
- Table 12: Global Erectile Dysfunction Volume K Forecast, by Country 2020 & 2033
- Table 13: United States Erectile Dysfunction Revenue (undefined) Forecast, by Application 2020 & 2033
- Table 14: United States Erectile Dysfunction Volume (K) Forecast, by Application 2020 & 2033
- Table 15: Canada Erectile Dysfunction Revenue (undefined) Forecast, by Application 2020 & 2033
- Table 16: Canada Erectile Dysfunction Volume (K) Forecast, by Application 2020 & 2033
- Table 17: Mexico Erectile Dysfunction Revenue (undefined) Forecast, by Application 2020 & 2033
- Table 18: Mexico Erectile Dysfunction Volume (K) Forecast, by Application 2020 & 2033
- Table 19: Global Erectile Dysfunction Revenue undefined Forecast, by Application 2020 & 2033
- Table 20: Global Erectile Dysfunction Volume K Forecast, by Application 2020 & 2033
- Table 21: Global Erectile Dysfunction Revenue undefined Forecast, by Types 2020 & 2033
- Table 22: Global Erectile Dysfunction Volume K Forecast, by Types 2020 & 2033
- Table 23: Global Erectile Dysfunction Revenue undefined Forecast, by Country 2020 & 2033
- Table 24: Global Erectile Dysfunction Volume K Forecast, by Country 2020 & 2033
- Table 25: Brazil Erectile Dysfunction Revenue (undefined) Forecast, by Application 2020 & 2033
- Table 26: Brazil Erectile Dysfunction Volume (K) Forecast, by Application 2020 & 2033
- Table 27: Argentina Erectile Dysfunction Revenue (undefined) Forecast, by Application 2020 & 2033
- Table 28: Argentina Erectile Dysfunction Volume (K) Forecast, by Application 2020 & 2033
- Table 29: Rest of South America Erectile Dysfunction Revenue (undefined) Forecast, by Application 2020 & 2033
- Table 30: Rest of South America Erectile Dysfunction Volume (K) Forecast, by Application 2020 & 2033
- Table 31: Global Erectile Dysfunction Revenue undefined Forecast, by Application 2020 & 2033
- Table 32: Global Erectile Dysfunction Volume K Forecast, by Application 2020 & 2033
- Table 33: Global Erectile Dysfunction Revenue undefined Forecast, by Types 2020 & 2033
- Table 34: Global Erectile Dysfunction Volume K Forecast, by Types 2020 & 2033
- Table 35: Global Erectile Dysfunction Revenue undefined Forecast, by Country 2020 & 2033
- Table 36: Global Erectile Dysfunction Volume K Forecast, by Country 2020 & 2033
- Table 37: United Kingdom Erectile Dysfunction Revenue (undefined) Forecast, by Application 2020 & 2033
- Table 38: United Kingdom Erectile Dysfunction Volume (K) Forecast, by Application 2020 & 2033
- Table 39: Germany Erectile Dysfunction Revenue (undefined) Forecast, by Application 2020 & 2033
- Table 40: Germany Erectile Dysfunction Volume (K) Forecast, by Application 2020 & 2033
- Table 41: France Erectile Dysfunction Revenue (undefined) Forecast, by Application 2020 & 2033
- Table 42: France Erectile Dysfunction Volume (K) Forecast, by Application 2020 & 2033
- Table 43: Italy Erectile Dysfunction Revenue (undefined) Forecast, by Application 2020 & 2033
- Table 44: Italy Erectile Dysfunction Volume (K) Forecast, by Application 2020 & 2033
- Table 45: Spain Erectile Dysfunction Revenue (undefined) Forecast, by Application 2020 & 2033
- Table 46: Spain Erectile Dysfunction Volume (K) Forecast, by Application 2020 & 2033
- Table 47: Russia Erectile Dysfunction Revenue (undefined) Forecast, by Application 2020 & 2033
- Table 48: Russia Erectile Dysfunction Volume (K) Forecast, by Application 2020 & 2033
- Table 49: Benelux Erectile Dysfunction Revenue (undefined) Forecast, by Application 2020 & 2033
- Table 50: Benelux Erectile Dysfunction Volume (K) Forecast, by Application 2020 & 2033
- Table 51: Nordics Erectile Dysfunction Revenue (undefined) Forecast, by Application 2020 & 2033
- Table 52: Nordics Erectile Dysfunction Volume (K) Forecast, by Application 2020 & 2033
- Table 53: Rest of Europe Erectile Dysfunction Revenue (undefined) Forecast, by Application 2020 & 2033
- Table 54: Rest of Europe Erectile Dysfunction Volume (K) Forecast, by Application 2020 & 2033
- Table 55: Global Erectile Dysfunction Revenue undefined Forecast, by Application 2020 & 2033
- Table 56: Global Erectile Dysfunction Volume K Forecast, by Application 2020 & 2033
- Table 57: Global Erectile Dysfunction Revenue undefined Forecast, by Types 2020 & 2033
- Table 58: Global Erectile Dysfunction Volume K Forecast, by Types 2020 & 2033
- Table 59: Global Erectile Dysfunction Revenue undefined Forecast, by Country 2020 & 2033
- Table 60: Global Erectile Dysfunction Volume K Forecast, by Country 2020 & 2033
- Table 61: Turkey Erectile Dysfunction Revenue (undefined) Forecast, by Application 2020 & 2033
- Table 62: Turkey Erectile Dysfunction Volume (K) Forecast, by Application 2020 & 2033
- Table 63: Israel Erectile Dysfunction Revenue (undefined) Forecast, by Application 2020 & 2033
- Table 64: Israel Erectile Dysfunction Volume (K) Forecast, by Application 2020 & 2033
- Table 65: GCC Erectile Dysfunction Revenue (undefined) Forecast, by Application 2020 & 2033
- Table 66: GCC Erectile Dysfunction Volume (K) Forecast, by Application 2020 & 2033
- Table 67: North Africa Erectile Dysfunction Revenue (undefined) Forecast, by Application 2020 & 2033
- Table 68: North Africa Erectile Dysfunction Volume (K) Forecast, by Application 2020 & 2033
- Table 69: South Africa Erectile Dysfunction Revenue (undefined) Forecast, by Application 2020 & 2033
- Table 70: South Africa Erectile Dysfunction Volume (K) Forecast, by Application 2020 & 2033
- Table 71: Rest of Middle East & Africa Erectile Dysfunction Revenue (undefined) Forecast, by Application 2020 & 2033
- Table 72: Rest of Middle East & Africa Erectile Dysfunction Volume (K) Forecast, by Application 2020 & 2033
- Table 73: Global Erectile Dysfunction Revenue undefined Forecast, by Application 2020 & 2033
- Table 74: Global Erectile Dysfunction Volume K Forecast, by Application 2020 & 2033
- Table 75: Global Erectile Dysfunction Revenue undefined Forecast, by Types 2020 & 2033
- Table 76: Global Erectile Dysfunction Volume K Forecast, by Types 2020 & 2033
- Table 77: Global Erectile Dysfunction Revenue undefined Forecast, by Country 2020 & 2033
- Table 78: Global Erectile Dysfunction Volume K Forecast, by Country 2020 & 2033
- Table 79: China Erectile Dysfunction Revenue (undefined) Forecast, by Application 2020 & 2033
- Table 80: China Erectile Dysfunction Volume (K) Forecast, by Application 2020 & 2033
- Table 81: India Erectile Dysfunction Revenue (undefined) Forecast, by Application 2020 & 2033
- Table 82: India Erectile Dysfunction Volume (K) Forecast, by Application 2020 & 2033
- Table 83: Japan Erectile Dysfunction Revenue (undefined) Forecast, by Application 2020 & 2033
- Table 84: Japan Erectile Dysfunction Volume (K) Forecast, by Application 2020 & 2033
- Table 85: South Korea Erectile Dysfunction Revenue (undefined) Forecast, by Application 2020 & 2033
- Table 86: South Korea Erectile Dysfunction Volume (K) Forecast, by Application 2020 & 2033
- Table 87: ASEAN Erectile Dysfunction Revenue (undefined) Forecast, by Application 2020 & 2033
- Table 88: ASEAN Erectile Dysfunction Volume (K) Forecast, by Application 2020 & 2033
- Table 89: Oceania Erectile Dysfunction Revenue (undefined) Forecast, by Application 2020 & 2033
- Table 90: Oceania Erectile Dysfunction Volume (K) Forecast, by Application 2020 & 2033
- Table 91: Rest of Asia Pacific Erectile Dysfunction Revenue (undefined) Forecast, by Application 2020 & 2033
- Table 92: Rest of Asia Pacific Erectile Dysfunction Volume (K) Forecast, by Application 2020 & 2033
Frequently Asked Questions
1. What is the projected Compound Annual Growth Rate (CAGR) of the Erectile Dysfunction?
The projected CAGR is approximately 11.37%.
2. Which companies are prominent players in the Erectile Dysfunction?
Key companies in the market include Eli Lilly, Pfizer, Bayer, BaiYunShan General Factory, S.K. Chemicals, Teva Pharma, Dong-A ST, Petros Pharmaceuticals, Seoul Pharma, Yabang Pharmacy.
3. What are the main segments of the Erectile Dysfunction?
The market segments include Application, Types.
4. Can you provide details about the market size?
The market size is estimated to be USD XXX N/A as of 2022.
5. What are some drivers contributing to market growth?
N/A
6. What are the notable trends driving market growth?
N/A
7. Are there any restraints impacting market growth?
N/A
8. Can you provide examples of recent developments in the market?
N/A
9. What pricing options are available for accessing the report?
Pricing options include single-user, multi-user, and enterprise licenses priced at USD 3350.00, USD 5025.00, and USD 6700.00 respectively.
10. Is the market size provided in terms of value or volume?
The market size is provided in terms of value, measured in N/A and volume, measured in K.
11. Are there any specific market keywords associated with the report?
Yes, the market keyword associated with the report is "Erectile Dysfunction," which aids in identifying and referencing the specific market segment covered.
12. How do I determine which pricing option suits my needs best?
The pricing options vary based on user requirements and access needs. Individual users may opt for single-user licenses, while businesses requiring broader access may choose multi-user or enterprise licenses for cost-effective access to the report.
13. Are there any additional resources or data provided in the Erectile Dysfunction report?
While the report offers comprehensive insights, it's advisable to review the specific contents or supplementary materials provided to ascertain if additional resources or data are available.
14. How can I stay updated on further developments or reports in the Erectile Dysfunction?
To stay informed about further developments, trends, and reports in the Erectile Dysfunction, consider subscribing to industry newsletters, following relevant companies and organizations, or regularly checking reputable industry news sources and publications.
Methodology
Step 1 - Identification of Relevant Samples Size from Population Database


Step 2 - Approaches for Defining Global Market Size (Value, Volume* & Price*)

Note*: In applicable scenarios
Step 3 - Data Sources
Primary Research
- Web Analytics
- Survey Reports
- Research Institute
- Latest Research Reports
- Opinion Leaders
Secondary Research
- Annual Reports
- White Paper
- Latest Press Release
- Industry Association
- Paid Database
- Investor Presentations

Step 4 - Data Triangulation
Involves using different sources of information in order to increase the validity of a study
These sources are likely to be stakeholders in a program - participants, other researchers, program staff, other community members, and so on.
Then we put all data in single framework & apply various statistical tools to find out the dynamic on the market.
During the analysis stage, feedback from the stakeholder groups would be compared to determine areas of agreement as well as areas of divergence