
Key Insights
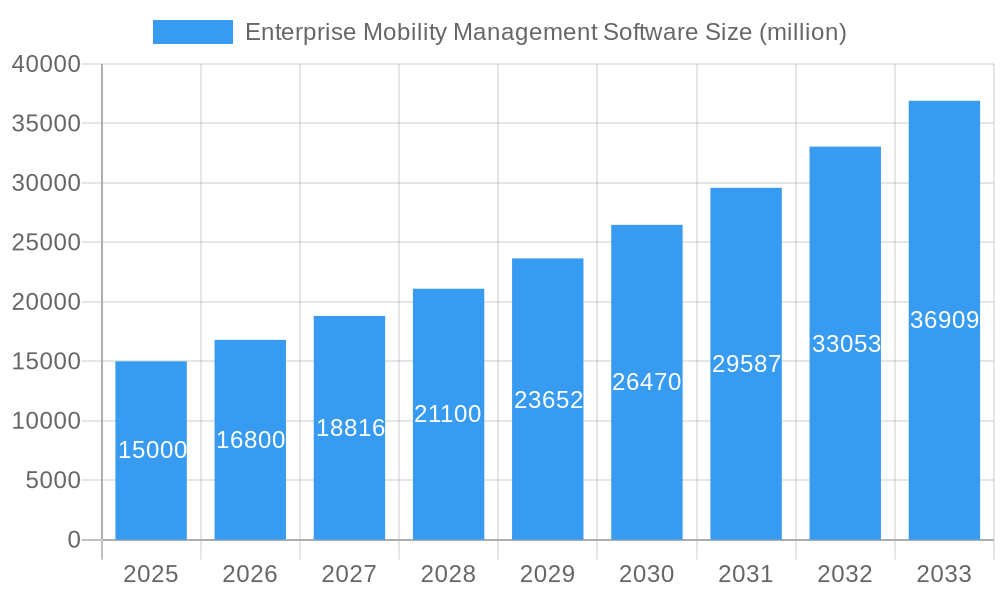
The Enterprise Mobility Management (EMM) software market is experiencing robust growth, driven by the increasing adoption of mobile devices in the workplace and the need for secure and efficient management of these devices. The market, estimated at $15 billion in 2025, is projected to exhibit a Compound Annual Growth Rate (CAGR) of 12% from 2025 to 2033, reaching approximately $45 billion by 2033. This growth is fueled by several key factors, including the rising demand for secure remote access solutions, the increasing adoption of Bring Your Own Device (BYOD) policies, and the growing need to comply with stringent data privacy regulations. Furthermore, the ongoing expansion of cloud-based EMM solutions, offering scalability and cost-effectiveness, significantly contributes to market expansion. The market is segmented by deployment type (cloud, on-premise), device type (smartphones, tablets, laptops), and industry vertical (BFSI, healthcare, retail, etc.), with each segment exhibiting unique growth trajectories. Competitive intensity is high, with established players like VMware, Microsoft, and IBM competing with specialized EMM providers such as Jamf Pro, SOTI, and MobileIron. The market landscape is dynamic, with ongoing innovation in areas such as AI-powered security features, advanced analytics, and integration with other enterprise software solutions.

Enterprise Mobility Management Software Market Size (In Billion)

The key restraints on market growth include the complexities of integrating EMM solutions with existing IT infrastructure, the high initial investment costs associated with deployment, and concerns regarding data security and privacy. However, these challenges are being addressed through the development of user-friendly interfaces, cost-effective cloud-based solutions, and robust security protocols. The future of the EMM market is characterized by increased sophistication in managing diverse endpoints, improved user experience, and stronger integration with other enterprise IT solutions. The market will likely see further consolidation as companies strive to offer comprehensive platforms encompassing various aspects of endpoint management. Future growth will be particularly driven by the burgeoning adoption of 5G technology and the Internet of Things (IoT) creating a greater need for effective management and security of connected devices.
Enterprise Mobility Management Software Company Market Share
Enterprise Mobility Management (EMM) Software Market Report: 2019-2033
This comprehensive report provides a detailed analysis of the Enterprise Mobility Management (EMM) Software market, encompassing market dynamics, growth trends, regional segmentation, product landscape, key players, and future outlook. The study period covers 2019-2033, with a base year of 2025 and a forecast period of 2025-2033. The report is designed for industry professionals, investors, and strategic decision-makers seeking a deep understanding of this rapidly evolving market. The market size is projected to reach xx million units by 2033, exhibiting a robust CAGR of xx% during the forecast period.
Enterprise Mobility Management Software Market Dynamics & Structure
The Enterprise Mobility Management (EMM) Software market is characterized by a moderately concentrated structure with several major players holding significant market share. The market is driven by technological innovations such as AI-powered security, advanced analytics, and seamless integration with cloud platforms. Regulatory frameworks like GDPR and CCPA significantly influence security protocols and data management practices. Competitive substitutes include various bring-your-own-device (BYOD) management solutions and custom-developed internal systems. The end-user demographic encompasses large enterprises, SMEs, and government agencies across various sectors. M&A activities have been moderate, with xx major deals recorded during the historical period (2019-2024).
- Market Concentration: High, with top 5 players holding approximately xx% market share in 2025.
- Technological Innovation Drivers: AI-powered security, automation, cloud integration, and enhanced analytics.
- Regulatory Frameworks: GDPR, CCPA, and industry-specific compliance mandates influence market growth and security features.
- Competitive Substitutes: DIY solutions, open-source platforms, and niche BYOD management tools.
- End-User Demographics: Large enterprises, SMEs, government agencies, and healthcare organizations.
- M&A Trends: xx major acquisitions and mergers observed from 2019 to 2024. The value of these deals totaled approximately xx million USD.
Enterprise Mobility Management Software Growth Trends & Insights
The EMM Software market experienced significant growth during the historical period (2019-2024), fueled by the increasing adoption of mobile devices in the workplace and the need for enhanced security and management capabilities. Market size expanded from xx million units in 2019 to xx million units in 2024, exhibiting a CAGR of xx%. This growth is projected to continue throughout the forecast period (2025-2033), driven by factors like the rise of remote work, the adoption of 5G technology, and the increasing sophistication of cyber threats. The market penetration rate is expected to increase from xx% in 2024 to xx% by 2033. Technological disruptions such as the proliferation of IoT devices and the increasing adoption of cloud-based solutions are shaping consumer behavior, leading to greater demand for flexible and scalable EMM solutions.
Dominant Regions, Countries, or Segments in Enterprise Mobility Management Software
North America currently dominates the EMM Software market, holding the largest market share due to factors including early adoption of technology, strong presence of major technology companies, and robust IT infrastructure. Europe is also a significant market, with growth driven by increasing digitalization and stringent data privacy regulations. The Asia-Pacific region exhibits significant growth potential driven by rapid economic development and expanding mobile device adoption.
- Key Drivers in North America: Strong IT infrastructure, high technological adoption rates, and presence of major tech companies.
- Key Drivers in Europe: Increasing digitalization, stringent data protection regulations, and high level of IT security awareness.
- Key Drivers in Asia-Pacific: Rapid economic growth, expanding mobile device usage, and growing awareness of cybersecurity threats.
- Market Share (2025): North America (xx%), Europe (xx%), Asia-Pacific (xx%), Rest of World (xx%).
Enterprise Mobility Management Software Product Landscape
EMM software solutions offer a wide range of functionalities, including mobile device management (MDM), mobile application management (MAM), and enterprise mobility management (EMM). Recent innovations focus on advanced security features like AI-powered threat detection, improved user experience through intuitive interfaces, and robust integration with various enterprise systems. Key performance indicators (KPIs) include device compliance rates, security incident response times, and user satisfaction levels. Unique selling propositions (USPs) often include advanced analytics dashboards, customizable security policies, and seamless cross-platform compatibility.
Key Drivers, Barriers & Challenges in Enterprise Mobility Management Software
Key Drivers:
- Increased mobile workforce and BYOD adoption.
- Growing need for enhanced data security and compliance.
- Demand for improved employee productivity and efficiency.
- Rise of cloud-based solutions and mobile-first strategies.
Key Barriers and Challenges:
- High initial investment costs and ongoing maintenance expenses.
- Complexity in integrating EMM solutions with existing IT infrastructure.
- Concerns about data privacy and security breaches.
- Difficulty in managing diverse device ecosystems. The cost associated with this has a notable impact on market growth, projected to negatively affect growth by xx% over the forecast period.
Emerging Opportunities in Enterprise Mobility Management Software
Emerging opportunities include the integration of EMM with IoT device management, the increasing adoption of AI and machine learning for enhanced security and automation, and the expansion into untapped markets like the healthcare and education sectors. The development of specialized EMM solutions for specific industries will also create significant growth avenues. Demand for improved user experience and simplified management tools presents further opportunities.
Growth Accelerators in the Enterprise Mobility Management Software Industry
Strategic partnerships between EMM vendors and cloud service providers will accelerate market growth. Technological advancements in areas like AI, blockchain, and 5G technology will further enhance the capabilities of EMM solutions. Expansion into new geographic markets, especially in developing economies, will also drive significant growth. Furthermore, the increasing adoption of zero-trust security models is creating new opportunities for EMM vendors.
Key Players Shaping the Enterprise Mobility Management Software Market
Notable Milestones in Enterprise Mobility Management Software Sector
- 2020: Increased focus on remote work capabilities due to the COVID-19 pandemic.
- 2021: Several key players launched updated platforms with enhanced security and AI features.
- 2022: A significant increase in investment in EMM solutions across various industries.
- 2023: Several mergers and acquisitions aimed at expanding market share and product portfolios.
- 2024: Release of advanced EMM solutions supporting 5G networks and IoT device management.
In-Depth Enterprise Mobility Management Software Market Outlook
The future of the EMM software market is bright, with continued growth expected throughout the forecast period. Technological advancements, strategic partnerships, and expanding market opportunities will drive significant growth. The focus on enhanced security, user experience, and integration with emerging technologies such as AI and IoT will shape the market landscape. Companies that successfully adapt to changing market dynamics and provide innovative solutions will be well-positioned for long-term success.
Enterprise Mobility Management Software Segmentation
-
1. Application
- 1.1. Large Enterprises(1000+ Users)
- 1.2. Medium-Sized Enterprise(499-1000 Users)
- 1.3. Small Enterprises(1-499 Users)
-
2. Types
- 2.1. iOS
- 2.2. Android
- 2.3. Windows
- 2.4. Others
Enterprise Mobility Management Software Segmentation By Geography
-
1. North America
- 1.1. United States
- 1.2. Canada
- 1.3. Mexico
-
2. South America
- 2.1. Brazil
- 2.2. Argentina
- 2.3. Rest of South America
-
3. Europe
- 3.1. United Kingdom
- 3.2. Germany
- 3.3. France
- 3.4. Italy
- 3.5. Spain
- 3.6. Russia
- 3.7. Benelux
- 3.8. Nordics
- 3.9. Rest of Europe
-
4. Middle East & Africa
- 4.1. Turkey
- 4.2. Israel
- 4.3. GCC
- 4.4. North Africa
- 4.5. South Africa
- 4.6. Rest of Middle East & Africa
-
5. Asia Pacific
- 5.1. China
- 5.2. India
- 5.3. Japan
- 5.4. South Korea
- 5.5. ASEAN
- 5.6. Oceania
- 5.7. Rest of Asia Pacific

Enterprise Mobility Management Software Regional Market Share
Geographic Coverage of Enterprise Mobility Management Software
Enterprise Mobility Management Software REPORT HIGHLIGHTS
| Aspects | Details |
|---|---|
| Study Period | 2020-2034 |
| Base Year | 2025 |
| Estimated Year | 2026 |
| Forecast Period | 2026-2034 |
| Historical Period | 2020-2025 |
| Growth Rate | CAGR of XX% from 2020-2034 |
| Segmentation |
|
Table of Contents
- 1. Introduction
- 1.1. Research Scope
- 1.2. Market Segmentation
- 1.3. Research Methodology
- 1.4. Definitions and Assumptions
- 2. Executive Summary
- 2.1. Introduction
- 3. Market Dynamics
- 3.1. Introduction
- 3.2. Market Drivers
- 3.3. Market Restrains
- 3.4. Market Trends
- 4. Market Factor Analysis
- 4.1. Porters Five Forces
- 4.2. Supply/Value Chain
- 4.3. PESTEL analysis
- 4.4. Market Entropy
- 4.5. Patent/Trademark Analysis
- 5. Global Enterprise Mobility Management Software Analysis, Insights and Forecast, 2020-2032
- 5.1. Market Analysis, Insights and Forecast - by Application
- 5.1.1. Large Enterprises(1000+ Users)
- 5.1.2. Medium-Sized Enterprise(499-1000 Users)
- 5.1.3. Small Enterprises(1-499 Users)
- 5.2. Market Analysis, Insights and Forecast - by Types
- 5.2.1. iOS
- 5.2.2. Android
- 5.2.3. Windows
- 5.2.4. Others
- 5.3. Market Analysis, Insights and Forecast - by Region
- 5.3.1. North America
- 5.3.2. South America
- 5.3.3. Europe
- 5.3.4. Middle East & Africa
- 5.3.5. Asia Pacific
- 5.1. Market Analysis, Insights and Forecast - by Application
- 6. North America Enterprise Mobility Management Software Analysis, Insights and Forecast, 2020-2032
- 6.1. Market Analysis, Insights and Forecast - by Application
- 6.1.1. Large Enterprises(1000+ Users)
- 6.1.2. Medium-Sized Enterprise(499-1000 Users)
- 6.1.3. Small Enterprises(1-499 Users)
- 6.2. Market Analysis, Insights and Forecast - by Types
- 6.2.1. iOS
- 6.2.2. Android
- 6.2.3. Windows
- 6.2.4. Others
- 6.1. Market Analysis, Insights and Forecast - by Application
- 7. South America Enterprise Mobility Management Software Analysis, Insights and Forecast, 2020-2032
- 7.1. Market Analysis, Insights and Forecast - by Application
- 7.1.1. Large Enterprises(1000+ Users)
- 7.1.2. Medium-Sized Enterprise(499-1000 Users)
- 7.1.3. Small Enterprises(1-499 Users)
- 7.2. Market Analysis, Insights and Forecast - by Types
- 7.2.1. iOS
- 7.2.2. Android
- 7.2.3. Windows
- 7.2.4. Others
- 7.1. Market Analysis, Insights and Forecast - by Application
- 8. Europe Enterprise Mobility Management Software Analysis, Insights and Forecast, 2020-2032
- 8.1. Market Analysis, Insights and Forecast - by Application
- 8.1.1. Large Enterprises(1000+ Users)
- 8.1.2. Medium-Sized Enterprise(499-1000 Users)
- 8.1.3. Small Enterprises(1-499 Users)
- 8.2. Market Analysis, Insights and Forecast - by Types
- 8.2.1. iOS
- 8.2.2. Android
- 8.2.3. Windows
- 8.2.4. Others
- 8.1. Market Analysis, Insights and Forecast - by Application
- 9. Middle East & Africa Enterprise Mobility Management Software Analysis, Insights and Forecast, 2020-2032
- 9.1. Market Analysis, Insights and Forecast - by Application
- 9.1.1. Large Enterprises(1000+ Users)
- 9.1.2. Medium-Sized Enterprise(499-1000 Users)
- 9.1.3. Small Enterprises(1-499 Users)
- 9.2. Market Analysis, Insights and Forecast - by Types
- 9.2.1. iOS
- 9.2.2. Android
- 9.2.3. Windows
- 9.2.4. Others
- 9.1. Market Analysis, Insights and Forecast - by Application
- 10. Asia Pacific Enterprise Mobility Management Software Analysis, Insights and Forecast, 2020-2032
- 10.1. Market Analysis, Insights and Forecast - by Application
- 10.1.1. Large Enterprises(1000+ Users)
- 10.1.2. Medium-Sized Enterprise(499-1000 Users)
- 10.1.3. Small Enterprises(1-499 Users)
- 10.2. Market Analysis, Insights and Forecast - by Types
- 10.2.1. iOS
- 10.2.2. Android
- 10.2.3. Windows
- 10.2.4. Others
- 10.1. Market Analysis, Insights and Forecast - by Application
- 11. Competitive Analysis
- 11.1. Global Market Share Analysis 2025
- 11.2. Company Profiles
- 11.2.1 Addigy
- 11.2.1.1. Overview
- 11.2.1.2. Products
- 11.2.1.3. SWOT Analysis
- 11.2.1.4. Recent Developments
- 11.2.1.5. Financials (Based on Availability)
- 11.2.2 Appaloosa
- 11.2.2.1. Overview
- 11.2.2.2. Products
- 11.2.2.3. SWOT Analysis
- 11.2.2.4. Recent Developments
- 11.2.2.5. Financials (Based on Availability)
- 11.2.3 Applivery
- 11.2.3.1. Overview
- 11.2.3.2. Products
- 11.2.3.3. SWOT Analysis
- 11.2.3.4. Recent Developments
- 11.2.3.5. Financials (Based on Availability)
- 11.2.4 BlackBerry
- 11.2.4.1. Overview
- 11.2.4.2. Products
- 11.2.4.3. SWOT Analysis
- 11.2.4.4. Recent Developments
- 11.2.4.5. Financials (Based on Availability)
- 11.2.5 FileWave
- 11.2.5.1. Overview
- 11.2.5.2. Products
- 11.2.5.3. SWOT Analysis
- 11.2.5.4. Recent Developments
- 11.2.5.5. Financials (Based on Availability)
- 11.2.6 Fleetsmith
- 11.2.6.1. Overview
- 11.2.6.2. Products
- 11.2.6.3. SWOT Analysis
- 11.2.6.4. Recent Developments
- 11.2.6.5. Financials (Based on Availability)
- 11.2.7 Hexnode
- 11.2.7.1. Overview
- 11.2.7.2. Products
- 11.2.7.3. SWOT Analysis
- 11.2.7.4. Recent Developments
- 11.2.7.5. Financials (Based on Availability)
- 11.2.8 IBM
- 11.2.8.1. Overview
- 11.2.8.2. Products
- 11.2.8.3. SWOT Analysis
- 11.2.8.4. Recent Developments
- 11.2.8.5. Financials (Based on Availability)
- 11.2.9 Ivanti
- 11.2.9.1. Overview
- 11.2.9.2. Products
- 11.2.9.3. SWOT Analysis
- 11.2.9.4. Recent Developments
- 11.2.9.5. Financials (Based on Availability)
- 11.2.10 Jamf Pro
- 11.2.10.1. Overview
- 11.2.10.2. Products
- 11.2.10.3. SWOT Analysis
- 11.2.10.4. Recent Developments
- 11.2.10.5. Financials (Based on Availability)
- 11.2.11 ManageEngine
- 11.2.11.1. Overview
- 11.2.11.2. Products
- 11.2.11.3. SWOT Analysis
- 11.2.11.4. Recent Developments
- 11.2.11.5. Financials (Based on Availability)
- 11.2.12 Meraki Systems Manager
- 11.2.12.1. Overview
- 11.2.12.2. Products
- 11.2.12.3. SWOT Analysis
- 11.2.12.4. Recent Developments
- 11.2.12.5. Financials (Based on Availability)
- 11.2.13 Microsoft
- 11.2.13.1. Overview
- 11.2.13.2. Products
- 11.2.13.3. SWOT Analysis
- 11.2.13.4. Recent Developments
- 11.2.13.5. Financials (Based on Availability)
- 11.2.14 MobileIron
- 11.2.14.1. Overview
- 11.2.14.2. Products
- 11.2.14.3. SWOT Analysis
- 11.2.14.4. Recent Developments
- 11.2.14.5. Financials (Based on Availability)
- 11.2.15 Scalefusion (Formerly MobiLock Pro)
- 11.2.15.1. Overview
- 11.2.15.2. Products
- 11.2.15.3. SWOT Analysis
- 11.2.15.4. Recent Developments
- 11.2.15.5. Financials (Based on Availability)
- 11.2.16 Sophos Mobile
- 11.2.16.1. Overview
- 11.2.16.2. Products
- 11.2.16.3. SWOT Analysis
- 11.2.16.4. Recent Developments
- 11.2.16.5. Financials (Based on Availability)
- 11.2.17 SOTI MobiControl
- 11.2.17.1. Overview
- 11.2.17.2. Products
- 11.2.17.3. SWOT Analysis
- 11.2.17.4. Recent Developments
- 11.2.17.5. Financials (Based on Availability)
- 11.2.18 VMware
- 11.2.18.1. Overview
- 11.2.18.2. Products
- 11.2.18.3. SWOT Analysis
- 11.2.18.4. Recent Developments
- 11.2.18.5. Financials (Based on Availability)
- 11.2.1 Addigy
List of Figures
- Figure 1: Global Enterprise Mobility Management Software Revenue Breakdown (million, %) by Region 2025 & 2033
- Figure 2: North America Enterprise Mobility Management Software Revenue (million), by Application 2025 & 2033
- Figure 3: North America Enterprise Mobility Management Software Revenue Share (%), by Application 2025 & 2033
- Figure 4: North America Enterprise Mobility Management Software Revenue (million), by Types 2025 & 2033
- Figure 5: North America Enterprise Mobility Management Software Revenue Share (%), by Types 2025 & 2033
- Figure 6: North America Enterprise Mobility Management Software Revenue (million), by Country 2025 & 2033
- Figure 7: North America Enterprise Mobility Management Software Revenue Share (%), by Country 2025 & 2033
- Figure 8: South America Enterprise Mobility Management Software Revenue (million), by Application 2025 & 2033
- Figure 9: South America Enterprise Mobility Management Software Revenue Share (%), by Application 2025 & 2033
- Figure 10: South America Enterprise Mobility Management Software Revenue (million), by Types 2025 & 2033
- Figure 11: South America Enterprise Mobility Management Software Revenue Share (%), by Types 2025 & 2033
- Figure 12: South America Enterprise Mobility Management Software Revenue (million), by Country 2025 & 2033
- Figure 13: South America Enterprise Mobility Management Software Revenue Share (%), by Country 2025 & 2033
- Figure 14: Europe Enterprise Mobility Management Software Revenue (million), by Application 2025 & 2033
- Figure 15: Europe Enterprise Mobility Management Software Revenue Share (%), by Application 2025 & 2033
- Figure 16: Europe Enterprise Mobility Management Software Revenue (million), by Types 2025 & 2033
- Figure 17: Europe Enterprise Mobility Management Software Revenue Share (%), by Types 2025 & 2033
- Figure 18: Europe Enterprise Mobility Management Software Revenue (million), by Country 2025 & 2033
- Figure 19: Europe Enterprise Mobility Management Software Revenue Share (%), by Country 2025 & 2033
- Figure 20: Middle East & Africa Enterprise Mobility Management Software Revenue (million), by Application 2025 & 2033
- Figure 21: Middle East & Africa Enterprise Mobility Management Software Revenue Share (%), by Application 2025 & 2033
- Figure 22: Middle East & Africa Enterprise Mobility Management Software Revenue (million), by Types 2025 & 2033
- Figure 23: Middle East & Africa Enterprise Mobility Management Software Revenue Share (%), by Types 2025 & 2033
- Figure 24: Middle East & Africa Enterprise Mobility Management Software Revenue (million), by Country 2025 & 2033
- Figure 25: Middle East & Africa Enterprise Mobility Management Software Revenue Share (%), by Country 2025 & 2033
- Figure 26: Asia Pacific Enterprise Mobility Management Software Revenue (million), by Application 2025 & 2033
- Figure 27: Asia Pacific Enterprise Mobility Management Software Revenue Share (%), by Application 2025 & 2033
- Figure 28: Asia Pacific Enterprise Mobility Management Software Revenue (million), by Types 2025 & 2033
- Figure 29: Asia Pacific Enterprise Mobility Management Software Revenue Share (%), by Types 2025 & 2033
- Figure 30: Asia Pacific Enterprise Mobility Management Software Revenue (million), by Country 2025 & 2033
- Figure 31: Asia Pacific Enterprise Mobility Management Software Revenue Share (%), by Country 2025 & 2033
List of Tables
- Table 1: Global Enterprise Mobility Management Software Revenue million Forecast, by Application 2020 & 2033
- Table 2: Global Enterprise Mobility Management Software Revenue million Forecast, by Types 2020 & 2033
- Table 3: Global Enterprise Mobility Management Software Revenue million Forecast, by Region 2020 & 2033
- Table 4: Global Enterprise Mobility Management Software Revenue million Forecast, by Application 2020 & 2033
- Table 5: Global Enterprise Mobility Management Software Revenue million Forecast, by Types 2020 & 2033
- Table 6: Global Enterprise Mobility Management Software Revenue million Forecast, by Country 2020 & 2033
- Table 7: United States Enterprise Mobility Management Software Revenue (million) Forecast, by Application 2020 & 2033
- Table 8: Canada Enterprise Mobility Management Software Revenue (million) Forecast, by Application 2020 & 2033
- Table 9: Mexico Enterprise Mobility Management Software Revenue (million) Forecast, by Application 2020 & 2033
- Table 10: Global Enterprise Mobility Management Software Revenue million Forecast, by Application 2020 & 2033
- Table 11: Global Enterprise Mobility Management Software Revenue million Forecast, by Types 2020 & 2033
- Table 12: Global Enterprise Mobility Management Software Revenue million Forecast, by Country 2020 & 2033
- Table 13: Brazil Enterprise Mobility Management Software Revenue (million) Forecast, by Application 2020 & 2033
- Table 14: Argentina Enterprise Mobility Management Software Revenue (million) Forecast, by Application 2020 & 2033
- Table 15: Rest of South America Enterprise Mobility Management Software Revenue (million) Forecast, by Application 2020 & 2033
- Table 16: Global Enterprise Mobility Management Software Revenue million Forecast, by Application 2020 & 2033
- Table 17: Global Enterprise Mobility Management Software Revenue million Forecast, by Types 2020 & 2033
- Table 18: Global Enterprise Mobility Management Software Revenue million Forecast, by Country 2020 & 2033
- Table 19: United Kingdom Enterprise Mobility Management Software Revenue (million) Forecast, by Application 2020 & 2033
- Table 20: Germany Enterprise Mobility Management Software Revenue (million) Forecast, by Application 2020 & 2033
- Table 21: France Enterprise Mobility Management Software Revenue (million) Forecast, by Application 2020 & 2033
- Table 22: Italy Enterprise Mobility Management Software Revenue (million) Forecast, by Application 2020 & 2033
- Table 23: Spain Enterprise Mobility Management Software Revenue (million) Forecast, by Application 2020 & 2033
- Table 24: Russia Enterprise Mobility Management Software Revenue (million) Forecast, by Application 2020 & 2033
- Table 25: Benelux Enterprise Mobility Management Software Revenue (million) Forecast, by Application 2020 & 2033
- Table 26: Nordics Enterprise Mobility Management Software Revenue (million) Forecast, by Application 2020 & 2033
- Table 27: Rest of Europe Enterprise Mobility Management Software Revenue (million) Forecast, by Application 2020 & 2033
- Table 28: Global Enterprise Mobility Management Software Revenue million Forecast, by Application 2020 & 2033
- Table 29: Global Enterprise Mobility Management Software Revenue million Forecast, by Types 2020 & 2033
- Table 30: Global Enterprise Mobility Management Software Revenue million Forecast, by Country 2020 & 2033
- Table 31: Turkey Enterprise Mobility Management Software Revenue (million) Forecast, by Application 2020 & 2033
- Table 32: Israel Enterprise Mobility Management Software Revenue (million) Forecast, by Application 2020 & 2033
- Table 33: GCC Enterprise Mobility Management Software Revenue (million) Forecast, by Application 2020 & 2033
- Table 34: North Africa Enterprise Mobility Management Software Revenue (million) Forecast, by Application 2020 & 2033
- Table 35: South Africa Enterprise Mobility Management Software Revenue (million) Forecast, by Application 2020 & 2033
- Table 36: Rest of Middle East & Africa Enterprise Mobility Management Software Revenue (million) Forecast, by Application 2020 & 2033
- Table 37: Global Enterprise Mobility Management Software Revenue million Forecast, by Application 2020 & 2033
- Table 38: Global Enterprise Mobility Management Software Revenue million Forecast, by Types 2020 & 2033
- Table 39: Global Enterprise Mobility Management Software Revenue million Forecast, by Country 2020 & 2033
- Table 40: China Enterprise Mobility Management Software Revenue (million) Forecast, by Application 2020 & 2033
- Table 41: India Enterprise Mobility Management Software Revenue (million) Forecast, by Application 2020 & 2033
- Table 42: Japan Enterprise Mobility Management Software Revenue (million) Forecast, by Application 2020 & 2033
- Table 43: South Korea Enterprise Mobility Management Software Revenue (million) Forecast, by Application 2020 & 2033
- Table 44: ASEAN Enterprise Mobility Management Software Revenue (million) Forecast, by Application 2020 & 2033
- Table 45: Oceania Enterprise Mobility Management Software Revenue (million) Forecast, by Application 2020 & 2033
- Table 46: Rest of Asia Pacific Enterprise Mobility Management Software Revenue (million) Forecast, by Application 2020 & 2033
Frequently Asked Questions
1. What is the projected Compound Annual Growth Rate (CAGR) of the Enterprise Mobility Management Software?
The projected CAGR is approximately XX%.
2. Which companies are prominent players in the Enterprise Mobility Management Software?
Key companies in the market include Addigy, Appaloosa, Applivery, BlackBerry, FileWave, Fleetsmith, Hexnode, IBM, Ivanti, Jamf Pro, ManageEngine, Meraki Systems Manager, Microsoft, MobileIron, Scalefusion (Formerly MobiLock Pro), Sophos Mobile, SOTI MobiControl, VMware.
3. What are the main segments of the Enterprise Mobility Management Software?
The market segments include Application, Types.
4. Can you provide details about the market size?
The market size is estimated to be USD XXX million as of 2022.
5. What are some drivers contributing to market growth?
N/A
6. What are the notable trends driving market growth?
N/A
7. Are there any restraints impacting market growth?
N/A
8. Can you provide examples of recent developments in the market?
N/A
9. What pricing options are available for accessing the report?
Pricing options include single-user, multi-user, and enterprise licenses priced at USD 3350.00, USD 5025.00, and USD 6700.00 respectively.
10. Is the market size provided in terms of value or volume?
The market size is provided in terms of value, measured in million.
11. Are there any specific market keywords associated with the report?
Yes, the market keyword associated with the report is "Enterprise Mobility Management Software," which aids in identifying and referencing the specific market segment covered.
12. How do I determine which pricing option suits my needs best?
The pricing options vary based on user requirements and access needs. Individual users may opt for single-user licenses, while businesses requiring broader access may choose multi-user or enterprise licenses for cost-effective access to the report.
13. Are there any additional resources or data provided in the Enterprise Mobility Management Software report?
While the report offers comprehensive insights, it's advisable to review the specific contents or supplementary materials provided to ascertain if additional resources or data are available.
14. How can I stay updated on further developments or reports in the Enterprise Mobility Management Software?
To stay informed about further developments, trends, and reports in the Enterprise Mobility Management Software, consider subscribing to industry newsletters, following relevant companies and organizations, or regularly checking reputable industry news sources and publications.
Methodology
Step 1 - Identification of Relevant Samples Size from Population Database


Step 2 - Approaches for Defining Global Market Size (Value, Volume* & Price*)

Note*: In applicable scenarios
Step 3 - Data Sources
Primary Research
- Web Analytics
- Survey Reports
- Research Institute
- Latest Research Reports
- Opinion Leaders
Secondary Research
- Annual Reports
- White Paper
- Latest Press Release
- Industry Association
- Paid Database
- Investor Presentations

Step 4 - Data Triangulation
Involves using different sources of information in order to increase the validity of a study
These sources are likely to be stakeholders in a program - participants, other researchers, program staff, other community members, and so on.
Then we put all data in single framework & apply various statistical tools to find out the dynamic on the market.
During the analysis stage, feedback from the stakeholder groups would be compared to determine areas of agreement as well as areas of divergence

