


Key Insights
The global ENT Diagnostic Devices market is projected for substantial growth, anticipated to reach $20.88 billion by 2025, expanding at a Compound Annual Growth Rate (CAGR) of approximately 6.54% through 2033. This growth is attributed to the rising incidence of ear, nose, and throat (ENT) disorders, heightened awareness of early detection, and technological advancements in diagnostic tools. An increasing elderly population, more prone to ENT conditions, further elevates demand. Innovations like AI-driven diagnostics, high-resolution imaging, and telehealth solutions are enhancing accuracy and accessibility. A focus on preventive healthcare and patient-centric procedures also contributes to the adoption of advanced ENT diagnostic equipment.

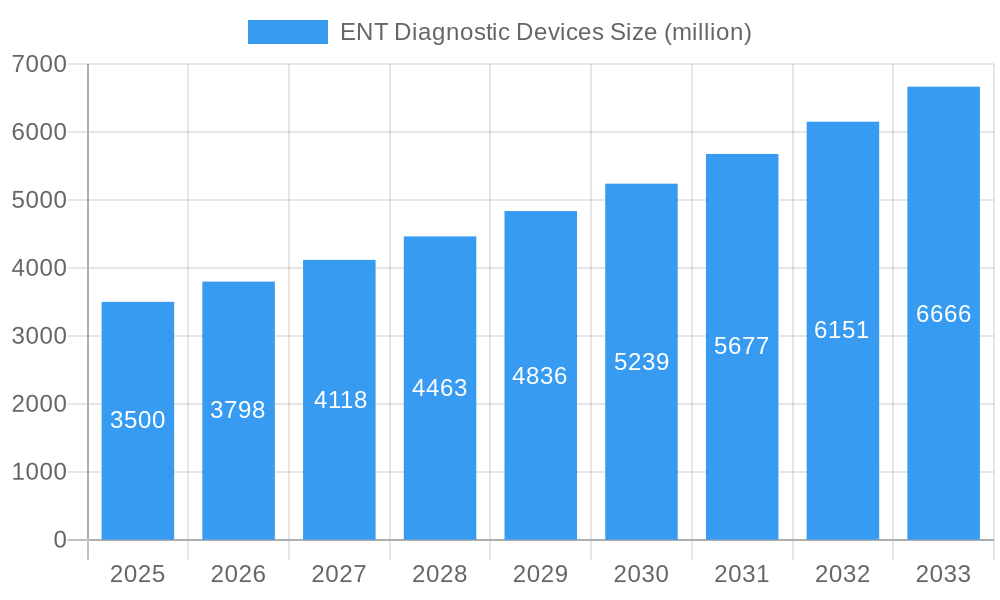
ENT Diagnostic Devices Market Size (In Billion)

Market segmentation highlights key segments. ENT Diagnostic devices command a significant share due to the persistent need for precise condition identification. Within ENT Treatment, powered surgical instruments and RF handpieces are in high demand for minimally invasive procedures. The market features established global leaders such as Medtronic, Karl Storz, and Olympus, alongside innovative emerging companies focused on R&D for novel product launches and market expansion. Geographically, North America and Europe lead due to robust healthcare infrastructure and high patient expenditure. However, the Asia Pacific region is expected to experience the most rapid growth, driven by increasing healthcare investments, a growing patient population, and government initiatives promoting healthcare access. While initial investment costs for advanced equipment and the requirement for skilled professionals present challenges, ongoing technological developments and training programs are mitigating these factors, ensuring sustained market expansion.
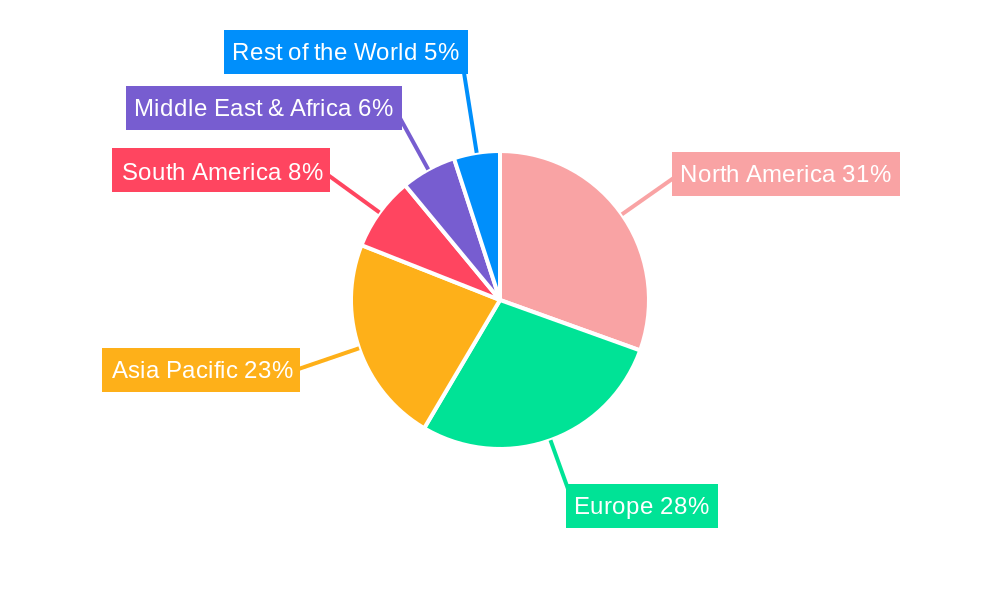
ENT Diagnostic Devices Company Market Share
ENT Diagnostic Devices Market Outlook: Navigating Innovation and Growth (2019–2033)
This comprehensive report offers an in-depth analysis of the global ENT Diagnostic Devices market, covering market dynamics, growth trends, regional dominance, product landscape, key drivers, challenges, opportunities, and the strategies of leading players. The study period spans from 2019 to 2033, with a base year of 2025, providing a robust historical perspective and a detailed forecast.
ENT Diagnostic Devices Market Dynamics & Structure
The global ENT Diagnostic Devices market exhibits a moderate to high concentration, with key players like Karl Storz, Medtronic, Smith & Nephew, Stryker, Olympus, and Cochlear Limited holding significant market shares. Technological innovation is the primary driver, fueled by advancements in imaging, miniaturization, and AI-powered diagnostic tools. These innovations aim to improve diagnostic accuracy, procedural efficiency, and patient outcomes in ENT procedures. The regulatory landscape, governed by bodies such as the FDA and EMA, plays a crucial role in product approvals and market access, often acting as a barrier to entry for smaller manufacturers due to stringent compliance requirements. Competitive product substitutes, while present in the form of traditional diagnostic methods, are increasingly being outpaced by the superior capabilities of advanced ENT diagnostic devices. End-user demographics are shifting towards an aging population with a higher incidence of age-related ear, nose, and throat conditions, alongside a growing awareness and demand for minimally invasive procedures. Mergers and acquisitions (M&A) are prevalent, as larger companies seek to expand their product portfolios and market reach, evidenced by approximately 8-12 M&A deals annually over the historical period. Innovation barriers include high R&D costs and the lengthy approval processes for novel technologies.
- Market Concentration: Moderate to High, driven by a few key players dominating market share.
- Technological Innovation Drivers: Miniaturization, AI integration, advanced imaging, and minimally invasive technologies.
- Regulatory Frameworks: Strict adherence required by FDA, EMA, and other regional health authorities, influencing product development and market entry.
- Competitive Product Substitutes: Traditional diagnostic methods are gradually being replaced by advanced ENT devices.
- End-User Demographics: Aging population, increased prevalence of ENT disorders, and preference for advanced diagnostic solutions.
- M&A Trends: Strategic acquisitions to consolidate market position and expand product offerings.
ENT Diagnostic Devices Growth Trends & Insights
The global ENT Diagnostic Devices market is poised for robust growth, projected to expand significantly in value and volume over the forecast period. The market size is estimated to reach approximately \$18,500 million in 2025, with a Compound Annual Growth Rate (CAGR) of around 7.5% from 2025 to 2033. This expansion is underpinned by escalating healthcare expenditure globally, a growing incidence of ENT disorders such as hearing loss, sinusitis, and throat infections, and the increasing adoption of advanced diagnostic technologies by healthcare providers. The rising preference for minimally invasive procedures, which offer faster recovery times and reduced patient discomfort, is a key consumer behavior shift influencing the demand for sophisticated ENT diagnostic devices. Technological disruptions, including the integration of artificial intelligence (AI) for enhanced diagnostic accuracy and image analysis, and the development of portable and connected devices, are further accelerating adoption rates. Market penetration is expected to deepen as awareness about the benefits of early and accurate diagnosis grows, particularly in developing economies. The parent market for medical diagnostic devices is experiencing a healthy CAGR of 6.8%, with the ENT diagnostic devices segment outperforming due to its specialized nature and increasing demand for targeted solutions. The child market, focusing on specific sub-segments like audiology diagnostics, is witnessing even faster growth at approximately 8.2% CAGR.
- Market Size Evolution: Projected to grow from an estimated \$18,500 million in 2025 to over \$32,000 million by 2033.
- Adoption Rates: Increasing adoption of advanced technologies driven by improved diagnostic capabilities and patient outcomes.
- Technological Disruptions: AI-powered diagnostics, IoT integration, and miniaturization of devices are transforming the market.
- Consumer Behavior Shifts: Growing preference for minimally invasive procedures and early, accurate diagnosis.
- Market Penetration: Expected to rise as awareness and accessibility of advanced ENT diagnostics increase globally.
- CAGR (ENT Diagnostic Devices): Approximately 7.5% (2025-2033).
- CAGR (Parent Medical Diagnostic Devices Market): Approximately 6.8%.
- CAGR (Child Market - e.g., Audiology Diagnostics): Approximately 8.2%.
Dominant Regions, Countries, or Segments in ENT Diagnostic Devices
North America, led by the United States, currently dominates the global ENT Diagnostic Devices market, driven by its advanced healthcare infrastructure, high disposable incomes, significant investment in R&D, and a large aging population susceptible to ENT ailments. The region's strong emphasis on early disease detection and adoption of cutting-edge medical technologies positions it as a leading market. The Application segment of ENT Diagnostic procedures is the primary growth driver, accounting for an estimated 65% of the total market revenue in 2025. This dominance is attributed to the increasing prevalence of hearing loss, tinnitus, vertigo, and sinonasal diseases, necessitating sophisticated diagnostic tools. Within the Types segment, Powered Surgical Instruments are projected to command a significant market share, estimated at 30% in 2025, due to their crucial role in minimally invasive ENT surgeries requiring precision and efficiency.
- Leading Region: North America, particularly the United States.
- Dominant Application Segment: ENT Diagnostic, representing approximately 65% of the market revenue in 2025.
- Key Drivers in Dominant Regions/Segments:
- Advanced healthcare infrastructure and high healthcare expenditure.
- Early adoption of technological innovations and R&D investments.
- Aging population and rising prevalence of ENT disorders.
- Government initiatives promoting preventive healthcare and diagnostics.
- Dominant Type Segment: Powered Surgical Instruments, estimated at 30% market share in 2025.
- Market Share Analysis: North America is projected to hold over 35% of the global market share in 2025.
- Growth Potential: High growth potential in emerging economies within Asia Pacific and Latin America, driven by improving healthcare access and increasing awareness.
ENT Diagnostic Devices Product Landscape
The ENT Diagnostic Devices product landscape is characterized by continuous innovation, focusing on enhancing diagnostic accuracy, patient comfort, and procedural efficiency. Key product categories include advanced otoscopes with high-resolution imaging capabilities, digital audiometers for precise hearing assessments, endoscopes with integrated video recording and illumination, and specialized diagnostic imaging systems for the sinonasal cavity and larynx. The integration of AI in image analysis and diagnostic algorithms is a notable trend, offering clinicians powerful tools for faster and more accurate diagnoses. Performance metrics are continuously improving, with advancements in resolution, speed, and portability. Unique selling propositions often revolve around minimally invasive applications, wireless connectivity, and user-friendly interfaces, making these devices indispensable in modern ENT practice.
Key Drivers, Barriers & Challenges in ENT Diagnostic Devices
The ENT Diagnostic Devices market is propelled by several key drivers including the increasing global prevalence of ENT disorders, particularly hearing loss and sinonasal diseases, coupled with a rising aging population susceptible to these conditions. Technological advancements, such as miniaturization, enhanced imaging, and AI integration, are crucial in driving demand for more precise and efficient diagnostic tools. Furthermore, growing healthcare expenditure and the shift towards minimally invasive procedures contribute significantly to market growth.
- Key Drivers:
- Rising incidence of ENT disorders and an aging global population.
- Technological advancements (AI, imaging, miniaturization).
- Increasing healthcare investments and disposable incomes.
- Preference for minimally invasive and accurate diagnostic methods.
Conversely, the market faces several challenges and restraints. High research and development costs, coupled with stringent regulatory approval processes, can hinder rapid market entry for new innovations. The cost of advanced ENT diagnostic devices can also be a barrier to adoption, especially in resource-limited settings. Supply chain disruptions and the need for specialized training for healthcare professionals to operate complex equipment also pose significant challenges.
- Barriers & Challenges:
- High R&D costs and lengthy regulatory approval pathways.
- Cost sensitivity and affordability concerns in certain markets.
- Supply chain complexities and potential disruptions.
- Need for skilled personnel and specialized training.
- Intense competition and pricing pressures.
Emerging Opportunities in ENT Diagnostic Devices
Emerging opportunities in the ENT Diagnostic Devices market lie in the development of advanced AI-powered diagnostic platforms that can predict disease progression and personalize treatment plans. The growing demand for home-use diagnostic devices, particularly for audiological assessments, presents a significant untapped market. Furthermore, expanding the reach of these devices into underserved rural and developing regions through cost-effective and portable solutions offers substantial growth potential. The increasing focus on preventive healthcare and early disease detection also opens avenues for innovative screening tools.
Growth Accelerators in the ENT Diagnostic Devices Industry
Several factors are accelerating the long-term growth of the ENT Diagnostic Devices industry. Technological breakthroughs, such as the development of novel imaging techniques and sensor technologies, are constantly enhancing device capabilities. Strategic partnerships between technology developers and healthcare providers are crucial for accelerating product adoption and improving market access. Furthermore, market expansion strategies targeting emerging economies, coupled with increasing government initiatives to improve ear and throat health awareness, are significant growth accelerators.
Key Players Shaping the ENT Diagnostic Devices Market
- Karl Storz
- Medtronic
- Smith & Nephew
- Stryker
- Olympus
- Cochlear Limited
- Johnson & Johnson
- Hoya Corporation
- William Demant
- Sonova Holding
- Richard Wolf
- Boston Scientific
- ZEISS International
- Conmed
- Pentax
- Intersect ENT
- Hill-Rom
- Fujifilm
- Endotech
- B. Braun
- Happersberger Otopront
Notable Milestones in ENT Diagnostic Devices Sector
- 2020: Launch of AI-powered otoscopes for enhanced diagnostic accuracy in identifying ear infections.
- 2021: Introduction of advanced wireless endoscopic systems for minimally invasive sinus surgery.
- 2022: Significant advancements in portable audiometers, enabling remote hearing assessments.
- 2023: Approval of novel imaging technologies for detailed visualization of the inner ear structures.
- 2024: Increased M&A activities focused on acquiring companies with innovative AI diagnostic platforms.
In-Depth ENT Diagnostic Devices Market Outlook
The future outlook for the ENT Diagnostic Devices market is exceptionally promising, driven by sustained technological innovation and a growing global demand for advanced healthcare solutions. Continued advancements in AI, robotic-assisted diagnostics, and miniaturization will further enhance the precision and accessibility of ENT diagnostics. Strategic collaborations and the expansion into emerging markets are expected to be key growth enablers, while a focus on personalized medicine and preventative care will shape future product development. The market is well-positioned for continued robust growth, offering significant opportunities for stakeholders investing in cutting-edge technologies and expanding their global footprint.
ENT Diagnostic Devices Segmentation
-
1. Application
- 1.1. ENT Diagnostic
- 1.2. ENT Treatment
-
2. Types
- 2.1. Powered Surgical Instruments
- 2.2. Radiofrequency (RF) Handpieces
- 2.3. Handheld Instruments
- 2.4. Other
ENT Diagnostic Devices Segmentation By Geography
-
1. North America
- 1.1. United States
- 1.2. Canada
- 1.3. Mexico
-
2. South America
- 2.1. Brazil
- 2.2. Argentina
- 2.3. Rest of South America
-
3. Europe
- 3.1. United Kingdom
- 3.2. Germany
- 3.3. France
- 3.4. Italy
- 3.5. Spain
- 3.6. Russia
- 3.7. Benelux
- 3.8. Nordics
- 3.9. Rest of Europe
-
4. Middle East & Africa
- 4.1. Turkey
- 4.2. Israel
- 4.3. GCC
- 4.4. North Africa
- 4.5. South Africa
- 4.6. Rest of Middle East & Africa
-
5. Asia Pacific
- 5.1. China
- 5.2. India
- 5.3. Japan
- 5.4. South Korea
- 5.5. ASEAN
- 5.6. Oceania
- 5.7. Rest of Asia Pacific
ENT Diagnostic Devices Regional Market Share
Geographic Coverage of ENT Diagnostic Devices
ENT Diagnostic Devices REPORT HIGHLIGHTS
| Aspects | Details |
|---|---|
| Study Period | 2020-2034 |
| Base Year | 2025 |
| Estimated Year | 2026 |
| Forecast Period | 2026-2034 |
| Historical Period | 2020-2025 |
| Growth Rate | CAGR of 6.54% from 2020-2034 |
| Segmentation |
|
Table of Contents
- 1. Introduction
- 1.1. Research Scope
- 1.2. Market Segmentation
- 1.3. Research Methodology
- 1.4. Definitions and Assumptions
- 2. Executive Summary
- 2.1. Introduction
- 3. Market Dynamics
- 3.1. Introduction
- 3.2. Market Drivers
- 3.3. Market Restrains
- 3.4. Market Trends
- 4. Market Factor Analysis
- 4.1. Porters Five Forces
- 4.2. Supply/Value Chain
- 4.3. PESTEL analysis
- 4.4. Market Entropy
- 4.5. Patent/Trademark Analysis
- 5. Global ENT Diagnostic Devices Analysis, Insights and Forecast, 2020-2032
- 5.1. Market Analysis, Insights and Forecast - by Application
- 5.1.1. ENT Diagnostic
- 5.1.2. ENT Treatment
- 5.2. Market Analysis, Insights and Forecast - by Types
- 5.2.1. Powered Surgical Instruments
- 5.2.2. Radiofrequency (RF) Handpieces
- 5.2.3. Handheld Instruments
- 5.2.4. Other
- 5.3. Market Analysis, Insights and Forecast - by Region
- 5.3.1. North America
- 5.3.2. South America
- 5.3.3. Europe
- 5.3.4. Middle East & Africa
- 5.3.5. Asia Pacific
- 5.1. Market Analysis, Insights and Forecast - by Application
- 6. North America ENT Diagnostic Devices Analysis, Insights and Forecast, 2020-2032
- 6.1. Market Analysis, Insights and Forecast - by Application
- 6.1.1. ENT Diagnostic
- 6.1.2. ENT Treatment
- 6.2. Market Analysis, Insights and Forecast - by Types
- 6.2.1. Powered Surgical Instruments
- 6.2.2. Radiofrequency (RF) Handpieces
- 6.2.3. Handheld Instruments
- 6.2.4. Other
- 6.1. Market Analysis, Insights and Forecast - by Application
- 7. South America ENT Diagnostic Devices Analysis, Insights and Forecast, 2020-2032
- 7.1. Market Analysis, Insights and Forecast - by Application
- 7.1.1. ENT Diagnostic
- 7.1.2. ENT Treatment
- 7.2. Market Analysis, Insights and Forecast - by Types
- 7.2.1. Powered Surgical Instruments
- 7.2.2. Radiofrequency (RF) Handpieces
- 7.2.3. Handheld Instruments
- 7.2.4. Other
- 7.1. Market Analysis, Insights and Forecast - by Application
- 8. Europe ENT Diagnostic Devices Analysis, Insights and Forecast, 2020-2032
- 8.1. Market Analysis, Insights and Forecast - by Application
- 8.1.1. ENT Diagnostic
- 8.1.2. ENT Treatment
- 8.2. Market Analysis, Insights and Forecast - by Types
- 8.2.1. Powered Surgical Instruments
- 8.2.2. Radiofrequency (RF) Handpieces
- 8.2.3. Handheld Instruments
- 8.2.4. Other
- 8.1. Market Analysis, Insights and Forecast - by Application
- 9. Middle East & Africa ENT Diagnostic Devices Analysis, Insights and Forecast, 2020-2032
- 9.1. Market Analysis, Insights and Forecast - by Application
- 9.1.1. ENT Diagnostic
- 9.1.2. ENT Treatment
- 9.2. Market Analysis, Insights and Forecast - by Types
- 9.2.1. Powered Surgical Instruments
- 9.2.2. Radiofrequency (RF) Handpieces
- 9.2.3. Handheld Instruments
- 9.2.4. Other
- 9.1. Market Analysis, Insights and Forecast - by Application
- 10. Asia Pacific ENT Diagnostic Devices Analysis, Insights and Forecast, 2020-2032
- 10.1. Market Analysis, Insights and Forecast - by Application
- 10.1.1. ENT Diagnostic
- 10.1.2. ENT Treatment
- 10.2. Market Analysis, Insights and Forecast - by Types
- 10.2.1. Powered Surgical Instruments
- 10.2.2. Radiofrequency (RF) Handpieces
- 10.2.3. Handheld Instruments
- 10.2.4. Other
- 10.1. Market Analysis, Insights and Forecast - by Application
- 11. Competitive Analysis
- 11.1. Global Market Share Analysis 2025
- 11.2. Company Profiles
- 11.2.1 Karl Storz
- 11.2.1.1. Overview
- 11.2.1.2. Products
- 11.2.1.3. SWOT Analysis
- 11.2.1.4. Recent Developments
- 11.2.1.5. Financials (Based on Availability)
- 11.2.2 Medtronic
- 11.2.2.1. Overview
- 11.2.2.2. Products
- 11.2.2.3. SWOT Analysis
- 11.2.2.4. Recent Developments
- 11.2.2.5. Financials (Based on Availability)
- 11.2.3 Smith & Nephew
- 11.2.3.1. Overview
- 11.2.3.2. Products
- 11.2.3.3. SWOT Analysis
- 11.2.3.4. Recent Developments
- 11.2.3.5. Financials (Based on Availability)
- 11.2.4 Stryker
- 11.2.4.1. Overview
- 11.2.4.2. Products
- 11.2.4.3. SWOT Analysis
- 11.2.4.4. Recent Developments
- 11.2.4.5. Financials (Based on Availability)
- 11.2.5 Olympus
- 11.2.5.1. Overview
- 11.2.5.2. Products
- 11.2.5.3. SWOT Analysis
- 11.2.5.4. Recent Developments
- 11.2.5.5. Financials (Based on Availability)
- 11.2.6 Cochlear Limited
- 11.2.6.1. Overview
- 11.2.6.2. Products
- 11.2.6.3. SWOT Analysis
- 11.2.6.4. Recent Developments
- 11.2.6.5. Financials (Based on Availability)
- 11.2.7 Johnson & Johnson
- 11.2.7.1. Overview
- 11.2.7.2. Products
- 11.2.7.3. SWOT Analysis
- 11.2.7.4. Recent Developments
- 11.2.7.5. Financials (Based on Availability)
- 11.2.8 Hoya Corporation
- 11.2.8.1. Overview
- 11.2.8.2. Products
- 11.2.8.3. SWOT Analysis
- 11.2.8.4. Recent Developments
- 11.2.8.5. Financials (Based on Availability)
- 11.2.9 William Demant
- 11.2.9.1. Overview
- 11.2.9.2. Products
- 11.2.9.3. SWOT Analysis
- 11.2.9.4. Recent Developments
- 11.2.9.5. Financials (Based on Availability)
- 11.2.10 Sonova Holding
- 11.2.10.1. Overview
- 11.2.10.2. Products
- 11.2.10.3. SWOT Analysis
- 11.2.10.4. Recent Developments
- 11.2.10.5. Financials (Based on Availability)
- 11.2.11 Richard Wolf
- 11.2.11.1. Overview
- 11.2.11.2. Products
- 11.2.11.3. SWOT Analysis
- 11.2.11.4. Recent Developments
- 11.2.11.5. Financials (Based on Availability)
- 11.2.12 Boston Scientific
- 11.2.12.1. Overview
- 11.2.12.2. Products
- 11.2.12.3. SWOT Analysis
- 11.2.12.4. Recent Developments
- 11.2.12.5. Financials (Based on Availability)
- 11.2.13 ZEISS International
- 11.2.13.1. Overview
- 11.2.13.2. Products
- 11.2.13.3. SWOT Analysis
- 11.2.13.4. Recent Developments
- 11.2.13.5. Financials (Based on Availability)
- 11.2.14 Conmed
- 11.2.14.1. Overview
- 11.2.14.2. Products
- 11.2.14.3. SWOT Analysis
- 11.2.14.4. Recent Developments
- 11.2.14.5. Financials (Based on Availability)
- 11.2.15 Pentax
- 11.2.15.1. Overview
- 11.2.15.2. Products
- 11.2.15.3. SWOT Analysis
- 11.2.15.4. Recent Developments
- 11.2.15.5. Financials (Based on Availability)
- 11.2.16 Intersect ENT
- 11.2.16.1. Overview
- 11.2.16.2. Products
- 11.2.16.3. SWOT Analysis
- 11.2.16.4. Recent Developments
- 11.2.16.5. Financials (Based on Availability)
- 11.2.17 Hill-Rom
- 11.2.17.1. Overview
- 11.2.17.2. Products
- 11.2.17.3. SWOT Analysis
- 11.2.17.4. Recent Developments
- 11.2.17.5. Financials (Based on Availability)
- 11.2.18 Fujifilm
- 11.2.18.1. Overview
- 11.2.18.2. Products
- 11.2.18.3. SWOT Analysis
- 11.2.18.4. Recent Developments
- 11.2.18.5. Financials (Based on Availability)
- 11.2.19 Endotech
- 11.2.19.1. Overview
- 11.2.19.2. Products
- 11.2.19.3. SWOT Analysis
- 11.2.19.4. Recent Developments
- 11.2.19.5. Financials (Based on Availability)
- 11.2.20 B. Braun
- 11.2.20.1. Overview
- 11.2.20.2. Products
- 11.2.20.3. SWOT Analysis
- 11.2.20.4. Recent Developments
- 11.2.20.5. Financials (Based on Availability)
- 11.2.21 Happersberger Otopront
- 11.2.21.1. Overview
- 11.2.21.2. Products
- 11.2.21.3. SWOT Analysis
- 11.2.21.4. Recent Developments
- 11.2.21.5. Financials (Based on Availability)
- 11.2.1 Karl Storz
List of Figures
- Figure 1: Global ENT Diagnostic Devices Revenue Breakdown (billion, %) by Region 2025 & 2033
- Figure 2: Global ENT Diagnostic Devices Volume Breakdown (K, %) by Region 2025 & 2033
- Figure 3: North America ENT Diagnostic Devices Revenue (billion), by Application 2025 & 2033
- Figure 4: North America ENT Diagnostic Devices Volume (K), by Application 2025 & 2033
- Figure 5: North America ENT Diagnostic Devices Revenue Share (%), by Application 2025 & 2033
- Figure 6: North America ENT Diagnostic Devices Volume Share (%), by Application 2025 & 2033
- Figure 7: North America ENT Diagnostic Devices Revenue (billion), by Types 2025 & 2033
- Figure 8: North America ENT Diagnostic Devices Volume (K), by Types 2025 & 2033
- Figure 9: North America ENT Diagnostic Devices Revenue Share (%), by Types 2025 & 2033
- Figure 10: North America ENT Diagnostic Devices Volume Share (%), by Types 2025 & 2033
- Figure 11: North America ENT Diagnostic Devices Revenue (billion), by Country 2025 & 2033
- Figure 12: North America ENT Diagnostic Devices Volume (K), by Country 2025 & 2033
- Figure 13: North America ENT Diagnostic Devices Revenue Share (%), by Country 2025 & 2033
- Figure 14: North America ENT Diagnostic Devices Volume Share (%), by Country 2025 & 2033
- Figure 15: South America ENT Diagnostic Devices Revenue (billion), by Application 2025 & 2033
- Figure 16: South America ENT Diagnostic Devices Volume (K), by Application 2025 & 2033
- Figure 17: South America ENT Diagnostic Devices Revenue Share (%), by Application 2025 & 2033
- Figure 18: South America ENT Diagnostic Devices Volume Share (%), by Application 2025 & 2033
- Figure 19: South America ENT Diagnostic Devices Revenue (billion), by Types 2025 & 2033
- Figure 20: South America ENT Diagnostic Devices Volume (K), by Types 2025 & 2033
- Figure 21: South America ENT Diagnostic Devices Revenue Share (%), by Types 2025 & 2033
- Figure 22: South America ENT Diagnostic Devices Volume Share (%), by Types 2025 & 2033
- Figure 23: South America ENT Diagnostic Devices Revenue (billion), by Country 2025 & 2033
- Figure 24: South America ENT Diagnostic Devices Volume (K), by Country 2025 & 2033
- Figure 25: South America ENT Diagnostic Devices Revenue Share (%), by Country 2025 & 2033
- Figure 26: South America ENT Diagnostic Devices Volume Share (%), by Country 2025 & 2033
- Figure 27: Europe ENT Diagnostic Devices Revenue (billion), by Application 2025 & 2033
- Figure 28: Europe ENT Diagnostic Devices Volume (K), by Application 2025 & 2033
- Figure 29: Europe ENT Diagnostic Devices Revenue Share (%), by Application 2025 & 2033
- Figure 30: Europe ENT Diagnostic Devices Volume Share (%), by Application 2025 & 2033
- Figure 31: Europe ENT Diagnostic Devices Revenue (billion), by Types 2025 & 2033
- Figure 32: Europe ENT Diagnostic Devices Volume (K), by Types 2025 & 2033
- Figure 33: Europe ENT Diagnostic Devices Revenue Share (%), by Types 2025 & 2033
- Figure 34: Europe ENT Diagnostic Devices Volume Share (%), by Types 2025 & 2033
- Figure 35: Europe ENT Diagnostic Devices Revenue (billion), by Country 2025 & 2033
- Figure 36: Europe ENT Diagnostic Devices Volume (K), by Country 2025 & 2033
- Figure 37: Europe ENT Diagnostic Devices Revenue Share (%), by Country 2025 & 2033
- Figure 38: Europe ENT Diagnostic Devices Volume Share (%), by Country 2025 & 2033
- Figure 39: Middle East & Africa ENT Diagnostic Devices Revenue (billion), by Application 2025 & 2033
- Figure 40: Middle East & Africa ENT Diagnostic Devices Volume (K), by Application 2025 & 2033
- Figure 41: Middle East & Africa ENT Diagnostic Devices Revenue Share (%), by Application 2025 & 2033
- Figure 42: Middle East & Africa ENT Diagnostic Devices Volume Share (%), by Application 2025 & 2033
- Figure 43: Middle East & Africa ENT Diagnostic Devices Revenue (billion), by Types 2025 & 2033
- Figure 44: Middle East & Africa ENT Diagnostic Devices Volume (K), by Types 2025 & 2033
- Figure 45: Middle East & Africa ENT Diagnostic Devices Revenue Share (%), by Types 2025 & 2033
- Figure 46: Middle East & Africa ENT Diagnostic Devices Volume Share (%), by Types 2025 & 2033
- Figure 47: Middle East & Africa ENT Diagnostic Devices Revenue (billion), by Country 2025 & 2033
- Figure 48: Middle East & Africa ENT Diagnostic Devices Volume (K), by Country 2025 & 2033
- Figure 49: Middle East & Africa ENT Diagnostic Devices Revenue Share (%), by Country 2025 & 2033
- Figure 50: Middle East & Africa ENT Diagnostic Devices Volume Share (%), by Country 2025 & 2033
- Figure 51: Asia Pacific ENT Diagnostic Devices Revenue (billion), by Application 2025 & 2033
- Figure 52: Asia Pacific ENT Diagnostic Devices Volume (K), by Application 2025 & 2033
- Figure 53: Asia Pacific ENT Diagnostic Devices Revenue Share (%), by Application 2025 & 2033
- Figure 54: Asia Pacific ENT Diagnostic Devices Volume Share (%), by Application 2025 & 2033
- Figure 55: Asia Pacific ENT Diagnostic Devices Revenue (billion), by Types 2025 & 2033
- Figure 56: Asia Pacific ENT Diagnostic Devices Volume (K), by Types 2025 & 2033
- Figure 57: Asia Pacific ENT Diagnostic Devices Revenue Share (%), by Types 2025 & 2033
- Figure 58: Asia Pacific ENT Diagnostic Devices Volume Share (%), by Types 2025 & 2033
- Figure 59: Asia Pacific ENT Diagnostic Devices Revenue (billion), by Country 2025 & 2033
- Figure 60: Asia Pacific ENT Diagnostic Devices Volume (K), by Country 2025 & 2033
- Figure 61: Asia Pacific ENT Diagnostic Devices Revenue Share (%), by Country 2025 & 2033
- Figure 62: Asia Pacific ENT Diagnostic Devices Volume Share (%), by Country 2025 & 2033
List of Tables
- Table 1: Global ENT Diagnostic Devices Revenue billion Forecast, by Application 2020 & 2033
- Table 2: Global ENT Diagnostic Devices Volume K Forecast, by Application 2020 & 2033
- Table 3: Global ENT Diagnostic Devices Revenue billion Forecast, by Types 2020 & 2033
- Table 4: Global ENT Diagnostic Devices Volume K Forecast, by Types 2020 & 2033
- Table 5: Global ENT Diagnostic Devices Revenue billion Forecast, by Region 2020 & 2033
- Table 6: Global ENT Diagnostic Devices Volume K Forecast, by Region 2020 & 2033
- Table 7: Global ENT Diagnostic Devices Revenue billion Forecast, by Application 2020 & 2033
- Table 8: Global ENT Diagnostic Devices Volume K Forecast, by Application 2020 & 2033
- Table 9: Global ENT Diagnostic Devices Revenue billion Forecast, by Types 2020 & 2033
- Table 10: Global ENT Diagnostic Devices Volume K Forecast, by Types 2020 & 2033
- Table 11: Global ENT Diagnostic Devices Revenue billion Forecast, by Country 2020 & 2033
- Table 12: Global ENT Diagnostic Devices Volume K Forecast, by Country 2020 & 2033
- Table 13: United States ENT Diagnostic Devices Revenue (billion) Forecast, by Application 2020 & 2033
- Table 14: United States ENT Diagnostic Devices Volume (K) Forecast, by Application 2020 & 2033
- Table 15: Canada ENT Diagnostic Devices Revenue (billion) Forecast, by Application 2020 & 2033
- Table 16: Canada ENT Diagnostic Devices Volume (K) Forecast, by Application 2020 & 2033
- Table 17: Mexico ENT Diagnostic Devices Revenue (billion) Forecast, by Application 2020 & 2033
- Table 18: Mexico ENT Diagnostic Devices Volume (K) Forecast, by Application 2020 & 2033
- Table 19: Global ENT Diagnostic Devices Revenue billion Forecast, by Application 2020 & 2033
- Table 20: Global ENT Diagnostic Devices Volume K Forecast, by Application 2020 & 2033
- Table 21: Global ENT Diagnostic Devices Revenue billion Forecast, by Types 2020 & 2033
- Table 22: Global ENT Diagnostic Devices Volume K Forecast, by Types 2020 & 2033
- Table 23: Global ENT Diagnostic Devices Revenue billion Forecast, by Country 2020 & 2033
- Table 24: Global ENT Diagnostic Devices Volume K Forecast, by Country 2020 & 2033
- Table 25: Brazil ENT Diagnostic Devices Revenue (billion) Forecast, by Application 2020 & 2033
- Table 26: Brazil ENT Diagnostic Devices Volume (K) Forecast, by Application 2020 & 2033
- Table 27: Argentina ENT Diagnostic Devices Revenue (billion) Forecast, by Application 2020 & 2033
- Table 28: Argentina ENT Diagnostic Devices Volume (K) Forecast, by Application 2020 & 2033
- Table 29: Rest of South America ENT Diagnostic Devices Revenue (billion) Forecast, by Application 2020 & 2033
- Table 30: Rest of South America ENT Diagnostic Devices Volume (K) Forecast, by Application 2020 & 2033
- Table 31: Global ENT Diagnostic Devices Revenue billion Forecast, by Application 2020 & 2033
- Table 32: Global ENT Diagnostic Devices Volume K Forecast, by Application 2020 & 2033
- Table 33: Global ENT Diagnostic Devices Revenue billion Forecast, by Types 2020 & 2033
- Table 34: Global ENT Diagnostic Devices Volume K Forecast, by Types 2020 & 2033
- Table 35: Global ENT Diagnostic Devices Revenue billion Forecast, by Country 2020 & 2033
- Table 36: Global ENT Diagnostic Devices Volume K Forecast, by Country 2020 & 2033
- Table 37: United Kingdom ENT Diagnostic Devices Revenue (billion) Forecast, by Application 2020 & 2033
- Table 38: United Kingdom ENT Diagnostic Devices Volume (K) Forecast, by Application 2020 & 2033
- Table 39: Germany ENT Diagnostic Devices Revenue (billion) Forecast, by Application 2020 & 2033
- Table 40: Germany ENT Diagnostic Devices Volume (K) Forecast, by Application 2020 & 2033
- Table 41: France ENT Diagnostic Devices Revenue (billion) Forecast, by Application 2020 & 2033
- Table 42: France ENT Diagnostic Devices Volume (K) Forecast, by Application 2020 & 2033
- Table 43: Italy ENT Diagnostic Devices Revenue (billion) Forecast, by Application 2020 & 2033
- Table 44: Italy ENT Diagnostic Devices Volume (K) Forecast, by Application 2020 & 2033
- Table 45: Spain ENT Diagnostic Devices Revenue (billion) Forecast, by Application 2020 & 2033
- Table 46: Spain ENT Diagnostic Devices Volume (K) Forecast, by Application 2020 & 2033
- Table 47: Russia ENT Diagnostic Devices Revenue (billion) Forecast, by Application 2020 & 2033
- Table 48: Russia ENT Diagnostic Devices Volume (K) Forecast, by Application 2020 & 2033
- Table 49: Benelux ENT Diagnostic Devices Revenue (billion) Forecast, by Application 2020 & 2033
- Table 50: Benelux ENT Diagnostic Devices Volume (K) Forecast, by Application 2020 & 2033
- Table 51: Nordics ENT Diagnostic Devices Revenue (billion) Forecast, by Application 2020 & 2033
- Table 52: Nordics ENT Diagnostic Devices Volume (K) Forecast, by Application 2020 & 2033
- Table 53: Rest of Europe ENT Diagnostic Devices Revenue (billion) Forecast, by Application 2020 & 2033
- Table 54: Rest of Europe ENT Diagnostic Devices Volume (K) Forecast, by Application 2020 & 2033
- Table 55: Global ENT Diagnostic Devices Revenue billion Forecast, by Application 2020 & 2033
- Table 56: Global ENT Diagnostic Devices Volume K Forecast, by Application 2020 & 2033
- Table 57: Global ENT Diagnostic Devices Revenue billion Forecast, by Types 2020 & 2033
- Table 58: Global ENT Diagnostic Devices Volume K Forecast, by Types 2020 & 2033
- Table 59: Global ENT Diagnostic Devices Revenue billion Forecast, by Country 2020 & 2033
- Table 60: Global ENT Diagnostic Devices Volume K Forecast, by Country 2020 & 2033
- Table 61: Turkey ENT Diagnostic Devices Revenue (billion) Forecast, by Application 2020 & 2033
- Table 62: Turkey ENT Diagnostic Devices Volume (K) Forecast, by Application 2020 & 2033
- Table 63: Israel ENT Diagnostic Devices Revenue (billion) Forecast, by Application 2020 & 2033
- Table 64: Israel ENT Diagnostic Devices Volume (K) Forecast, by Application 2020 & 2033
- Table 65: GCC ENT Diagnostic Devices Revenue (billion) Forecast, by Application 2020 & 2033
- Table 66: GCC ENT Diagnostic Devices Volume (K) Forecast, by Application 2020 & 2033
- Table 67: North Africa ENT Diagnostic Devices Revenue (billion) Forecast, by Application 2020 & 2033
- Table 68: North Africa ENT Diagnostic Devices Volume (K) Forecast, by Application 2020 & 2033
- Table 69: South Africa ENT Diagnostic Devices Revenue (billion) Forecast, by Application 2020 & 2033
- Table 70: South Africa ENT Diagnostic Devices Volume (K) Forecast, by Application 2020 & 2033
- Table 71: Rest of Middle East & Africa ENT Diagnostic Devices Revenue (billion) Forecast, by Application 2020 & 2033
- Table 72: Rest of Middle East & Africa ENT Diagnostic Devices Volume (K) Forecast, by Application 2020 & 2033
- Table 73: Global ENT Diagnostic Devices Revenue billion Forecast, by Application 2020 & 2033
- Table 74: Global ENT Diagnostic Devices Volume K Forecast, by Application 2020 & 2033
- Table 75: Global ENT Diagnostic Devices Revenue billion Forecast, by Types 2020 & 2033
- Table 76: Global ENT Diagnostic Devices Volume K Forecast, by Types 2020 & 2033
- Table 77: Global ENT Diagnostic Devices Revenue billion Forecast, by Country 2020 & 2033
- Table 78: Global ENT Diagnostic Devices Volume K Forecast, by Country 2020 & 2033
- Table 79: China ENT Diagnostic Devices Revenue (billion) Forecast, by Application 2020 & 2033
- Table 80: China ENT Diagnostic Devices Volume (K) Forecast, by Application 2020 & 2033
- Table 81: India ENT Diagnostic Devices Revenue (billion) Forecast, by Application 2020 & 2033
- Table 82: India ENT Diagnostic Devices Volume (K) Forecast, by Application 2020 & 2033
- Table 83: Japan ENT Diagnostic Devices Revenue (billion) Forecast, by Application 2020 & 2033
- Table 84: Japan ENT Diagnostic Devices Volume (K) Forecast, by Application 2020 & 2033
- Table 85: South Korea ENT Diagnostic Devices Revenue (billion) Forecast, by Application 2020 & 2033
- Table 86: South Korea ENT Diagnostic Devices Volume (K) Forecast, by Application 2020 & 2033
- Table 87: ASEAN ENT Diagnostic Devices Revenue (billion) Forecast, by Application 2020 & 2033
- Table 88: ASEAN ENT Diagnostic Devices Volume (K) Forecast, by Application 2020 & 2033
- Table 89: Oceania ENT Diagnostic Devices Revenue (billion) Forecast, by Application 2020 & 2033
- Table 90: Oceania ENT Diagnostic Devices Volume (K) Forecast, by Application 2020 & 2033
- Table 91: Rest of Asia Pacific ENT Diagnostic Devices Revenue (billion) Forecast, by Application 2020 & 2033
- Table 92: Rest of Asia Pacific ENT Diagnostic Devices Volume (K) Forecast, by Application 2020 & 2033
Frequently Asked Questions
1. What is the projected Compound Annual Growth Rate (CAGR) of the ENT Diagnostic Devices?
The projected CAGR is approximately 6.54%.
2. Which companies are prominent players in the ENT Diagnostic Devices?
Key companies in the market include Karl Storz, Medtronic, Smith & Nephew, Stryker, Olympus, Cochlear Limited, Johnson & Johnson, Hoya Corporation, William Demant, Sonova Holding, Richard Wolf, Boston Scientific, ZEISS International, Conmed, Pentax, Intersect ENT, Hill-Rom, Fujifilm, Endotech, B. Braun, Happersberger Otopront.
3. What are the main segments of the ENT Diagnostic Devices?
The market segments include Application, Types.
4. Can you provide details about the market size?
The market size is estimated to be USD 20.88 billion as of 2022.
5. What are some drivers contributing to market growth?
N/A
6. What are the notable trends driving market growth?
N/A
7. Are there any restraints impacting market growth?
N/A
8. Can you provide examples of recent developments in the market?
N/A
9. What pricing options are available for accessing the report?
Pricing options include single-user, multi-user, and enterprise licenses priced at USD 3950.00, USD 5925.00, and USD 7900.00 respectively.
10. Is the market size provided in terms of value or volume?
The market size is provided in terms of value, measured in billion and volume, measured in K.
11. Are there any specific market keywords associated with the report?
Yes, the market keyword associated with the report is "ENT Diagnostic Devices," which aids in identifying and referencing the specific market segment covered.
12. How do I determine which pricing option suits my needs best?
The pricing options vary based on user requirements and access needs. Individual users may opt for single-user licenses, while businesses requiring broader access may choose multi-user or enterprise licenses for cost-effective access to the report.
13. Are there any additional resources or data provided in the ENT Diagnostic Devices report?
While the report offers comprehensive insights, it's advisable to review the specific contents or supplementary materials provided to ascertain if additional resources or data are available.
14. How can I stay updated on further developments or reports in the ENT Diagnostic Devices?
To stay informed about further developments, trends, and reports in the ENT Diagnostic Devices, consider subscribing to industry newsletters, following relevant companies and organizations, or regularly checking reputable industry news sources and publications.
Methodology
Step 1 - Identification of Relevant Samples Size from Population Database


Step 2 - Approaches for Defining Global Market Size (Value, Volume* & Price*)

Note*: In applicable scenarios
Step 3 - Data Sources
Primary Research
- Web Analytics
- Survey Reports
- Research Institute
- Latest Research Reports
- Opinion Leaders
Secondary Research
- Annual Reports
- White Paper
- Latest Press Release
- Industry Association
- Paid Database
- Investor Presentations

Step 4 - Data Triangulation
Involves using different sources of information in order to increase the validity of a study
These sources are likely to be stakeholders in a program - participants, other researchers, program staff, other community members, and so on.
Then we put all data in single framework & apply various statistical tools to find out the dynamic on the market.
During the analysis stage, feedback from the stakeholder groups would be compared to determine areas of agreement as well as areas of divergence