

Key Insights
The global engineered wood market is experiencing substantial expansion, propelled by the increasing demand for sustainable and economical construction materials. With a current market size of 299.11 million, the industry is forecast to achieve a compound annual growth rate (CAGR) of 4.88% between 2025 and 2033. This growth trajectory is influenced by several critical factors. Primarily, the construction sector's persistent requirement for robust, high-performance materials is a key driver. Engineered wood products such as Laminated Veneer Lumber (LVL), Oriented Strand Board (OSB), and Cross-Laminated Timber (CLT) offer superior strength and uniformity over conventional lumber, making them suitable for a wide array of residential, commercial, and infrastructure projects. Secondly, heightened environmental awareness is accelerating the adoption of eco-friendly construction methodologies. Engineered wood often incorporates sustainably sourced timber and reduces reliance on large-diameter trees, thus promoting responsible forestry. Lastly, advancements in manufacturing technologies are enhancing product quality, design versatility, and production efficiency, further stimulating market growth.
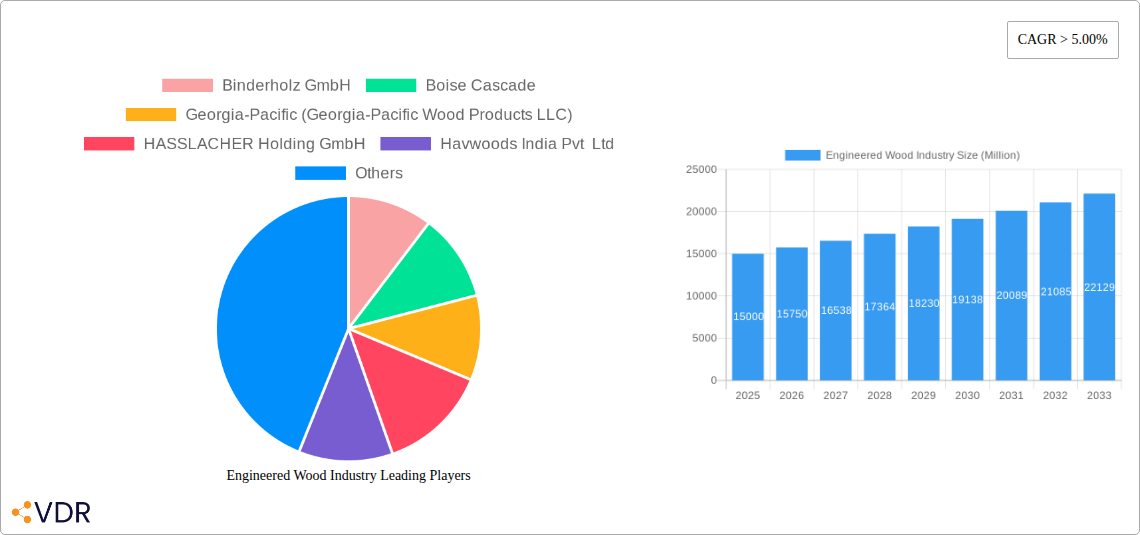
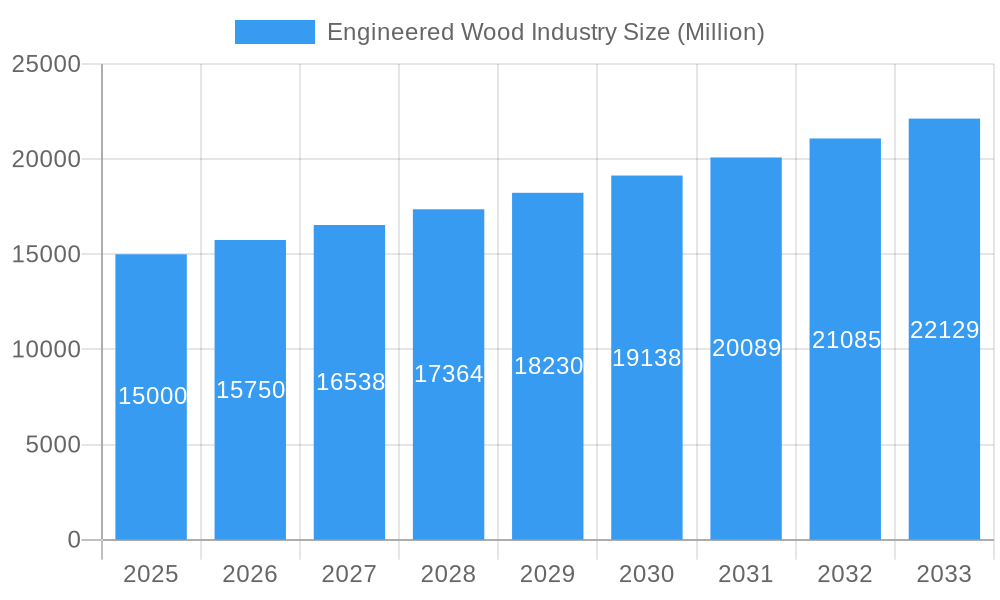
Engineered Wood Industry Market Size (In Million)
Despite positive growth, the industry confronts certain challenges. Volatility in raw material costs, particularly lumber prices, can affect profitability. Moreover, competition from alternative materials like steel and concrete mandates continuous innovation and product diversification. The market is segmented by product type (LVL, OSB, CLT, etc.) and application (residential construction, commercial buildings, industrial structures). Leading industry players, including Binderholz GmbH, Boise Cascade, and Weyerhaeuser Company, are actively influencing market dynamics through strategic R&D investments, capacity expansions, and exploration of new market segments. Geographically, market share is expected to be concentrated in regions with strong construction activity and a higher uptake of sustainable building practices, with North America and Europe anticipated to lead. The forecast period of 2025-2033 indicates a promising future for the engineered wood industry, driven by sustained demand, technological progress, and the global imperative for sustainable construction.
Engineered Wood Industry Company Market Share
Engineered Wood Industry Market Report: 2019-2033
This comprehensive report provides an in-depth analysis of the Engineered Wood Industry, encompassing market dynamics, growth trends, regional dominance, product landscape, key players, and future outlook. The report covers the period 2019-2033, with a focus on the forecast period 2025-2033 and a base year of 2025. The study examines both the parent market (Wood Products) and child market (Engineered Wood Products), offering granular insights for industry professionals, investors, and strategic decision-makers. Expected market size values are presented in million units.
Engineered Wood Industry Market Dynamics & Structure
This section analyzes the competitive landscape, technological advancements, regulatory influences, and market trends within the Engineered Wood Industry. The market is characterized by a moderately concentrated structure with a few major players holding significant market share. However, smaller regional players also contribute to the overall market. Technological innovation is a key driver, with companies continuously investing in research and development to improve product performance, sustainability, and manufacturing efficiency. Regulatory frameworks concerning environmental sustainability and building codes play a crucial role. Substitutes like concrete and steel face competition from Engineered Wood's cost-effectiveness and versatility.
- Market Concentration: Moderately concentrated, with top 5 players holding xx% market share (2024).
- Technological Drivers: Focus on sustainable materials, advanced manufacturing techniques (e.g., cross-laminated timber), and improved performance characteristics.
- Regulatory Framework: Emphasis on sustainable forestry practices and building codes impacting material choices.
- Competitive Substitutes: Concrete and steel, particularly in high-rise construction.
- End-User Demographics: Primarily construction (residential & commercial), furniture manufacturing, and industrial applications.
- M&A Trends: A moderate level of M&A activity, primarily focused on expanding distribution networks and acquiring specialized technologies (xx deals in the last 5 years).
Engineered Wood Industry Growth Trends & Insights
The Engineered Wood Industry has witnessed consistent growth over the historical period (2019-2024), driven by factors such as increased construction activity, growing demand for sustainable building materials, and technological advancements in product design and manufacturing. The market is expected to maintain its growth trajectory during the forecast period (2025-2033), with a projected Compound Annual Growth Rate (CAGR) of xx% from 2025 to 2033. This growth is attributable to the increasing adoption of engineered wood products in various applications, supported by favorable economic conditions in key markets and continuous innovations that enhance performance and sustainability. Shifting consumer preferences towards eco-friendly and durable building materials further fuel market expansion. Market penetration is expected to reach xx% by 2033.
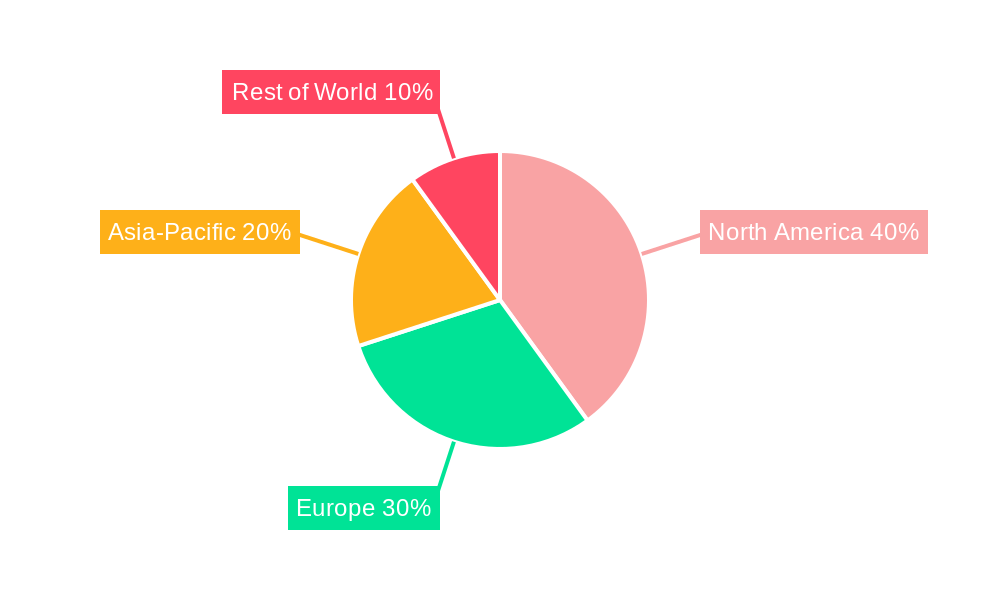
Dominant Regions, Countries, or Segments in Engineered Wood Industry
North America and Europe currently dominate the Engineered Wood Industry, accounting for xx% of the global market share in 2024. This dominance is driven by robust construction sectors, stringent building codes promoting sustainable materials, and well-established manufacturing bases. However, Asia-Pacific is emerging as a significant growth market, fueled by rapid urbanization and infrastructure development. The residential segment holds the largest market share, driven by rising housing demand.
- North America: Strong construction sector, high adoption of engineered wood products.
- Europe: Established manufacturing base, focus on sustainable construction practices.
- Asia-Pacific: Rapid urbanization and infrastructure development driving significant growth.
- Residential Segment: Largest market share, driven by increasing housing demand.
Engineered Wood Industry Product Landscape
The engineered wood product landscape is diverse, encompassing various types like plywood, oriented strand board (OSB), laminated veneer lumber (LVL), cross-laminated timber (CLT), and parallel strand lumber (PSL). Each product offers unique properties tailored to specific applications. Recent innovations focus on enhancing strength, durability, fire resistance, and sustainability. Unique selling propositions often center around environmental certifications, improved performance characteristics, and ease of use in construction. Technological advancements include optimized manufacturing processes and the development of new composite materials.
Key Drivers, Barriers & Challenges in Engineered Wood Industry
Key Drivers:
- Increasing demand from the construction and furniture industries.
- Growing preference for sustainable and environmentally friendly building materials.
- Technological advancements leading to improved product performance and efficiency.
- Favorable government policies promoting sustainable development.
Key Challenges:
- Fluctuations in raw material prices (timber).
- Dependence on sustainable forestry practices.
- Stringent environmental regulations.
- Competition from alternative building materials (concrete, steel). This competition resulted in a xx% reduction in market share for engineered wood in 2023, compared to 2022.
Emerging Opportunities in Engineered Wood Industry
- Expansion into developing markets with high growth potential.
- Development of innovative engineered wood products for specialized applications (e.g., high-rise construction, prefabricated housing).
- Growing demand for mass timber construction, offering opportunities for CLT and other large-format engineered wood products.
- Focus on sustainable manufacturing practices and certifications to meet environmental standards.
Growth Accelerators in the Engineered Wood Industry
Technological breakthroughs in material science and manufacturing processes, along with strategic partnerships between manufacturers and construction companies, are pivotal for accelerating growth. Expansion into new markets and development of innovative products for specialized applications will also drive market expansion. A focus on sustainable forestry practices and environmental certifications further enhances market appeal and fosters long-term growth.
Key Players Shaping the Engineered Wood Industry Market
- Binderholz GmbH
- Boise Cascade
- Georgia-Pacific (Georgia-Pacific Wood Products LLC)
- HASSLACHER Holding GmbH
- Havwoods India Pvt Ltd
- Huber Engineered Woods LLC
- KLH Massivholz Wiesenau GmbH
- Kronoplus Limited
- Louisiana-Pacific Corporation
- Mayr-Melnhof Holz Holding AG
- Nordic Structures
- Pacific Woodtech Corporation
- Resolute Forest Products
- Roseburg
- Stora Enso
- West Fraser
- Weyerhaeuser Company
- *List Not Exhaustive
Notable Milestones in Engineered Wood Industry Sector
- October 2022: Boise Cascade announced the expansion of its distribution center through the acquisition of 4.67 acres of land adjacent to its Albuquerque, New Mexico branch. This expansion strengthened Boise Cascade's position in the southwestern US market.
- December 2022: Boise Cascade expanded its distribution network further by acquiring 45 acres in Walterboro, SC, and a 34-acre parcel in Hondo, Texas. These acquisitions significantly increased Boise Cascade's distribution capacity and market reach in the southeastern and south-central US.
In-Depth Engineered Wood Industry Market Outlook
The Engineered Wood Industry is poised for sustained growth, driven by technological advancements, increasing demand for sustainable building materials, and expansion into new markets. Strategic partnerships, investment in research and development, and a focus on environmentally responsible practices will be key factors in shaping the future of this dynamic industry. The market presents significant opportunities for innovation and expansion, particularly in the areas of mass timber construction and the development of high-performance engineered wood products.
Engineered Wood Industry Segmentation
-
1. Type
- 1.1. Plywood
- 1.2. Oriented Strand Board (OSB)
- 1.3. Glulam
- 1.4. Cross-laminated Timber (CLT)
- 1.5. Laminated Veneer Lumber (LVL)
- 1.6. Particleboard
- 1.7. Other Types (Fiber Board, Parallel Strand, Others)
-
2. Application
- 2.1. Non-residential
- 2.2. Residential
Engineered Wood Industry Segmentation By Geography
-
1. Asia Pacific
- 1.1. China
- 1.2. India
- 1.3. Japan
- 1.4. South Korea
- 1.5. Malaysia
- 1.6. Thailand
- 1.7. Indonesia
- 1.8. Vietnam
- 1.9. Rest of Asia Pacific
-
2. North America
- 2.1. United States
- 2.2. Canada
- 2.3. Mexico
-
3. Europe
- 3.1. Germany
- 3.2. United Kingdom
- 3.3. France
- 3.4. Italy
- 3.5. Spain
- 3.6. Turkey
- 3.7. Russia
- 3.8. NORDIC Countries
- 3.9. Rest of Europe
-
4. South America
- 4.1. Brazil
- 4.2. Argentina
- 4.3. Colombia
- 4.4. Rest of South America
-
5. Middle East and Africa
- 5.1. Saudi Arabia
- 5.2. Nigeria
- 5.3. Qatar
- 5.4. Egypt
- 5.5. United Arab Emirates
- 5.6. South Africa
- 5.7. Rest of Middle East and Africa
Engineered Wood Industry Regional Market Share
Geographic Coverage of Engineered Wood Industry
Engineered Wood Industry REPORT HIGHLIGHTS
| Aspects | Details |
|---|---|
| Study Period | 2020-2034 |
| Base Year | 2025 |
| Estimated Year | 2026 |
| Forecast Period | 2026-2034 |
| Historical Period | 2020-2025 |
| Growth Rate | CAGR of 4.88% from 2020-2034 |
| Segmentation |
|
Table of Contents
- 1. Introduction
- 1.1. Research Scope
- 1.2. Market Segmentation
- 1.3. Research Objective
- 1.4. Definitions and Assumptions
- 2. Executive Summary
- 2.1. Market Snapshot
- 3. Market Dynamics
- 3.1. Market Drivers
- 3.2. Market Restrains
- 3.3. Market Trends
- 3.4. Market Opportunities
- 4. Market Factor Analysis
- 4.1. Porters Five Forces
- 4.1.1. Bargaining Power of Suppliers
- 4.1.2. Bargaining Power of Buyers
- 4.1.3. Threat of New Entrants
- 4.1.4. Threat of Substitutes
- 4.1.5. Competitive Rivalry
- 4.2. PESTEL analysis
- 4.3. BCG Analysis
- 4.3.1. Stars (High Growth, High Market Share)
- 4.3.2. Cash Cows (Low Growth, High Market Share)
- 4.3.3. Question Mark (High Growth, Low Market Share)
- 4.3.4. Dogs (Low Growth, Low Market Share)
- 4.4. Ansoff Matrix Analysis
- 4.5. Supply Chain Analysis
- 4.6. Regulatory Landscape
- 4.7. Current Market Potential and Opportunity Assessment (TAM–SAM–SOM Framework)
- 4.8. VDR Analyst Note
- 4.1. Porters Five Forces
- 5. Market Analysis, Insights and Forecast 2021-2033
- 5.1. Market Analysis, Insights and Forecast - by Type
- 5.1.1. Plywood
- 5.1.2. Oriented Strand Board (OSB)
- 5.1.3. Glulam
- 5.1.4. Cross-laminated Timber (CLT)
- 5.1.5. Laminated Veneer Lumber (LVL)
- 5.1.6. Particleboard
- 5.1.7. Other Types (Fiber Board, Parallel Strand, Others)
- 5.2. Market Analysis, Insights and Forecast - by Application
- 5.2.1. Non-residential
- 5.2.2. Residential
- 5.3. Market Analysis, Insights and Forecast - by Region
- 5.3.1. Asia Pacific
- 5.3.2. North America
- 5.3.3. Europe
- 5.3.4. South America
- 5.3.5. Middle East and Africa
- 5.1. Market Analysis, Insights and Forecast - by Type
- 6. Global Engineered Wood Industry Analysis, Insights and Forecast, 2021-2033
- 6.1. Market Analysis, Insights and Forecast - by Type
- 6.1.1. Plywood
- 6.1.2. Oriented Strand Board (OSB)
- 6.1.3. Glulam
- 6.1.4. Cross-laminated Timber (CLT)
- 6.1.5. Laminated Veneer Lumber (LVL)
- 6.1.6. Particleboard
- 6.1.7. Other Types (Fiber Board, Parallel Strand, Others)
- 6.2. Market Analysis, Insights and Forecast - by Application
- 6.2.1. Non-residential
- 6.2.2. Residential
- 6.1. Market Analysis, Insights and Forecast - by Type
- 7. Asia Pacific Engineered Wood Industry Analysis, Insights and Forecast, 2021-2033
- 7.1. Market Analysis, Insights and Forecast - by Type
- 7.1.1. Plywood
- 7.1.2. Oriented Strand Board (OSB)
- 7.1.3. Glulam
- 7.1.4. Cross-laminated Timber (CLT)
- 7.1.5. Laminated Veneer Lumber (LVL)
- 7.1.6. Particleboard
- 7.1.7. Other Types (Fiber Board, Parallel Strand, Others)
- 7.2. Market Analysis, Insights and Forecast - by Application
- 7.2.1. Non-residential
- 7.2.2. Residential
- 7.1. Market Analysis, Insights and Forecast - by Type
- 8. North America Engineered Wood Industry Analysis, Insights and Forecast, 2021-2033
- 8.1. Market Analysis, Insights and Forecast - by Type
- 8.1.1. Plywood
- 8.1.2. Oriented Strand Board (OSB)
- 8.1.3. Glulam
- 8.1.4. Cross-laminated Timber (CLT)
- 8.1.5. Laminated Veneer Lumber (LVL)
- 8.1.6. Particleboard
- 8.1.7. Other Types (Fiber Board, Parallel Strand, Others)
- 8.2. Market Analysis, Insights and Forecast - by Application
- 8.2.1. Non-residential
- 8.2.2. Residential
- 8.1. Market Analysis, Insights and Forecast - by Type
- 9. Europe Engineered Wood Industry Analysis, Insights and Forecast, 2021-2033
- 9.1. Market Analysis, Insights and Forecast - by Type
- 9.1.1. Plywood
- 9.1.2. Oriented Strand Board (OSB)
- 9.1.3. Glulam
- 9.1.4. Cross-laminated Timber (CLT)
- 9.1.5. Laminated Veneer Lumber (LVL)
- 9.1.6. Particleboard
- 9.1.7. Other Types (Fiber Board, Parallel Strand, Others)
- 9.2. Market Analysis, Insights and Forecast - by Application
- 9.2.1. Non-residential
- 9.2.2. Residential
- 9.1. Market Analysis, Insights and Forecast - by Type
- 10. South America Engineered Wood Industry Analysis, Insights and Forecast, 2021-2033
- 10.1. Market Analysis, Insights and Forecast - by Type
- 10.1.1. Plywood
- 10.1.2. Oriented Strand Board (OSB)
- 10.1.3. Glulam
- 10.1.4. Cross-laminated Timber (CLT)
- 10.1.5. Laminated Veneer Lumber (LVL)
- 10.1.6. Particleboard
- 10.1.7. Other Types (Fiber Board, Parallel Strand, Others)
- 10.2. Market Analysis, Insights and Forecast - by Application
- 10.2.1. Non-residential
- 10.2.2. Residential
- 10.1. Market Analysis, Insights and Forecast - by Type
- 11. Middle East and Africa Engineered Wood Industry Analysis, Insights and Forecast, 2021-2033
- 11.1. Market Analysis, Insights and Forecast - by Type
- 11.1.1. Plywood
- 11.1.2. Oriented Strand Board (OSB)
- 11.1.3. Glulam
- 11.1.4. Cross-laminated Timber (CLT)
- 11.1.5. Laminated Veneer Lumber (LVL)
- 11.1.6. Particleboard
- 11.1.7. Other Types (Fiber Board, Parallel Strand, Others)
- 11.2. Market Analysis, Insights and Forecast - by Application
- 11.2.1. Non-residential
- 11.2.2. Residential
- 11.1. Market Analysis, Insights and Forecast - by Type
- 12. Competitive Analysis
- 12.1. Company Profiles
- 12.1.1 Binderholz GmbH
- 12.1.1.1. Company Overview
- 12.1.1.2. Products
- 12.1.1.3. Company Financials
- 12.1.1.4. SWOT Analysis
- 12.1.2 Boise Cascade
- 12.1.2.1. Company Overview
- 12.1.2.2. Products
- 12.1.2.3. Company Financials
- 12.1.2.4. SWOT Analysis
- 12.1.3 Georgia-Pacific (Georgia-Pacific Wood Products LLC)
- 12.1.3.1. Company Overview
- 12.1.3.2. Products
- 12.1.3.3. Company Financials
- 12.1.3.4. SWOT Analysis
- 12.1.4 HASSLACHER Holding GmbH
- 12.1.4.1. Company Overview
- 12.1.4.2. Products
- 12.1.4.3. Company Financials
- 12.1.4.4. SWOT Analysis
- 12.1.5 Havwoods India Pvt Ltd
- 12.1.5.1. Company Overview
- 12.1.5.2. Products
- 12.1.5.3. Company Financials
- 12.1.5.4. SWOT Analysis
- 12.1.6 Huber Engineered Woods LLC
- 12.1.6.1. Company Overview
- 12.1.6.2. Products
- 12.1.6.3. Company Financials
- 12.1.6.4. SWOT Analysis
- 12.1.7 KLH Massivholz Wiesenau GmbH
- 12.1.7.1. Company Overview
- 12.1.7.2. Products
- 12.1.7.3. Company Financials
- 12.1.7.4. SWOT Analysis
- 12.1.8 Kronoplus Limited
- 12.1.8.1. Company Overview
- 12.1.8.2. Products
- 12.1.8.3. Company Financials
- 12.1.8.4. SWOT Analysis
- 12.1.9 Louisiana-Pacific Corporation
- 12.1.9.1. Company Overview
- 12.1.9.2. Products
- 12.1.9.3. Company Financials
- 12.1.9.4. SWOT Analysis
- 12.1.10 Mayr-Melnhof Holz Holding AG
- 12.1.10.1. Company Overview
- 12.1.10.2. Products
- 12.1.10.3. Company Financials
- 12.1.10.4. SWOT Analysis
- 12.1.11 Nordic Structures
- 12.1.11.1. Company Overview
- 12.1.11.2. Products
- 12.1.11.3. Company Financials
- 12.1.11.4. SWOT Analysis
- 12.1.12 Pacific Woodtech Corporation
- 12.1.12.1. Company Overview
- 12.1.12.2. Products
- 12.1.12.3. Company Financials
- 12.1.12.4. SWOT Analysis
- 12.1.13 Resolute Forest Products
- 12.1.13.1. Company Overview
- 12.1.13.2. Products
- 12.1.13.3. Company Financials
- 12.1.13.4. SWOT Analysis
- 12.1.14 Roseburg
- 12.1.14.1. Company Overview
- 12.1.14.2. Products
- 12.1.14.3. Company Financials
- 12.1.14.4. SWOT Analysis
- 12.1.15 Stora Enso
- 12.1.15.1. Company Overview
- 12.1.15.2. Products
- 12.1.15.3. Company Financials
- 12.1.15.4. SWOT Analysis
- 12.1.16 West Fraser
- 12.1.16.1. Company Overview
- 12.1.16.2. Products
- 12.1.16.3. Company Financials
- 12.1.16.4. SWOT Analysis
- 12.1.17 Weyerhaeuser Company*List Not Exhaustive
- 12.1.17.1. Company Overview
- 12.1.17.2. Products
- 12.1.17.3. Company Financials
- 12.1.17.4. SWOT Analysis
- 12.1.1 Binderholz GmbH
- 12.2. Market Entropy
- 12.2.1 Company's Key Areas Served
- 12.2.2 Recent Developments
- 12.3. Company Market Share Analysis 2025
- 12.3.1 Top 5 Companies Market Share Analysis
- 12.3.2 Top 3 Companies Market Share Analysis
- 12.4. List of Potential Customers
- 13. Research Methodology
List of Figures
- Figure 1: Global Engineered Wood Industry Revenue Breakdown (million, %) by Region 2025 & 2033
- Figure 2: Asia Pacific Engineered Wood Industry Revenue (million), by Type 2025 & 2033
- Figure 3: Asia Pacific Engineered Wood Industry Revenue Share (%), by Type 2025 & 2033
- Figure 4: Asia Pacific Engineered Wood Industry Revenue (million), by Application 2025 & 2033
- Figure 5: Asia Pacific Engineered Wood Industry Revenue Share (%), by Application 2025 & 2033
- Figure 6: Asia Pacific Engineered Wood Industry Revenue (million), by Country 2025 & 2033
- Figure 7: Asia Pacific Engineered Wood Industry Revenue Share (%), by Country 2025 & 2033
- Figure 8: North America Engineered Wood Industry Revenue (million), by Type 2025 & 2033
- Figure 9: North America Engineered Wood Industry Revenue Share (%), by Type 2025 & 2033
- Figure 10: North America Engineered Wood Industry Revenue (million), by Application 2025 & 2033
- Figure 11: North America Engineered Wood Industry Revenue Share (%), by Application 2025 & 2033
- Figure 12: North America Engineered Wood Industry Revenue (million), by Country 2025 & 2033
- Figure 13: North America Engineered Wood Industry Revenue Share (%), by Country 2025 & 2033
- Figure 14: Europe Engineered Wood Industry Revenue (million), by Type 2025 & 2033
- Figure 15: Europe Engineered Wood Industry Revenue Share (%), by Type 2025 & 2033
- Figure 16: Europe Engineered Wood Industry Revenue (million), by Application 2025 & 2033
- Figure 17: Europe Engineered Wood Industry Revenue Share (%), by Application 2025 & 2033
- Figure 18: Europe Engineered Wood Industry Revenue (million), by Country 2025 & 2033
- Figure 19: Europe Engineered Wood Industry Revenue Share (%), by Country 2025 & 2033
- Figure 20: South America Engineered Wood Industry Revenue (million), by Type 2025 & 2033
- Figure 21: South America Engineered Wood Industry Revenue Share (%), by Type 2025 & 2033
- Figure 22: South America Engineered Wood Industry Revenue (million), by Application 2025 & 2033
- Figure 23: South America Engineered Wood Industry Revenue Share (%), by Application 2025 & 2033
- Figure 24: South America Engineered Wood Industry Revenue (million), by Country 2025 & 2033
- Figure 25: South America Engineered Wood Industry Revenue Share (%), by Country 2025 & 2033
- Figure 26: Middle East and Africa Engineered Wood Industry Revenue (million), by Type 2025 & 2033
- Figure 27: Middle East and Africa Engineered Wood Industry Revenue Share (%), by Type 2025 & 2033
- Figure 28: Middle East and Africa Engineered Wood Industry Revenue (million), by Application 2025 & 2033
- Figure 29: Middle East and Africa Engineered Wood Industry Revenue Share (%), by Application 2025 & 2033
- Figure 30: Middle East and Africa Engineered Wood Industry Revenue (million), by Country 2025 & 2033
- Figure 31: Middle East and Africa Engineered Wood Industry Revenue Share (%), by Country 2025 & 2033
List of Tables
- Table 1: Global Engineered Wood Industry Revenue million Forecast, by Type 2020 & 2033
- Table 2: Global Engineered Wood Industry Revenue million Forecast, by Application 2020 & 2033
- Table 3: Global Engineered Wood Industry Revenue million Forecast, by Region 2020 & 2033
- Table 4: Global Engineered Wood Industry Revenue million Forecast, by Type 2020 & 2033
- Table 5: Global Engineered Wood Industry Revenue million Forecast, by Application 2020 & 2033
- Table 6: Global Engineered Wood Industry Revenue million Forecast, by Country 2020 & 2033
- Table 7: China Engineered Wood Industry Revenue (million) Forecast, by Application 2020 & 2033
- Table 8: India Engineered Wood Industry Revenue (million) Forecast, by Application 2020 & 2033
- Table 9: Japan Engineered Wood Industry Revenue (million) Forecast, by Application 2020 & 2033
- Table 10: South Korea Engineered Wood Industry Revenue (million) Forecast, by Application 2020 & 2033
- Table 11: Malaysia Engineered Wood Industry Revenue (million) Forecast, by Application 2020 & 2033
- Table 12: Thailand Engineered Wood Industry Revenue (million) Forecast, by Application 2020 & 2033
- Table 13: Indonesia Engineered Wood Industry Revenue (million) Forecast, by Application 2020 & 2033
- Table 14: Vietnam Engineered Wood Industry Revenue (million) Forecast, by Application 2020 & 2033
- Table 15: Rest of Asia Pacific Engineered Wood Industry Revenue (million) Forecast, by Application 2020 & 2033
- Table 16: Global Engineered Wood Industry Revenue million Forecast, by Type 2020 & 2033
- Table 17: Global Engineered Wood Industry Revenue million Forecast, by Application 2020 & 2033
- Table 18: Global Engineered Wood Industry Revenue million Forecast, by Country 2020 & 2033
- Table 19: United States Engineered Wood Industry Revenue (million) Forecast, by Application 2020 & 2033
- Table 20: Canada Engineered Wood Industry Revenue (million) Forecast, by Application 2020 & 2033
- Table 21: Mexico Engineered Wood Industry Revenue (million) Forecast, by Application 2020 & 2033
- Table 22: Global Engineered Wood Industry Revenue million Forecast, by Type 2020 & 2033
- Table 23: Global Engineered Wood Industry Revenue million Forecast, by Application 2020 & 2033
- Table 24: Global Engineered Wood Industry Revenue million Forecast, by Country 2020 & 2033
- Table 25: Germany Engineered Wood Industry Revenue (million) Forecast, by Application 2020 & 2033
- Table 26: United Kingdom Engineered Wood Industry Revenue (million) Forecast, by Application 2020 & 2033
- Table 27: France Engineered Wood Industry Revenue (million) Forecast, by Application 2020 & 2033
- Table 28: Italy Engineered Wood Industry Revenue (million) Forecast, by Application 2020 & 2033
- Table 29: Spain Engineered Wood Industry Revenue (million) Forecast, by Application 2020 & 2033
- Table 30: Turkey Engineered Wood Industry Revenue (million) Forecast, by Application 2020 & 2033
- Table 31: Russia Engineered Wood Industry Revenue (million) Forecast, by Application 2020 & 2033
- Table 32: NORDIC Countries Engineered Wood Industry Revenue (million) Forecast, by Application 2020 & 2033
- Table 33: Rest of Europe Engineered Wood Industry Revenue (million) Forecast, by Application 2020 & 2033
- Table 34: Global Engineered Wood Industry Revenue million Forecast, by Type 2020 & 2033
- Table 35: Global Engineered Wood Industry Revenue million Forecast, by Application 2020 & 2033
- Table 36: Global Engineered Wood Industry Revenue million Forecast, by Country 2020 & 2033
- Table 37: Brazil Engineered Wood Industry Revenue (million) Forecast, by Application 2020 & 2033
- Table 38: Argentina Engineered Wood Industry Revenue (million) Forecast, by Application 2020 & 2033
- Table 39: Colombia Engineered Wood Industry Revenue (million) Forecast, by Application 2020 & 2033
- Table 40: Rest of South America Engineered Wood Industry Revenue (million) Forecast, by Application 2020 & 2033
- Table 41: Global Engineered Wood Industry Revenue million Forecast, by Type 2020 & 2033
- Table 42: Global Engineered Wood Industry Revenue million Forecast, by Application 2020 & 2033
- Table 43: Global Engineered Wood Industry Revenue million Forecast, by Country 2020 & 2033
- Table 44: Saudi Arabia Engineered Wood Industry Revenue (million) Forecast, by Application 2020 & 2033
- Table 45: Nigeria Engineered Wood Industry Revenue (million) Forecast, by Application 2020 & 2033
- Table 46: Qatar Engineered Wood Industry Revenue (million) Forecast, by Application 2020 & 2033
- Table 47: Egypt Engineered Wood Industry Revenue (million) Forecast, by Application 2020 & 2033
- Table 48: United Arab Emirates Engineered Wood Industry Revenue (million) Forecast, by Application 2020 & 2033
- Table 49: South Africa Engineered Wood Industry Revenue (million) Forecast, by Application 2020 & 2033
- Table 50: Rest of Middle East and Africa Engineered Wood Industry Revenue (million) Forecast, by Application 2020 & 2033
Frequently Asked Questions
1. What is the projected Compound Annual Growth Rate (CAGR) of the Engineered Wood Industry?
The projected CAGR is approximately 4.88%.
2. Which companies are prominent players in the Engineered Wood Industry?
Key companies in the market include Binderholz GmbH, Boise Cascade, Georgia-Pacific (Georgia-Pacific Wood Products LLC), HASSLACHER Holding GmbH, Havwoods India Pvt Ltd, Huber Engineered Woods LLC, KLH Massivholz Wiesenau GmbH, Kronoplus Limited, Louisiana-Pacific Corporation, Mayr-Melnhof Holz Holding AG, Nordic Structures, Pacific Woodtech Corporation, Resolute Forest Products, Roseburg, Stora Enso, West Fraser, Weyerhaeuser Company*List Not Exhaustive.
3. What are the main segments of the Engineered Wood Industry?
The market segments include Type, Application.
4. Can you provide details about the market size?
The market size is estimated to be USD 299.11 million as of 2022.
5. What are some drivers contributing to market growth?
Growing Demand from the Non-residential Sector; Increasing Use of Cross-laminated Timber (CLT) as Construction Materials; Other Opportunities.
6. What are the notable trends driving market growth?
The Residential Segment to Dominate the Market.
7. Are there any restraints impacting market growth?
Growing Demand from the Non-residential Sector; Increasing Use of Cross-laminated Timber (CLT) as Construction Materials; Other Opportunities.
8. Can you provide examples of recent developments in the market?
December 2022: Boise Cascade expanded distribution centers in two new markets by acquiring 45 acres in Walterboro, SC, and purchasing a 34-acre land parcel in Hondo, Texas.October 2022: Boise Cascade announced the expansion of its distribution center through the acquisition of 4.67 acres of land adjacent to its Albuquerque, New Mexico branch.
9. What pricing options are available for accessing the report?
Pricing options include single-user, multi-user, and enterprise licenses priced at USD 4750, USD 5250, and USD 8750 respectively.
10. Is the market size provided in terms of value or volume?
The market size is provided in terms of value, measured in million.
11. Are there any specific market keywords associated with the report?
Yes, the market keyword associated with the report is "Engineered Wood Industry," which aids in identifying and referencing the specific market segment covered.
12. How do I determine which pricing option suits my needs best?
The pricing options vary based on user requirements and access needs. Individual users may opt for single-user licenses, while businesses requiring broader access may choose multi-user or enterprise licenses for cost-effective access to the report.
13. Are there any additional resources or data provided in the Engineered Wood Industry report?
While the report offers comprehensive insights, it's advisable to review the specific contents or supplementary materials provided to ascertain if additional resources or data are available.
14. How can I stay updated on further developments or reports in the Engineered Wood Industry?
To stay informed about further developments, trends, and reports in the Engineered Wood Industry, consider subscribing to industry newsletters, following relevant companies and organizations, or regularly checking reputable industry news sources and publications.
Methodology
Step 1 - Identification of Relevant Samples Size from Population Database


Step 2 - Approaches for Defining Global Market Size (Value, Volume* & Price*)

Note*: In applicable scenarios
Step 3 - Data Sources
Primary Research
- Web Analytics
- Survey Reports
- Research Institute
- Latest Research Reports
- Opinion Leaders
Secondary Research
- Annual Reports
- White Paper
- Latest Press Release
- Industry Association
- Paid Database
- Investor Presentations

Step 4 - Data Triangulation
Involves using different sources of information in order to increase the validity of a study
These sources are likely to be stakeholders in a program - participants, other researchers, program staff, other community members, and so on.
Then we put all data in single framework & apply various statistical tools to find out the dynamic on the market.
During the analysis stage, feedback from the stakeholder groups would be compared to determine areas of agreement as well as areas of divergence