
Key Insights
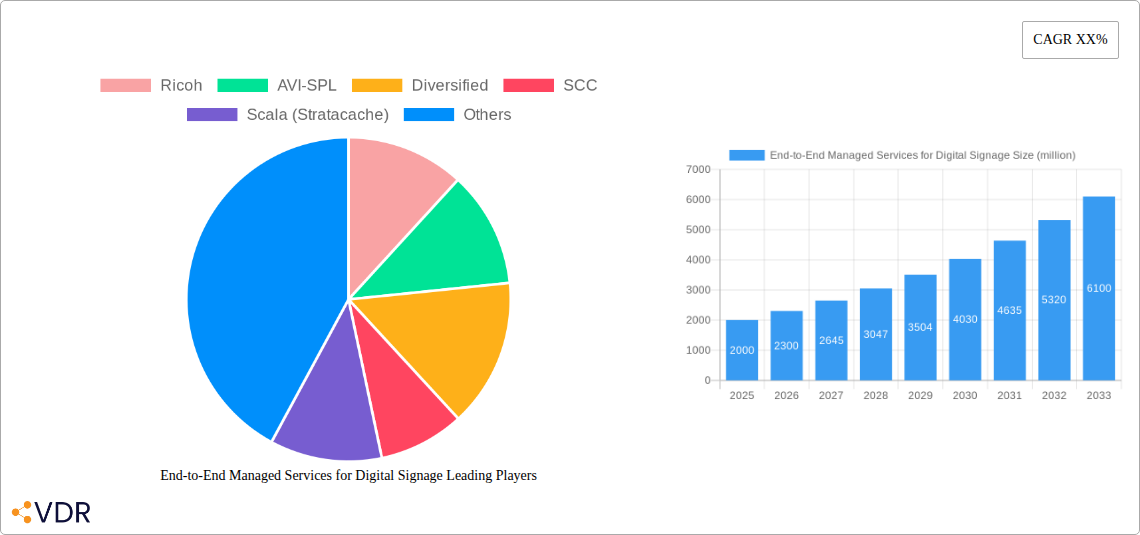
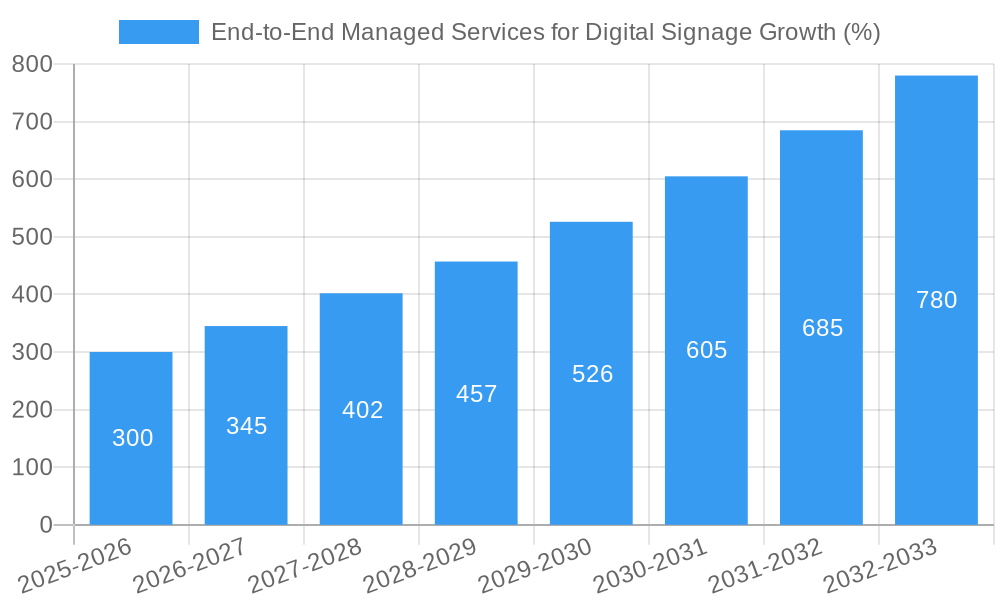
The End-to-End Managed Services for Digital Signage market is experiencing robust growth, driven by the increasing adoption of digital signage across various industries and the rising demand for streamlined, cost-effective solutions. The market, estimated at $2 billion in 2025, is projected to maintain a healthy Compound Annual Growth Rate (CAGR) of 15% from 2025 to 2033, reaching an estimated $6.5 billion by 2033. This growth is fueled by several key factors including the desire for improved customer engagement through interactive and dynamic displays, the need for centralized content management and remote monitoring capabilities, and the increasing sophistication of digital signage technology. Businesses across retail, hospitality, corporate, and transportation sectors are increasingly outsourcing the management of their digital signage networks to specialized providers, benefiting from reduced operational complexities and improved return on investment.
The market is segmented by various service types, including installation, maintenance, content management, and support. Key players like Ricoh, AVI-SPL, and Scala (Stratacache) are leveraging their expertise in technology integration and managed services to capture significant market share. However, the market also faces challenges such as high initial investment costs, the need for skilled technicians, and the ever-evolving technological landscape. To maintain competitive advantage, providers are focusing on offering flexible subscription models, integrating advanced analytics capabilities, and developing innovative solutions like AI-powered content personalization. The geographical distribution of the market shows strong growth in North America and Europe, with emerging markets in Asia-Pacific and Latin America presenting significant opportunities for expansion. Further diversification into specialized vertical markets like healthcare and education is expected to propel market growth in the coming years.
This comprehensive report delivers an in-depth analysis of the End-to-End Managed Services for Digital Signage market, encompassing market dynamics, growth trends, regional analysis, competitive landscape, and future outlook. The study period covers 2019-2033, with a base year of 2025 and a forecast period of 2025-2033. This report is essential for businesses, investors, and industry professionals seeking to understand and capitalize on the opportunities within this rapidly evolving sector. The parent market is the broader Digital Signage market, while the child market is specifically End-to-End Managed Services within that sector.
End-to-End Managed Services for Digital Signage Market Dynamics & Structure
This section analyzes the market's structure, encompassing factors influencing its growth and competitiveness. The market is characterized by a moderately fragmented landscape, with several key players competing for market share. Technological innovation, particularly in areas like AI-powered content management and cloud-based solutions, is a major driver. Regulatory frameworks, concerning data privacy and security, significantly impact market dynamics. Competitive substitutes, such as traditional print media and static displays, exert pressure. End-user demographics, increasingly favoring digital experiences across diverse sectors (retail, hospitality, corporate), fuel demand. M&A activity within the sector is moderate, with approximately xx deals valued at $xx million recorded during the historical period (2019-2024).
- Market Concentration: Moderately fragmented, with no single dominant player controlling a significant share.
- Technological Innovation: AI, cloud computing, and interactive displays are key drivers.
- Regulatory Framework: Data privacy regulations (e.g., GDPR) influence market practices.
- Competitive Substitutes: Traditional marketing and advertising methods pose competitive pressure.
- End-User Demographics: Growing adoption across diverse industries drives market expansion.
- M&A Activity: Approximately xx deals totaling $xx million during 2019-2024. (Projected).
End-to-End Managed Services for Digital Signage Growth Trends & Insights
The End-to-End Managed Services for Digital Signage market exhibits strong growth, driven by the increasing adoption of digital signage across various sectors. The market size reached $xx million in 2024 and is projected to reach $xx million by 2033, exhibiting a CAGR of xx% during the forecast period (2025-2033). This growth is fueled by factors such as the rising need for efficient content management, enhanced customer engagement strategies, and the integration of advanced analytics. Technological advancements, such as the integration of IoT devices and improved software solutions, further propel market expansion. Consumer behavior shifts towards personalized and engaging digital experiences are also contributing to higher adoption rates. Market penetration in key sectors is steadily increasing, exceeding xx% in retail and corporate segments by 2025.
Dominant Regions, Countries, or Segments in End-to-End Managed Services for Digital Signage
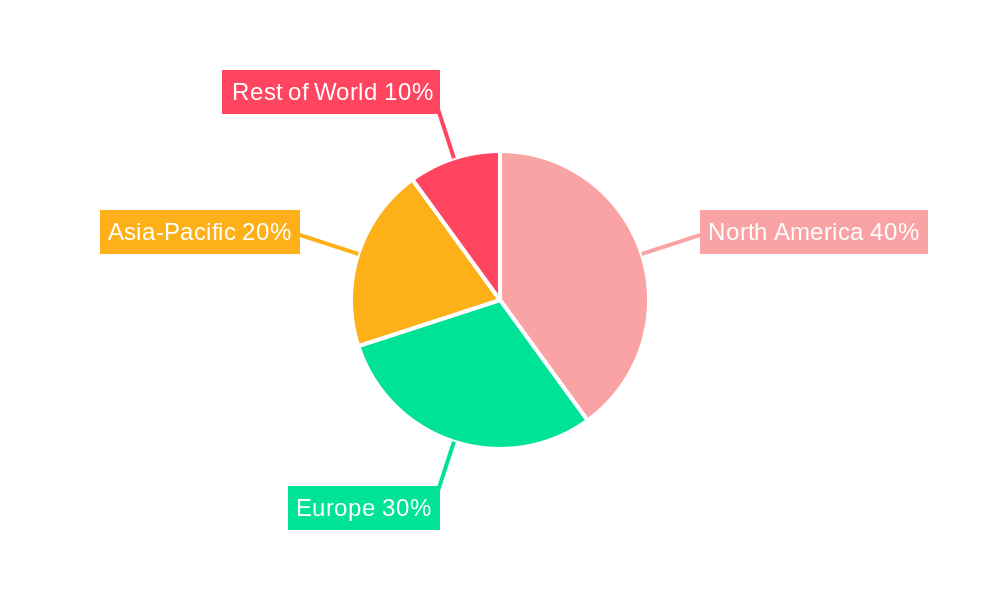
North America currently holds the leading position in the End-to-End Managed Services for Digital Signage market, driven by robust technological advancements, high digital adoption rates, and strong economic growth. Europe follows closely, with significant growth in Western European countries. Asia-Pacific is experiencing rapid growth, fueled by rising digital infrastructure investments and increasing disposable income.
- North America: High digital adoption, advanced technology infrastructure, and strong economic growth.
- Europe: Significant growth in Western European countries, driven by increasing digitalization across various sectors.
- Asia-Pacific: Rapid expansion due to infrastructure development and rising disposable income.
End-to-End Managed Services for Digital Signage Product Landscape
The End-to-End Managed Services for Digital Signage market offers a range of solutions, encompassing hardware, software, and professional services. Products are increasingly integrated, featuring advanced features such as AI-powered content management, cloud-based platforms, and remote monitoring capabilities. Key innovations include the development of more efficient and user-friendly software, improved analytics tools, and the seamless integration of different technologies. These solutions aim to deliver cost-effective, scalable, and user-friendly digital signage management capabilities.
Key Drivers, Barriers & Challenges in End-to-End Managed Services for Digital Signage
Key Drivers: The increasing demand for enhanced customer experiences, the need for efficient content management, and the integration of data analytics drive market growth. Technological advancements, such as AI and cloud computing, further accelerate adoption. Government initiatives promoting digitalization across industries also contribute significantly.
Challenges: High initial investment costs, complex integration processes, and the need for specialized technical expertise can hinder market penetration. Competition from established players and emerging technologies poses challenges. Supply chain disruptions and cybersecurity threats also represent significant risks.
Emerging Opportunities in End-to-End Managed Services for Digital Signage
Emerging opportunities lie in the integration of cutting-edge technologies like augmented reality (AR) and virtual reality (VR), creating immersive experiences for consumers. Untapped markets in developing economies present significant growth potential. The rising demand for personalized digital signage experiences opens new avenues for customized solutions. The growing focus on data-driven decision making and analytics presents opportunities for enhanced reporting and business intelligence integration.
Growth Accelerators in the End-to-End Managed Services for Digital Signage Industry
Strategic partnerships between technology providers and digital signage deployment companies are key growth catalysts. Technological advancements such as AI-powered content optimization and improved remote management capabilities further accelerate market expansion. The increasing adoption of cloud-based solutions and the growing trend towards integrated digital signage platforms contribute significantly to long-term growth. Expansion into new sectors and geographic markets will unlock considerable market potential.
Key Players Shaping the End-to-End Managed Services for Digital Signage Market
- Ricoh
- AVI-SPL
- Diversified
- SCC
- Scala (Stratacache)
- SageNet
- AVI Systems
- Ford AV
- Kinly
- Bluewater Technologies
- NWN Carousel
- Yorktel
- Connected Technologies
- Maler Digital Signage
- Velocity
- Crystal Clear IT Business Services
- Teksetra
- Xpodigital
- Create Margin
- Wixalia
- SignCast Media
- Uniguest
- Saturn Visual
- Stargel Office Solutions
- Solutionz
- Creative Realities
- Bluum Technology
- CCS Presentation Systems
- Avidex
Notable Milestones in End-to-End Managed Services for Digital Signage Sector
- 2020-Q4: Launch of AI-powered content management platform by a major player.
- 2021-Q2: Acquisition of a smaller digital signage company by a larger firm, increasing market consolidation.
- 2022-Q3: Introduction of a new cloud-based digital signage platform with enhanced analytics capabilities.
- 2023-Q1: Several key players announced partnerships to expand their market reach and product offerings. (Further details would need to be added based on available data).
In-Depth End-to-End Managed Services for Digital Signage Market Outlook
The End-to-End Managed Services for Digital Signage market is poised for sustained growth over the next decade, driven by the continued adoption of digital signage across diverse industries and the integration of cutting-edge technologies. Opportunities exist in expanding into new markets, developing innovative applications, and creating personalized digital experiences. Strategic partnerships and technological advancements will continue to shape the competitive landscape, offering significant opportunities for both established players and new entrants. The market is expected to experience substantial growth, driven by factors mentioned above, promising considerable returns for investors and companies participating in this dynamic market.
End-to-End Managed Services for Digital Signage Segmentation
-
1. Application
- 1.1. Large Enterprises
- 1.2. SMEs
-
2. Types
- 2.1. Content Management Services
- 2.2. Hardware Management Services
- 2.3. Others
End-to-End Managed Services for Digital Signage Segmentation By Geography
-
1. North America
- 1.1. United States
- 1.2. Canada
- 1.3. Mexico
-
2. South America
- 2.1. Brazil
- 2.2. Argentina
- 2.3. Rest of South America
-
3. Europe
- 3.1. United Kingdom
- 3.2. Germany
- 3.3. France
- 3.4. Italy
- 3.5. Spain
- 3.6. Russia
- 3.7. Benelux
- 3.8. Nordics
- 3.9. Rest of Europe
-
4. Middle East & Africa
- 4.1. Turkey
- 4.2. Israel
- 4.3. GCC
- 4.4. North Africa
- 4.5. South Africa
- 4.6. Rest of Middle East & Africa
-
5. Asia Pacific
- 5.1. China
- 5.2. India
- 5.3. Japan
- 5.4. South Korea
- 5.5. ASEAN
- 5.6. Oceania
- 5.7. Rest of Asia Pacific
End-to-End Managed Services for Digital Signage REPORT HIGHLIGHTS
| Aspects | Details |
|---|---|
| Study Period | 2019-2033 |
| Base Year | 2024 |
| Estimated Year | 2025 |
| Forecast Period | 2025-2033 |
| Historical Period | 2019-2024 |
| Growth Rate | CAGR of XX% from 2019-2033 |
| Segmentation |
|
Table of Contents
- 1. Introduction
- 1.1. Research Scope
- 1.2. Market Segmentation
- 1.3. Research Methodology
- 1.4. Definitions and Assumptions
- 2. Executive Summary
- 2.1. Introduction
- 3. Market Dynamics
- 3.1. Introduction
- 3.2. Market Drivers
- 3.3. Market Restrains
- 3.4. Market Trends
- 4. Market Factor Analysis
- 4.1. Porters Five Forces
- 4.2. Supply/Value Chain
- 4.3. PESTEL analysis
- 4.4. Market Entropy
- 4.5. Patent/Trademark Analysis
- 5. Global End-to-End Managed Services for Digital Signage Analysis, Insights and Forecast, 2019-2031
- 5.1. Market Analysis, Insights and Forecast - by Application
- 5.1.1. Large Enterprises
- 5.1.2. SMEs
- 5.2. Market Analysis, Insights and Forecast - by Types
- 5.2.1. Content Management Services
- 5.2.2. Hardware Management Services
- 5.2.3. Others
- 5.3. Market Analysis, Insights and Forecast - by Region
- 5.3.1. North America
- 5.3.2. South America
- 5.3.3. Europe
- 5.3.4. Middle East & Africa
- 5.3.5. Asia Pacific
- 5.1. Market Analysis, Insights and Forecast - by Application
- 6. North America End-to-End Managed Services for Digital Signage Analysis, Insights and Forecast, 2019-2031
- 6.1. Market Analysis, Insights and Forecast - by Application
- 6.1.1. Large Enterprises
- 6.1.2. SMEs
- 6.2. Market Analysis, Insights and Forecast - by Types
- 6.2.1. Content Management Services
- 6.2.2. Hardware Management Services
- 6.2.3. Others
- 6.1. Market Analysis, Insights and Forecast - by Application
- 7. South America End-to-End Managed Services for Digital Signage Analysis, Insights and Forecast, 2019-2031
- 7.1. Market Analysis, Insights and Forecast - by Application
- 7.1.1. Large Enterprises
- 7.1.2. SMEs
- 7.2. Market Analysis, Insights and Forecast - by Types
- 7.2.1. Content Management Services
- 7.2.2. Hardware Management Services
- 7.2.3. Others
- 7.1. Market Analysis, Insights and Forecast - by Application
- 8. Europe End-to-End Managed Services for Digital Signage Analysis, Insights and Forecast, 2019-2031
- 8.1. Market Analysis, Insights and Forecast - by Application
- 8.1.1. Large Enterprises
- 8.1.2. SMEs
- 8.2. Market Analysis, Insights and Forecast - by Types
- 8.2.1. Content Management Services
- 8.2.2. Hardware Management Services
- 8.2.3. Others
- 8.1. Market Analysis, Insights and Forecast - by Application
- 9. Middle East & Africa End-to-End Managed Services for Digital Signage Analysis, Insights and Forecast, 2019-2031
- 9.1. Market Analysis, Insights and Forecast - by Application
- 9.1.1. Large Enterprises
- 9.1.2. SMEs
- 9.2. Market Analysis, Insights and Forecast - by Types
- 9.2.1. Content Management Services
- 9.2.2. Hardware Management Services
- 9.2.3. Others
- 9.1. Market Analysis, Insights and Forecast - by Application
- 10. Asia Pacific End-to-End Managed Services for Digital Signage Analysis, Insights and Forecast, 2019-2031
- 10.1. Market Analysis, Insights and Forecast - by Application
- 10.1.1. Large Enterprises
- 10.1.2. SMEs
- 10.2. Market Analysis, Insights and Forecast - by Types
- 10.2.1. Content Management Services
- 10.2.2. Hardware Management Services
- 10.2.3. Others
- 10.1. Market Analysis, Insights and Forecast - by Application
- 11. Competitive Analysis
- 11.1. Global Market Share Analysis 2024
- 11.2. Company Profiles
- 11.2.1 Ricoh
- 11.2.1.1. Overview
- 11.2.1.2. Products
- 11.2.1.3. SWOT Analysis
- 11.2.1.4. Recent Developments
- 11.2.1.5. Financials (Based on Availability)
- 11.2.2 AVI-SPL
- 11.2.2.1. Overview
- 11.2.2.2. Products
- 11.2.2.3. SWOT Analysis
- 11.2.2.4. Recent Developments
- 11.2.2.5. Financials (Based on Availability)
- 11.2.3 Diversified
- 11.2.3.1. Overview
- 11.2.3.2. Products
- 11.2.3.3. SWOT Analysis
- 11.2.3.4. Recent Developments
- 11.2.3.5. Financials (Based on Availability)
- 11.2.4 SCC
- 11.2.4.1. Overview
- 11.2.4.2. Products
- 11.2.4.3. SWOT Analysis
- 11.2.4.4. Recent Developments
- 11.2.4.5. Financials (Based on Availability)
- 11.2.5 Scala (Stratacache)
- 11.2.5.1. Overview
- 11.2.5.2. Products
- 11.2.5.3. SWOT Analysis
- 11.2.5.4. Recent Developments
- 11.2.5.5. Financials (Based on Availability)
- 11.2.6 SageNet
- 11.2.6.1. Overview
- 11.2.6.2. Products
- 11.2.6.3. SWOT Analysis
- 11.2.6.4. Recent Developments
- 11.2.6.5. Financials (Based on Availability)
- 11.2.7 AVI Systems
- 11.2.7.1. Overview
- 11.2.7.2. Products
- 11.2.7.3. SWOT Analysis
- 11.2.7.4. Recent Developments
- 11.2.7.5. Financials (Based on Availability)
- 11.2.8 Ford AV
- 11.2.8.1. Overview
- 11.2.8.2. Products
- 11.2.8.3. SWOT Analysis
- 11.2.8.4. Recent Developments
- 11.2.8.5. Financials (Based on Availability)
- 11.2.9 Kinly
- 11.2.9.1. Overview
- 11.2.9.2. Products
- 11.2.9.3. SWOT Analysis
- 11.2.9.4. Recent Developments
- 11.2.9.5. Financials (Based on Availability)
- 11.2.10 Bluewater Technologies
- 11.2.10.1. Overview
- 11.2.10.2. Products
- 11.2.10.3. SWOT Analysis
- 11.2.10.4. Recent Developments
- 11.2.10.5. Financials (Based on Availability)
- 11.2.11 NWN Carousel
- 11.2.11.1. Overview
- 11.2.11.2. Products
- 11.2.11.3. SWOT Analysis
- 11.2.11.4. Recent Developments
- 11.2.11.5. Financials (Based on Availability)
- 11.2.12 Yorktel
- 11.2.12.1. Overview
- 11.2.12.2. Products
- 11.2.12.3. SWOT Analysis
- 11.2.12.4. Recent Developments
- 11.2.12.5. Financials (Based on Availability)
- 11.2.13 Connected Technologies
- 11.2.13.1. Overview
- 11.2.13.2. Products
- 11.2.13.3. SWOT Analysis
- 11.2.13.4. Recent Developments
- 11.2.13.5. Financials (Based on Availability)
- 11.2.14 Maler Digital Signage
- 11.2.14.1. Overview
- 11.2.14.2. Products
- 11.2.14.3. SWOT Analysis
- 11.2.14.4. Recent Developments
- 11.2.14.5. Financials (Based on Availability)
- 11.2.15 Velocity
- 11.2.15.1. Overview
- 11.2.15.2. Products
- 11.2.15.3. SWOT Analysis
- 11.2.15.4. Recent Developments
- 11.2.15.5. Financials (Based on Availability)
- 11.2.16 Crystal Clear IT Business Services
- 11.2.16.1. Overview
- 11.2.16.2. Products
- 11.2.16.3. SWOT Analysis
- 11.2.16.4. Recent Developments
- 11.2.16.5. Financials (Based on Availability)
- 11.2.17 Teksetra
- 11.2.17.1. Overview
- 11.2.17.2. Products
- 11.2.17.3. SWOT Analysis
- 11.2.17.4. Recent Developments
- 11.2.17.5. Financials (Based on Availability)
- 11.2.18 Xpodigital
- 11.2.18.1. Overview
- 11.2.18.2. Products
- 11.2.18.3. SWOT Analysis
- 11.2.18.4. Recent Developments
- 11.2.18.5. Financials (Based on Availability)
- 11.2.19 Create Margin
- 11.2.19.1. Overview
- 11.2.19.2. Products
- 11.2.19.3. SWOT Analysis
- 11.2.19.4. Recent Developments
- 11.2.19.5. Financials (Based on Availability)
- 11.2.20 Wixalia
- 11.2.20.1. Overview
- 11.2.20.2. Products
- 11.2.20.3. SWOT Analysis
- 11.2.20.4. Recent Developments
- 11.2.20.5. Financials (Based on Availability)
- 11.2.21 SignCast Media
- 11.2.21.1. Overview
- 11.2.21.2. Products
- 11.2.21.3. SWOT Analysis
- 11.2.21.4. Recent Developments
- 11.2.21.5. Financials (Based on Availability)
- 11.2.22 Uniguest
- 11.2.22.1. Overview
- 11.2.22.2. Products
- 11.2.22.3. SWOT Analysis
- 11.2.22.4. Recent Developments
- 11.2.22.5. Financials (Based on Availability)
- 11.2.23 Saturn Visual
- 11.2.23.1. Overview
- 11.2.23.2. Products
- 11.2.23.3. SWOT Analysis
- 11.2.23.4. Recent Developments
- 11.2.23.5. Financials (Based on Availability)
- 11.2.24 Stargel Office Solutions
- 11.2.24.1. Overview
- 11.2.24.2. Products
- 11.2.24.3. SWOT Analysis
- 11.2.24.4. Recent Developments
- 11.2.24.5. Financials (Based on Availability)
- 11.2.25 Solutionz
- 11.2.25.1. Overview
- 11.2.25.2. Products
- 11.2.25.3. SWOT Analysis
- 11.2.25.4. Recent Developments
- 11.2.25.5. Financials (Based on Availability)
- 11.2.26 Creative Realities
- 11.2.26.1. Overview
- 11.2.26.2. Products
- 11.2.26.3. SWOT Analysis
- 11.2.26.4. Recent Developments
- 11.2.26.5. Financials (Based on Availability)
- 11.2.27 Bluum Technology
- 11.2.27.1. Overview
- 11.2.27.2. Products
- 11.2.27.3. SWOT Analysis
- 11.2.27.4. Recent Developments
- 11.2.27.5. Financials (Based on Availability)
- 11.2.28 CCS Presentation Systems
- 11.2.28.1. Overview
- 11.2.28.2. Products
- 11.2.28.3. SWOT Analysis
- 11.2.28.4. Recent Developments
- 11.2.28.5. Financials (Based on Availability)
- 11.2.29 Avidex
- 11.2.29.1. Overview
- 11.2.29.2. Products
- 11.2.29.3. SWOT Analysis
- 11.2.29.4. Recent Developments
- 11.2.29.5. Financials (Based on Availability)
- 11.2.1 Ricoh
List of Figures
- Figure 1: Global End-to-End Managed Services for Digital Signage Revenue Breakdown (million, %) by Region 2024 & 2032
- Figure 2: North America End-to-End Managed Services for Digital Signage Revenue (million), by Application 2024 & 2032
- Figure 3: North America End-to-End Managed Services for Digital Signage Revenue Share (%), by Application 2024 & 2032
- Figure 4: North America End-to-End Managed Services for Digital Signage Revenue (million), by Types 2024 & 2032
- Figure 5: North America End-to-End Managed Services for Digital Signage Revenue Share (%), by Types 2024 & 2032
- Figure 6: North America End-to-End Managed Services for Digital Signage Revenue (million), by Country 2024 & 2032
- Figure 7: North America End-to-End Managed Services for Digital Signage Revenue Share (%), by Country 2024 & 2032
- Figure 8: South America End-to-End Managed Services for Digital Signage Revenue (million), by Application 2024 & 2032
- Figure 9: South America End-to-End Managed Services for Digital Signage Revenue Share (%), by Application 2024 & 2032
- Figure 10: South America End-to-End Managed Services for Digital Signage Revenue (million), by Types 2024 & 2032
- Figure 11: South America End-to-End Managed Services for Digital Signage Revenue Share (%), by Types 2024 & 2032
- Figure 12: South America End-to-End Managed Services for Digital Signage Revenue (million), by Country 2024 & 2032
- Figure 13: South America End-to-End Managed Services for Digital Signage Revenue Share (%), by Country 2024 & 2032
- Figure 14: Europe End-to-End Managed Services for Digital Signage Revenue (million), by Application 2024 & 2032
- Figure 15: Europe End-to-End Managed Services for Digital Signage Revenue Share (%), by Application 2024 & 2032
- Figure 16: Europe End-to-End Managed Services for Digital Signage Revenue (million), by Types 2024 & 2032
- Figure 17: Europe End-to-End Managed Services for Digital Signage Revenue Share (%), by Types 2024 & 2032
- Figure 18: Europe End-to-End Managed Services for Digital Signage Revenue (million), by Country 2024 & 2032
- Figure 19: Europe End-to-End Managed Services for Digital Signage Revenue Share (%), by Country 2024 & 2032
- Figure 20: Middle East & Africa End-to-End Managed Services for Digital Signage Revenue (million), by Application 2024 & 2032
- Figure 21: Middle East & Africa End-to-End Managed Services for Digital Signage Revenue Share (%), by Application 2024 & 2032
- Figure 22: Middle East & Africa End-to-End Managed Services for Digital Signage Revenue (million), by Types 2024 & 2032
- Figure 23: Middle East & Africa End-to-End Managed Services for Digital Signage Revenue Share (%), by Types 2024 & 2032
- Figure 24: Middle East & Africa End-to-End Managed Services for Digital Signage Revenue (million), by Country 2024 & 2032
- Figure 25: Middle East & Africa End-to-End Managed Services for Digital Signage Revenue Share (%), by Country 2024 & 2032
- Figure 26: Asia Pacific End-to-End Managed Services for Digital Signage Revenue (million), by Application 2024 & 2032
- Figure 27: Asia Pacific End-to-End Managed Services for Digital Signage Revenue Share (%), by Application 2024 & 2032
- Figure 28: Asia Pacific End-to-End Managed Services for Digital Signage Revenue (million), by Types 2024 & 2032
- Figure 29: Asia Pacific End-to-End Managed Services for Digital Signage Revenue Share (%), by Types 2024 & 2032
- Figure 30: Asia Pacific End-to-End Managed Services for Digital Signage Revenue (million), by Country 2024 & 2032
- Figure 31: Asia Pacific End-to-End Managed Services for Digital Signage Revenue Share (%), by Country 2024 & 2032
List of Tables
- Table 1: Global End-to-End Managed Services for Digital Signage Revenue million Forecast, by Region 2019 & 2032
- Table 2: Global End-to-End Managed Services for Digital Signage Revenue million Forecast, by Application 2019 & 2032
- Table 3: Global End-to-End Managed Services for Digital Signage Revenue million Forecast, by Types 2019 & 2032
- Table 4: Global End-to-End Managed Services for Digital Signage Revenue million Forecast, by Region 2019 & 2032
- Table 5: Global End-to-End Managed Services for Digital Signage Revenue million Forecast, by Application 2019 & 2032
- Table 6: Global End-to-End Managed Services for Digital Signage Revenue million Forecast, by Types 2019 & 2032
- Table 7: Global End-to-End Managed Services for Digital Signage Revenue million Forecast, by Country 2019 & 2032
- Table 8: United States End-to-End Managed Services for Digital Signage Revenue (million) Forecast, by Application 2019 & 2032
- Table 9: Canada End-to-End Managed Services for Digital Signage Revenue (million) Forecast, by Application 2019 & 2032
- Table 10: Mexico End-to-End Managed Services for Digital Signage Revenue (million) Forecast, by Application 2019 & 2032
- Table 11: Global End-to-End Managed Services for Digital Signage Revenue million Forecast, by Application 2019 & 2032
- Table 12: Global End-to-End Managed Services for Digital Signage Revenue million Forecast, by Types 2019 & 2032
- Table 13: Global End-to-End Managed Services for Digital Signage Revenue million Forecast, by Country 2019 & 2032
- Table 14: Brazil End-to-End Managed Services for Digital Signage Revenue (million) Forecast, by Application 2019 & 2032
- Table 15: Argentina End-to-End Managed Services for Digital Signage Revenue (million) Forecast, by Application 2019 & 2032
- Table 16: Rest of South America End-to-End Managed Services for Digital Signage Revenue (million) Forecast, by Application 2019 & 2032
- Table 17: Global End-to-End Managed Services for Digital Signage Revenue million Forecast, by Application 2019 & 2032
- Table 18: Global End-to-End Managed Services for Digital Signage Revenue million Forecast, by Types 2019 & 2032
- Table 19: Global End-to-End Managed Services for Digital Signage Revenue million Forecast, by Country 2019 & 2032
- Table 20: United Kingdom End-to-End Managed Services for Digital Signage Revenue (million) Forecast, by Application 2019 & 2032
- Table 21: Germany End-to-End Managed Services for Digital Signage Revenue (million) Forecast, by Application 2019 & 2032
- Table 22: France End-to-End Managed Services for Digital Signage Revenue (million) Forecast, by Application 2019 & 2032
- Table 23: Italy End-to-End Managed Services for Digital Signage Revenue (million) Forecast, by Application 2019 & 2032
- Table 24: Spain End-to-End Managed Services for Digital Signage Revenue (million) Forecast, by Application 2019 & 2032
- Table 25: Russia End-to-End Managed Services for Digital Signage Revenue (million) Forecast, by Application 2019 & 2032
- Table 26: Benelux End-to-End Managed Services for Digital Signage Revenue (million) Forecast, by Application 2019 & 2032
- Table 27: Nordics End-to-End Managed Services for Digital Signage Revenue (million) Forecast, by Application 2019 & 2032
- Table 28: Rest of Europe End-to-End Managed Services for Digital Signage Revenue (million) Forecast, by Application 2019 & 2032
- Table 29: Global End-to-End Managed Services for Digital Signage Revenue million Forecast, by Application 2019 & 2032
- Table 30: Global End-to-End Managed Services for Digital Signage Revenue million Forecast, by Types 2019 & 2032
- Table 31: Global End-to-End Managed Services for Digital Signage Revenue million Forecast, by Country 2019 & 2032
- Table 32: Turkey End-to-End Managed Services for Digital Signage Revenue (million) Forecast, by Application 2019 & 2032
- Table 33: Israel End-to-End Managed Services for Digital Signage Revenue (million) Forecast, by Application 2019 & 2032
- Table 34: GCC End-to-End Managed Services for Digital Signage Revenue (million) Forecast, by Application 2019 & 2032
- Table 35: North Africa End-to-End Managed Services for Digital Signage Revenue (million) Forecast, by Application 2019 & 2032
- Table 36: South Africa End-to-End Managed Services for Digital Signage Revenue (million) Forecast, by Application 2019 & 2032
- Table 37: Rest of Middle East & Africa End-to-End Managed Services for Digital Signage Revenue (million) Forecast, by Application 2019 & 2032
- Table 38: Global End-to-End Managed Services for Digital Signage Revenue million Forecast, by Application 2019 & 2032
- Table 39: Global End-to-End Managed Services for Digital Signage Revenue million Forecast, by Types 2019 & 2032
- Table 40: Global End-to-End Managed Services for Digital Signage Revenue million Forecast, by Country 2019 & 2032
- Table 41: China End-to-End Managed Services for Digital Signage Revenue (million) Forecast, by Application 2019 & 2032
- Table 42: India End-to-End Managed Services for Digital Signage Revenue (million) Forecast, by Application 2019 & 2032
- Table 43: Japan End-to-End Managed Services for Digital Signage Revenue (million) Forecast, by Application 2019 & 2032
- Table 44: South Korea End-to-End Managed Services for Digital Signage Revenue (million) Forecast, by Application 2019 & 2032
- Table 45: ASEAN End-to-End Managed Services for Digital Signage Revenue (million) Forecast, by Application 2019 & 2032
- Table 46: Oceania End-to-End Managed Services for Digital Signage Revenue (million) Forecast, by Application 2019 & 2032
- Table 47: Rest of Asia Pacific End-to-End Managed Services for Digital Signage Revenue (million) Forecast, by Application 2019 & 2032
Frequently Asked Questions
1. What is the projected Compound Annual Growth Rate (CAGR) of the End-to-End Managed Services for Digital Signage?
The projected CAGR is approximately XX%.
2. Which companies are prominent players in the End-to-End Managed Services for Digital Signage?
Key companies in the market include Ricoh, AVI-SPL, Diversified, SCC, Scala (Stratacache), SageNet, AVI Systems, Ford AV, Kinly, Bluewater Technologies, NWN Carousel, Yorktel, Connected Technologies, Maler Digital Signage, Velocity, Crystal Clear IT Business Services, Teksetra, Xpodigital, Create Margin, Wixalia, SignCast Media, Uniguest, Saturn Visual, Stargel Office Solutions, Solutionz, Creative Realities, Bluum Technology, CCS Presentation Systems, Avidex.
3. What are the main segments of the End-to-End Managed Services for Digital Signage?
The market segments include Application, Types.
4. Can you provide details about the market size?
The market size is estimated to be USD XXX million as of 2022.
5. What are some drivers contributing to market growth?
N/A
6. What are the notable trends driving market growth?
N/A
7. Are there any restraints impacting market growth?
N/A
8. Can you provide examples of recent developments in the market?
N/A
9. What pricing options are available for accessing the report?
Pricing options include single-user, multi-user, and enterprise licenses priced at USD 2900.00, USD 4350.00, and USD 5800.00 respectively.
10. Is the market size provided in terms of value or volume?
The market size is provided in terms of value, measured in million.
11. Are there any specific market keywords associated with the report?
Yes, the market keyword associated with the report is "End-to-End Managed Services for Digital Signage," which aids in identifying and referencing the specific market segment covered.
12. How do I determine which pricing option suits my needs best?
The pricing options vary based on user requirements and access needs. Individual users may opt for single-user licenses, while businesses requiring broader access may choose multi-user or enterprise licenses for cost-effective access to the report.
13. Are there any additional resources or data provided in the End-to-End Managed Services for Digital Signage report?
While the report offers comprehensive insights, it's advisable to review the specific contents or supplementary materials provided to ascertain if additional resources or data are available.
14. How can I stay updated on further developments or reports in the End-to-End Managed Services for Digital Signage?
To stay informed about further developments, trends, and reports in the End-to-End Managed Services for Digital Signage, consider subscribing to industry newsletters, following relevant companies and organizations, or regularly checking reputable industry news sources and publications.
Methodology
Step 1 - Identification of Relevant Samples Size from Population Database


Step 2 - Approaches for Defining Global Market Size (Value, Volume* & Price*)

Note*: In applicable scenarios
Step 3 - Data Sources
Primary Research
- Web Analytics
- Survey Reports
- Research Institute
- Latest Research Reports
- Opinion Leaders
Secondary Research
- Annual Reports
- White Paper
- Latest Press Release
- Industry Association
- Paid Database
- Investor Presentations

Step 4 - Data Triangulation
Involves using different sources of information in order to increase the validity of a study
These sources are likely to be stakeholders in a program - participants, other researchers, program staff, other community members, and so on.
Then we put all data in single framework & apply various statistical tools to find out the dynamic on the market.
During the analysis stage, feedback from the stakeholder groups would be compared to determine areas of agreement as well as areas of divergence


