
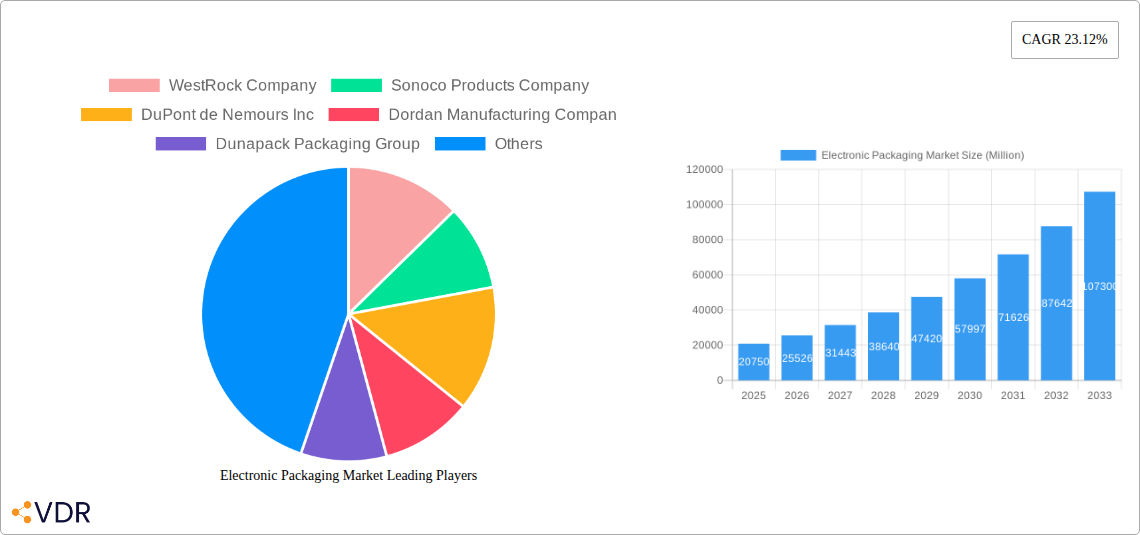
Key Insights
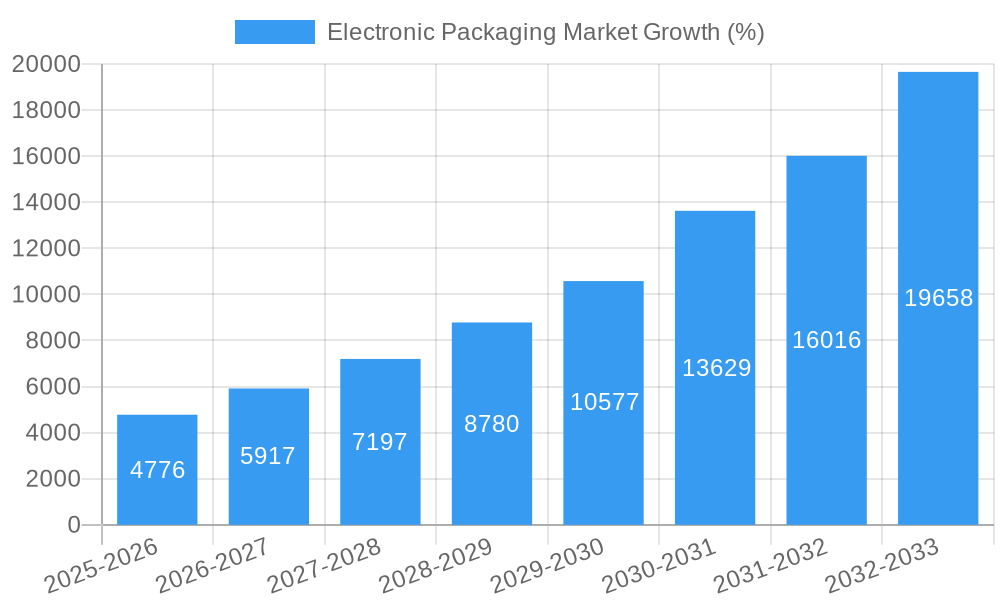
The electronic packaging market, valued at $20.75 billion in 2025, is projected to experience robust growth, exhibiting a Compound Annual Growth Rate (CAGR) of 23.12% from 2025 to 2033. This expansion is driven by several key factors. The proliferation of consumer electronics, particularly smartphones, wearables, and IoT devices, fuels significant demand for sophisticated and miniaturized packaging solutions. Advancements in technology, such as the rise of 5G and the increasing adoption of Artificial Intelligence (AI) and machine learning in electronics, necessitate increasingly complex and protective packaging to ensure optimal performance and longevity. Furthermore, the growth of the automotive and aerospace industries, with their emphasis on lightweighting and enhanced electronic functionality, is contributing to market expansion. Stringent regulatory standards regarding environmental sustainability and the growing demand for eco-friendly packaging materials, such as biodegradable plastics and recycled content, are also shaping market trends.
However, the market faces certain challenges. Fluctuations in raw material prices, particularly for metals and plastics, can impact profitability. Supply chain disruptions and geopolitical instability can also pose risks to consistent production and delivery. Despite these restraints, the long-term outlook for the electronic packaging market remains positive. Continued innovation in materials science, the development of advanced packaging techniques, and the ongoing miniaturization of electronic components are expected to fuel substantial growth in the coming years. The market's segmentation by material (plastic, metal, glass) and end-user industry (consumer electronics, aerospace and defense, automotive, healthcare) offers diverse opportunities for manufacturers to specialize and cater to specific needs, further driving market expansion.
Electronic Packaging Market Report: 2019-2033
This comprehensive report provides a detailed analysis of the Electronic Packaging Market, encompassing market dynamics, growth trends, regional dominance, product landscape, key players, and future outlook. With a study period spanning 2019-2033, a base year of 2025, and a forecast period of 2025-2033, this report offers invaluable insights for industry professionals, investors, and stakeholders seeking to navigate this evolving market. The report segments the market by material (plastic, metal, glass) and end-user industry (consumer electronics, aerospace & defense, automotive, healthcare).
Electronic Packaging Market Market Dynamics & Structure
The Electronic Packaging Market exhibits a moderately concentrated structure, with key players holding significant market share. Market concentration is influenced by factors such as economies of scale, technological expertise, and established distribution networks. The market is characterized by continuous technological innovation, driven by the need for lighter, more durable, and environmentally friendly packaging solutions. Stringent regulatory frameworks concerning material recyclability and waste reduction significantly impact product development and manufacturing processes. The market also faces competition from alternative packaging materials and technologies, constantly influencing material selection and design approaches. End-user demographics, specifically the growing demand for electronics in developing economies, further shape market growth. Mergers and acquisitions (M&A) activity remains prevalent, reflecting consolidation trends and strategic expansion efforts. The past five years saw approximately xx M&A deals, resulting in a market share shift of approximately xx%.
- Market Concentration: Moderately concentrated, with top 5 players holding approximately xx% market share.
- Technological Innovation: Focus on lightweighting, improved durability, and sustainable materials (e.g., bioplastics).
- Regulatory Landscape: Stringent regulations on waste management and material recyclability impacting product design.
- Competitive Substitutes: Competition from alternative materials (e.g., paperboard, biodegradable plastics) and packaging technologies.
- End-User Demographics: Growing demand from emerging economies fuels market expansion.
- M&A Activity: Significant consolidation activity observed, with xx deals in the past five years.
Electronic Packaging Market Growth Trends & Insights
The Electronic Packaging Market is experiencing robust growth, driven by the burgeoning consumer electronics sector and increasing demand for advanced packaging solutions across various industries. The market size is projected to reach xx million units by 2025 and is expected to exhibit a Compound Annual Growth Rate (CAGR) of xx% during the forecast period (2025-2033). This growth is attributed to several factors, including the increasing adoption of electronic devices, advancements in packaging technologies, and the rising focus on sustainable and eco-friendly packaging solutions. Technological disruptions, such as the emergence of 3D printing and automated packaging systems, are transforming manufacturing processes and influencing the overall market dynamics. Changing consumer preferences towards convenience and product safety further shape the demands for innovative packaging designs. Market penetration is expected to reach approximately xx% by 2033.
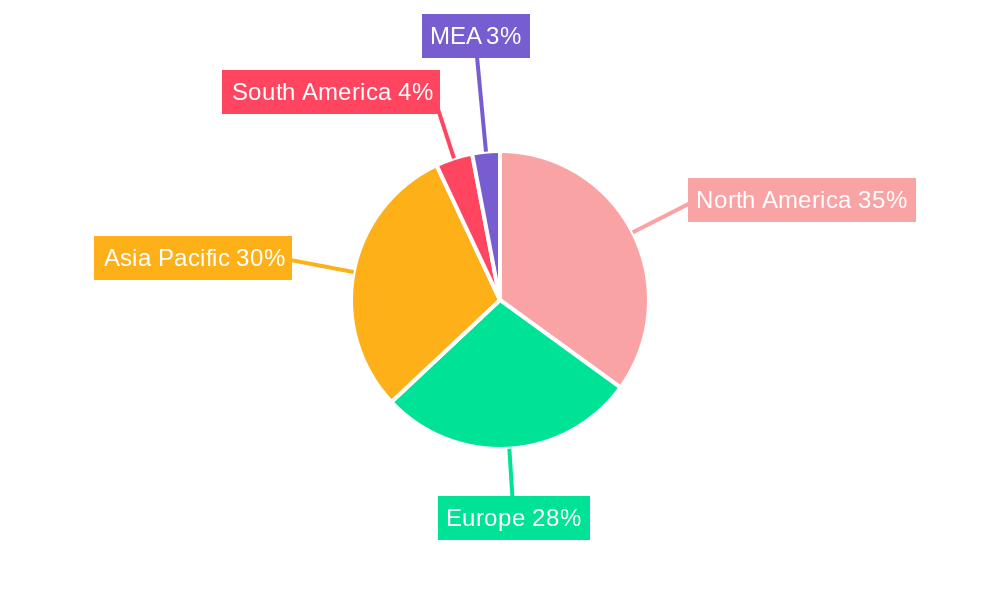
Dominant Regions, Countries, or Segments in Electronic Packaging Market
The Consumer Electronics segment dominates the market, accounting for approximately xx% of the total market share in 2025, driven by the high volume of electronic devices manufactured and sold globally. Within materials, plastic packaging holds the largest share, owing to its versatility, cost-effectiveness, and ease of manufacturing. The Asia-Pacific region exhibits the highest growth potential, propelled by rapid economic expansion, rising disposable incomes, and increasing adoption of electronic devices.
- Leading Segment: Consumer Electronics (xx million units in 2025)
- Leading Material: Plastic (xx million units in 2025)
- Fastest-Growing Region: Asia-Pacific (CAGR of xx% during the forecast period)
- Key Drivers: Increasing disposable incomes, rapid urbanization, and technological advancements.
Electronic Packaging Market Product Landscape
The electronic packaging market showcases a diverse range of products, including flexible films, rigid containers, and protective cushioning materials. Recent innovations focus on enhanced protection against physical damage and environmental factors, incorporating features such as improved barrier properties, anti-static protection, and tamper evidence. Sustainable packaging options made from recycled or renewable materials are gaining traction, driven by environmental concerns. Key performance metrics include material strength, barrier properties, weight, and cost-effectiveness. Unique selling propositions often revolve around enhanced product protection, improved sustainability, and streamlined packaging processes.
Key Drivers, Barriers & Challenges in Electronic Packaging Market
Key Drivers:
- Increasing demand for electronic devices across various sectors.
- Advancements in packaging materials and technologies.
- Growing focus on sustainability and eco-friendly packaging.
- Stringent regulatory requirements for product safety and environmental protection.
Key Barriers & Challenges:
- Fluctuations in raw material prices and supply chain disruptions.
- Stringent environmental regulations and compliance costs.
- Intense competition from existing and emerging players.
- High initial investment costs associated with advanced packaging technologies. This has resulted in a xx% reduction in market entry for new players in the past three years.
Emerging Opportunities in Electronic Packaging Market
- Growing demand for customized packaging solutions tailored to specific product requirements.
- Expanding applications in emerging sectors like medical devices and wearable technology.
- Increasing adoption of smart packaging incorporating sensors and tracking technology.
- Focus on designing eco-friendly, compostable, and recyclable packaging solutions.
Growth Accelerators in the Electronic Packaging Market Industry
The long-term growth of the electronic packaging market is propelled by several key factors. Technological breakthroughs in materials science and manufacturing processes lead to more efficient and sustainable packaging solutions. Strategic partnerships and collaborations between packaging companies and electronics manufacturers are driving innovation. Market expansion into new geographic regions and emerging markets represents a significant opportunity.
Key Players Shaping the Electronic Packaging Market Market
- WestRock Company
- Sonoco Products Company
- DuPont de Nemours Inc
- Dordan Manufacturing Company
- Dunapack Packaging Group
- Mondi Group
- Smurfit Kappa Group PLC
- UFP Technologies Inc
- GY Packaging
- Sealed Air Corporation
- SCHOTT AG
Notable Milestones in Electronic Packaging Market Sector
- September 2023: Sealed Air collaborated with Sparck Technologies, expanding its automated packaging solutions distribution.
- March 2024: Logitech International launched its Future Positive Challenge, focusing on sustainable packaging solutions for consumer electronics.
In-Depth Electronic Packaging Market Market Outlook
The Electronic Packaging Market is poised for continued growth, driven by ongoing technological advancements, increasing demand for sustainable packaging solutions, and expansion into new markets. Strategic partnerships and innovations in materials and manufacturing processes will further shape the market landscape. Opportunities exist for companies that can offer customized, sustainable, and technologically advanced packaging solutions to meet the diverse needs of the electronics industry.
Electronic Packaging Market Segmentation
-
1. Material
- 1.1. Plastic
- 1.2. Metal
- 1.3. Glass
-
2. End-user Industry
- 2.1. Consumer Electronics
- 2.2. Aerospace and Defense
- 2.3. Automotive
- 2.4. Healthcare
Electronic Packaging Market Segmentation By Geography
-
1. North America
- 1.1. United States
- 1.2. Canada
-
2. Europe
- 2.1. United Kingdom
- 2.2. Germany
- 2.3. France
- 2.4. Italy
- 2.5. Rest of Europe
-
3. Asia Pacific
- 3.1. China
- 3.2. India
- 3.3. Japan
- 3.4. Rest of Asia Pacific
-
4. Latin America
- 4.1. Brazil
- 4.2. Argentina
- 4.3. Rest of Latin America
-
5. Middle East and Africa
- 5.1. United Arab Emirates
- 5.2. Saudi Arabia
- 5.3. South Africa
- 5.4. Rest of Middle East and Africa
Electronic Packaging Market REPORT HIGHLIGHTS
| Aspects | Details |
|---|---|
| Study Period | 2019-2033 |
| Base Year | 2024 |
| Estimated Year | 2025 |
| Forecast Period | 2025-2033 |
| Historical Period | 2019-2024 |
| Growth Rate | CAGR of 23.12% from 2019-2033 |
| Segmentation |
|
Table of Contents
- 1. Introduction
- 1.1. Research Scope
- 1.2. Market Segmentation
- 1.3. Research Methodology
- 1.4. Definitions and Assumptions
- 2. Executive Summary
- 2.1. Introduction
- 3. Market Dynamics
- 3.1. Introduction
- 3.2. Market Drivers
- 3.2.1. Accelerated Sales of Electrical Automotives Across the Globe; Technological Advancements Drive the Product Quality
- 3.3. Market Restrains
- 3.3.1. High Costs for Electronic Packaging and Lack of Skilled Professionals to Challenge the Market Growth
- 3.4. Market Trends
- 3.4.1. The Aerospace and Defense Segment is Expected to Increasingly Adopt Electronic Packaging
- 4. Market Factor Analysis
- 4.1. Porters Five Forces
- 4.2. Supply/Value Chain
- 4.3. PESTEL analysis
- 4.4. Market Entropy
- 4.5. Patent/Trademark Analysis
- 5. Global Electronic Packaging Market Analysis, Insights and Forecast, 2019-2031
- 5.1. Market Analysis, Insights and Forecast - by Material
- 5.1.1. Plastic
- 5.1.2. Metal
- 5.1.3. Glass
- 5.2. Market Analysis, Insights and Forecast - by End-user Industry
- 5.2.1. Consumer Electronics
- 5.2.2. Aerospace and Defense
- 5.2.3. Automotive
- 5.2.4. Healthcare
- 5.3. Market Analysis, Insights and Forecast - by Region
- 5.3.1. North America
- 5.3.2. Europe
- 5.3.3. Asia Pacific
- 5.3.4. Latin America
- 5.3.5. Middle East and Africa
- 5.1. Market Analysis, Insights and Forecast - by Material
- 6. North America Electronic Packaging Market Analysis, Insights and Forecast, 2019-2031
- 6.1. Market Analysis, Insights and Forecast - by Material
- 6.1.1. Plastic
- 6.1.2. Metal
- 6.1.3. Glass
- 6.2. Market Analysis, Insights and Forecast - by End-user Industry
- 6.2.1. Consumer Electronics
- 6.2.2. Aerospace and Defense
- 6.2.3. Automotive
- 6.2.4. Healthcare
- 6.1. Market Analysis, Insights and Forecast - by Material
- 7. Europe Electronic Packaging Market Analysis, Insights and Forecast, 2019-2031
- 7.1. Market Analysis, Insights and Forecast - by Material
- 7.1.1. Plastic
- 7.1.2. Metal
- 7.1.3. Glass
- 7.2. Market Analysis, Insights and Forecast - by End-user Industry
- 7.2.1. Consumer Electronics
- 7.2.2. Aerospace and Defense
- 7.2.3. Automotive
- 7.2.4. Healthcare
- 7.1. Market Analysis, Insights and Forecast - by Material
- 8. Asia Pacific Electronic Packaging Market Analysis, Insights and Forecast, 2019-2031
- 8.1. Market Analysis, Insights and Forecast - by Material
- 8.1.1. Plastic
- 8.1.2. Metal
- 8.1.3. Glass
- 8.2. Market Analysis, Insights and Forecast - by End-user Industry
- 8.2.1. Consumer Electronics
- 8.2.2. Aerospace and Defense
- 8.2.3. Automotive
- 8.2.4. Healthcare
- 8.1. Market Analysis, Insights and Forecast - by Material
- 9. Latin America Electronic Packaging Market Analysis, Insights and Forecast, 2019-2031
- 9.1. Market Analysis, Insights and Forecast - by Material
- 9.1.1. Plastic
- 9.1.2. Metal
- 9.1.3. Glass
- 9.2. Market Analysis, Insights and Forecast - by End-user Industry
- 9.2.1. Consumer Electronics
- 9.2.2. Aerospace and Defense
- 9.2.3. Automotive
- 9.2.4. Healthcare
- 9.1. Market Analysis, Insights and Forecast - by Material
- 10. Middle East and Africa Electronic Packaging Market Analysis, Insights and Forecast, 2019-2031
- 10.1. Market Analysis, Insights and Forecast - by Material
- 10.1.1. Plastic
- 10.1.2. Metal
- 10.1.3. Glass
- 10.2. Market Analysis, Insights and Forecast - by End-user Industry
- 10.2.1. Consumer Electronics
- 10.2.2. Aerospace and Defense
- 10.2.3. Automotive
- 10.2.4. Healthcare
- 10.1. Market Analysis, Insights and Forecast - by Material
- 11. North America Electronic Packaging Market Analysis, Insights and Forecast, 2019-2031
- 11.1. Market Analysis, Insights and Forecast - By Country/Sub-region
- 11.1.1 United States
- 11.1.2 Canada
- 11.1.3 Mexico
- 12. Europe Electronic Packaging Market Analysis, Insights and Forecast, 2019-2031
- 12.1. Market Analysis, Insights and Forecast - By Country/Sub-region
- 12.1.1 Germany
- 12.1.2 United Kingdom
- 12.1.3 France
- 12.1.4 Spain
- 12.1.5 Italy
- 12.1.6 Spain
- 12.1.7 Belgium
- 12.1.8 Netherland
- 12.1.9 Nordics
- 12.1.10 Rest of Europe
- 13. Asia Pacific Electronic Packaging Market Analysis, Insights and Forecast, 2019-2031
- 13.1. Market Analysis, Insights and Forecast - By Country/Sub-region
- 13.1.1 China
- 13.1.2 Japan
- 13.1.3 India
- 13.1.4 South Korea
- 13.1.5 Southeast Asia
- 13.1.6 Australia
- 13.1.7 Indonesia
- 13.1.8 Phillipes
- 13.1.9 Singapore
- 13.1.10 Thailandc
- 13.1.11 Rest of Asia Pacific
- 14. South America Electronic Packaging Market Analysis, Insights and Forecast, 2019-2031
- 14.1. Market Analysis, Insights and Forecast - By Country/Sub-region
- 14.1.1 Brazil
- 14.1.2 Argentina
- 14.1.3 Peru
- 14.1.4 Chile
- 14.1.5 Colombia
- 14.1.6 Ecuador
- 14.1.7 Venezuela
- 14.1.8 Rest of South America
- 15. North America Electronic Packaging Market Analysis, Insights and Forecast, 2019-2031
- 15.1. Market Analysis, Insights and Forecast - By Country/Sub-region
- 15.1.1 United States
- 15.1.2 Canada
- 15.1.3 Mexico
- 16. MEA Electronic Packaging Market Analysis, Insights and Forecast, 2019-2031
- 16.1. Market Analysis, Insights and Forecast - By Country/Sub-region
- 16.1.1 United Arab Emirates
- 16.1.2 Saudi Arabia
- 16.1.3 South Africa
- 16.1.4 Rest of Middle East and Africa
- 17. Competitive Analysis
- 17.1. Global Market Share Analysis 2024
- 17.2. Company Profiles
- 17.2.1 WestRock Company
- 17.2.1.1. Overview
- 17.2.1.2. Products
- 17.2.1.3. SWOT Analysis
- 17.2.1.4. Recent Developments
- 17.2.1.5. Financials (Based on Availability)
- 17.2.2 Sonoco Products Company
- 17.2.2.1. Overview
- 17.2.2.2. Products
- 17.2.2.3. SWOT Analysis
- 17.2.2.4. Recent Developments
- 17.2.2.5. Financials (Based on Availability)
- 17.2.3 DuPont de Nemours Inc
- 17.2.3.1. Overview
- 17.2.3.2. Products
- 17.2.3.3. SWOT Analysis
- 17.2.3.4. Recent Developments
- 17.2.3.5. Financials (Based on Availability)
- 17.2.4 Dordan Manufacturing Compan
- 17.2.4.1. Overview
- 17.2.4.2. Products
- 17.2.4.3. SWOT Analysis
- 17.2.4.4. Recent Developments
- 17.2.4.5. Financials (Based on Availability)
- 17.2.5 Dunapack Packaging Group
- 17.2.5.1. Overview
- 17.2.5.2. Products
- 17.2.5.3. SWOT Analysis
- 17.2.5.4. Recent Developments
- 17.2.5.5. Financials (Based on Availability)
- 17.2.6 Mondi Group
- 17.2.6.1. Overview
- 17.2.6.2. Products
- 17.2.6.3. SWOT Analysis
- 17.2.6.4. Recent Developments
- 17.2.6.5. Financials (Based on Availability)
- 17.2.7 Smurfit Kappa Group PLC
- 17.2.7.1. Overview
- 17.2.7.2. Products
- 17.2.7.3. SWOT Analysis
- 17.2.7.4. Recent Developments
- 17.2.7.5. Financials (Based on Availability)
- 17.2.8 UFP Technologies Inc
- 17.2.8.1. Overview
- 17.2.8.2. Products
- 17.2.8.3. SWOT Analysis
- 17.2.8.4. Recent Developments
- 17.2.8.5. Financials (Based on Availability)
- 17.2.9 GY Packaging
- 17.2.9.1. Overview
- 17.2.9.2. Products
- 17.2.9.3. SWOT Analysis
- 17.2.9.4. Recent Developments
- 17.2.9.5. Financials (Based on Availability)
- 17.2.10 Sealed Air Corporation
- 17.2.10.1. Overview
- 17.2.10.2. Products
- 17.2.10.3. SWOT Analysis
- 17.2.10.4. Recent Developments
- 17.2.10.5. Financials (Based on Availability)
- 17.2.11 SCHOTT AG
- 17.2.11.1. Overview
- 17.2.11.2. Products
- 17.2.11.3. SWOT Analysis
- 17.2.11.4. Recent Developments
- 17.2.11.5. Financials (Based on Availability)
- 17.2.1 WestRock Company
List of Figures
- Figure 1: Global Electronic Packaging Market Revenue Breakdown (Million, %) by Region 2024 & 2032
- Figure 2: North America Electronic Packaging Market Revenue (Million), by Country 2024 & 2032
- Figure 3: North America Electronic Packaging Market Revenue Share (%), by Country 2024 & 2032
- Figure 4: Europe Electronic Packaging Market Revenue (Million), by Country 2024 & 2032
- Figure 5: Europe Electronic Packaging Market Revenue Share (%), by Country 2024 & 2032
- Figure 6: Asia Pacific Electronic Packaging Market Revenue (Million), by Country 2024 & 2032
- Figure 7: Asia Pacific Electronic Packaging Market Revenue Share (%), by Country 2024 & 2032
- Figure 8: South America Electronic Packaging Market Revenue (Million), by Country 2024 & 2032
- Figure 9: South America Electronic Packaging Market Revenue Share (%), by Country 2024 & 2032
- Figure 10: North America Electronic Packaging Market Revenue (Million), by Country 2024 & 2032
- Figure 11: North America Electronic Packaging Market Revenue Share (%), by Country 2024 & 2032
- Figure 12: MEA Electronic Packaging Market Revenue (Million), by Country 2024 & 2032
- Figure 13: MEA Electronic Packaging Market Revenue Share (%), by Country 2024 & 2032
- Figure 14: North America Electronic Packaging Market Revenue (Million), by Material 2024 & 2032
- Figure 15: North America Electronic Packaging Market Revenue Share (%), by Material 2024 & 2032
- Figure 16: North America Electronic Packaging Market Revenue (Million), by End-user Industry 2024 & 2032
- Figure 17: North America Electronic Packaging Market Revenue Share (%), by End-user Industry 2024 & 2032
- Figure 18: North America Electronic Packaging Market Revenue (Million), by Country 2024 & 2032
- Figure 19: North America Electronic Packaging Market Revenue Share (%), by Country 2024 & 2032
- Figure 20: Europe Electronic Packaging Market Revenue (Million), by Material 2024 & 2032
- Figure 21: Europe Electronic Packaging Market Revenue Share (%), by Material 2024 & 2032
- Figure 22: Europe Electronic Packaging Market Revenue (Million), by End-user Industry 2024 & 2032
- Figure 23: Europe Electronic Packaging Market Revenue Share (%), by End-user Industry 2024 & 2032
- Figure 24: Europe Electronic Packaging Market Revenue (Million), by Country 2024 & 2032
- Figure 25: Europe Electronic Packaging Market Revenue Share (%), by Country 2024 & 2032
- Figure 26: Asia Pacific Electronic Packaging Market Revenue (Million), by Material 2024 & 2032
- Figure 27: Asia Pacific Electronic Packaging Market Revenue Share (%), by Material 2024 & 2032
- Figure 28: Asia Pacific Electronic Packaging Market Revenue (Million), by End-user Industry 2024 & 2032
- Figure 29: Asia Pacific Electronic Packaging Market Revenue Share (%), by End-user Industry 2024 & 2032
- Figure 30: Asia Pacific Electronic Packaging Market Revenue (Million), by Country 2024 & 2032
- Figure 31: Asia Pacific Electronic Packaging Market Revenue Share (%), by Country 2024 & 2032
- Figure 32: Latin America Electronic Packaging Market Revenue (Million), by Material 2024 & 2032
- Figure 33: Latin America Electronic Packaging Market Revenue Share (%), by Material 2024 & 2032
- Figure 34: Latin America Electronic Packaging Market Revenue (Million), by End-user Industry 2024 & 2032
- Figure 35: Latin America Electronic Packaging Market Revenue Share (%), by End-user Industry 2024 & 2032
- Figure 36: Latin America Electronic Packaging Market Revenue (Million), by Country 2024 & 2032
- Figure 37: Latin America Electronic Packaging Market Revenue Share (%), by Country 2024 & 2032
- Figure 38: Middle East and Africa Electronic Packaging Market Revenue (Million), by Material 2024 & 2032
- Figure 39: Middle East and Africa Electronic Packaging Market Revenue Share (%), by Material 2024 & 2032
- Figure 40: Middle East and Africa Electronic Packaging Market Revenue (Million), by End-user Industry 2024 & 2032
- Figure 41: Middle East and Africa Electronic Packaging Market Revenue Share (%), by End-user Industry 2024 & 2032
- Figure 42: Middle East and Africa Electronic Packaging Market Revenue (Million), by Country 2024 & 2032
- Figure 43: Middle East and Africa Electronic Packaging Market Revenue Share (%), by Country 2024 & 2032
List of Tables
- Table 1: Global Electronic Packaging Market Revenue Million Forecast, by Region 2019 & 2032
- Table 2: Global Electronic Packaging Market Revenue Million Forecast, by Material 2019 & 2032
- Table 3: Global Electronic Packaging Market Revenue Million Forecast, by End-user Industry 2019 & 2032
- Table 4: Global Electronic Packaging Market Revenue Million Forecast, by Region 2019 & 2032
- Table 5: Global Electronic Packaging Market Revenue Million Forecast, by Country 2019 & 2032
- Table 6: United States Electronic Packaging Market Revenue (Million) Forecast, by Application 2019 & 2032
- Table 7: Canada Electronic Packaging Market Revenue (Million) Forecast, by Application 2019 & 2032
- Table 8: Mexico Electronic Packaging Market Revenue (Million) Forecast, by Application 2019 & 2032
- Table 9: Global Electronic Packaging Market Revenue Million Forecast, by Country 2019 & 2032
- Table 10: Germany Electronic Packaging Market Revenue (Million) Forecast, by Application 2019 & 2032
- Table 11: United Kingdom Electronic Packaging Market Revenue (Million) Forecast, by Application 2019 & 2032
- Table 12: France Electronic Packaging Market Revenue (Million) Forecast, by Application 2019 & 2032
- Table 13: Spain Electronic Packaging Market Revenue (Million) Forecast, by Application 2019 & 2032
- Table 14: Italy Electronic Packaging Market Revenue (Million) Forecast, by Application 2019 & 2032
- Table 15: Spain Electronic Packaging Market Revenue (Million) Forecast, by Application 2019 & 2032
- Table 16: Belgium Electronic Packaging Market Revenue (Million) Forecast, by Application 2019 & 2032
- Table 17: Netherland Electronic Packaging Market Revenue (Million) Forecast, by Application 2019 & 2032
- Table 18: Nordics Electronic Packaging Market Revenue (Million) Forecast, by Application 2019 & 2032
- Table 19: Rest of Europe Electronic Packaging Market Revenue (Million) Forecast, by Application 2019 & 2032
- Table 20: Global Electronic Packaging Market Revenue Million Forecast, by Country 2019 & 2032
- Table 21: China Electronic Packaging Market Revenue (Million) Forecast, by Application 2019 & 2032
- Table 22: Japan Electronic Packaging Market Revenue (Million) Forecast, by Application 2019 & 2032
- Table 23: India Electronic Packaging Market Revenue (Million) Forecast, by Application 2019 & 2032
- Table 24: South Korea Electronic Packaging Market Revenue (Million) Forecast, by Application 2019 & 2032
- Table 25: Southeast Asia Electronic Packaging Market Revenue (Million) Forecast, by Application 2019 & 2032
- Table 26: Australia Electronic Packaging Market Revenue (Million) Forecast, by Application 2019 & 2032
- Table 27: Indonesia Electronic Packaging Market Revenue (Million) Forecast, by Application 2019 & 2032
- Table 28: Phillipes Electronic Packaging Market Revenue (Million) Forecast, by Application 2019 & 2032
- Table 29: Singapore Electronic Packaging Market Revenue (Million) Forecast, by Application 2019 & 2032
- Table 30: Thailandc Electronic Packaging Market Revenue (Million) Forecast, by Application 2019 & 2032
- Table 31: Rest of Asia Pacific Electronic Packaging Market Revenue (Million) Forecast, by Application 2019 & 2032
- Table 32: Global Electronic Packaging Market Revenue Million Forecast, by Country 2019 & 2032
- Table 33: Brazil Electronic Packaging Market Revenue (Million) Forecast, by Application 2019 & 2032
- Table 34: Argentina Electronic Packaging Market Revenue (Million) Forecast, by Application 2019 & 2032
- Table 35: Peru Electronic Packaging Market Revenue (Million) Forecast, by Application 2019 & 2032
- Table 36: Chile Electronic Packaging Market Revenue (Million) Forecast, by Application 2019 & 2032
- Table 37: Colombia Electronic Packaging Market Revenue (Million) Forecast, by Application 2019 & 2032
- Table 38: Ecuador Electronic Packaging Market Revenue (Million) Forecast, by Application 2019 & 2032
- Table 39: Venezuela Electronic Packaging Market Revenue (Million) Forecast, by Application 2019 & 2032
- Table 40: Rest of South America Electronic Packaging Market Revenue (Million) Forecast, by Application 2019 & 2032
- Table 41: Global Electronic Packaging Market Revenue Million Forecast, by Country 2019 & 2032
- Table 42: United States Electronic Packaging Market Revenue (Million) Forecast, by Application 2019 & 2032
- Table 43: Canada Electronic Packaging Market Revenue (Million) Forecast, by Application 2019 & 2032
- Table 44: Mexico Electronic Packaging Market Revenue (Million) Forecast, by Application 2019 & 2032
- Table 45: Global Electronic Packaging Market Revenue Million Forecast, by Country 2019 & 2032
- Table 46: United Arab Emirates Electronic Packaging Market Revenue (Million) Forecast, by Application 2019 & 2032
- Table 47: Saudi Arabia Electronic Packaging Market Revenue (Million) Forecast, by Application 2019 & 2032
- Table 48: South Africa Electronic Packaging Market Revenue (Million) Forecast, by Application 2019 & 2032
- Table 49: Rest of Middle East and Africa Electronic Packaging Market Revenue (Million) Forecast, by Application 2019 & 2032
- Table 50: Global Electronic Packaging Market Revenue Million Forecast, by Material 2019 & 2032
- Table 51: Global Electronic Packaging Market Revenue Million Forecast, by End-user Industry 2019 & 2032
- Table 52: Global Electronic Packaging Market Revenue Million Forecast, by Country 2019 & 2032
- Table 53: United States Electronic Packaging Market Revenue (Million) Forecast, by Application 2019 & 2032
- Table 54: Canada Electronic Packaging Market Revenue (Million) Forecast, by Application 2019 & 2032
- Table 55: Global Electronic Packaging Market Revenue Million Forecast, by Material 2019 & 2032
- Table 56: Global Electronic Packaging Market Revenue Million Forecast, by End-user Industry 2019 & 2032
- Table 57: Global Electronic Packaging Market Revenue Million Forecast, by Country 2019 & 2032
- Table 58: United Kingdom Electronic Packaging Market Revenue (Million) Forecast, by Application 2019 & 2032
- Table 59: Germany Electronic Packaging Market Revenue (Million) Forecast, by Application 2019 & 2032
- Table 60: France Electronic Packaging Market Revenue (Million) Forecast, by Application 2019 & 2032
- Table 61: Italy Electronic Packaging Market Revenue (Million) Forecast, by Application 2019 & 2032
- Table 62: Rest of Europe Electronic Packaging Market Revenue (Million) Forecast, by Application 2019 & 2032
- Table 63: Global Electronic Packaging Market Revenue Million Forecast, by Material 2019 & 2032
- Table 64: Global Electronic Packaging Market Revenue Million Forecast, by End-user Industry 2019 & 2032
- Table 65: Global Electronic Packaging Market Revenue Million Forecast, by Country 2019 & 2032
- Table 66: China Electronic Packaging Market Revenue (Million) Forecast, by Application 2019 & 2032
- Table 67: India Electronic Packaging Market Revenue (Million) Forecast, by Application 2019 & 2032
- Table 68: Japan Electronic Packaging Market Revenue (Million) Forecast, by Application 2019 & 2032
- Table 69: Rest of Asia Pacific Electronic Packaging Market Revenue (Million) Forecast, by Application 2019 & 2032
- Table 70: Global Electronic Packaging Market Revenue Million Forecast, by Material 2019 & 2032
- Table 71: Global Electronic Packaging Market Revenue Million Forecast, by End-user Industry 2019 & 2032
- Table 72: Global Electronic Packaging Market Revenue Million Forecast, by Country 2019 & 2032
- Table 73: Brazil Electronic Packaging Market Revenue (Million) Forecast, by Application 2019 & 2032
- Table 74: Argentina Electronic Packaging Market Revenue (Million) Forecast, by Application 2019 & 2032
- Table 75: Rest of Latin America Electronic Packaging Market Revenue (Million) Forecast, by Application 2019 & 2032
- Table 76: Global Electronic Packaging Market Revenue Million Forecast, by Material 2019 & 2032
- Table 77: Global Electronic Packaging Market Revenue Million Forecast, by End-user Industry 2019 & 2032
- Table 78: Global Electronic Packaging Market Revenue Million Forecast, by Country 2019 & 2032
- Table 79: United Arab Emirates Electronic Packaging Market Revenue (Million) Forecast, by Application 2019 & 2032
- Table 80: Saudi Arabia Electronic Packaging Market Revenue (Million) Forecast, by Application 2019 & 2032
- Table 81: South Africa Electronic Packaging Market Revenue (Million) Forecast, by Application 2019 & 2032
- Table 82: Rest of Middle East and Africa Electronic Packaging Market Revenue (Million) Forecast, by Application 2019 & 2032
Frequently Asked Questions
1. What is the projected Compound Annual Growth Rate (CAGR) of the Electronic Packaging Market?
The projected CAGR is approximately 23.12%.
2. Which companies are prominent players in the Electronic Packaging Market?
Key companies in the market include WestRock Company, Sonoco Products Company, DuPont de Nemours Inc, Dordan Manufacturing Compan, Dunapack Packaging Group, Mondi Group, Smurfit Kappa Group PLC, UFP Technologies Inc, GY Packaging, Sealed Air Corporation, SCHOTT AG.
3. What are the main segments of the Electronic Packaging Market?
The market segments include Material, End-user Industry.
4. Can you provide details about the market size?
The market size is estimated to be USD 20.75 Million as of 2022.
5. What are some drivers contributing to market growth?
Accelerated Sales of Electrical Automotives Across the Globe; Technological Advancements Drive the Product Quality.
6. What are the notable trends driving market growth?
The Aerospace and Defense Segment is Expected to Increasingly Adopt Electronic Packaging.
7. Are there any restraints impacting market growth?
High Costs for Electronic Packaging and Lack of Skilled Professionals to Challenge the Market Growth.
8. Can you provide examples of recent developments in the market?
March 2024: Logitech International made an announcement regarding the acceptance of applications for the 2024 season of its second annual Future Positive Challenge. The challenge is intended to discover entrepreneurs, startups, and companies across the globe that can aid in advancing more sustainable products within the consumer electronics industry. The challenge is primarily focused on searching for solutions related to packaging that aim to safeguard products while minimizing environmental impact. Such solutions include moldable materials, renewable or recyclable materials, and alternatives to foil printing.
9. What pricing options are available for accessing the report?
Pricing options include single-user, multi-user, and enterprise licenses priced at USD 4750, USD 5250, and USD 8750 respectively.
10. Is the market size provided in terms of value or volume?
The market size is provided in terms of value, measured in Million.
11. Are there any specific market keywords associated with the report?
Yes, the market keyword associated with the report is "Electronic Packaging Market," which aids in identifying and referencing the specific market segment covered.
12. How do I determine which pricing option suits my needs best?
The pricing options vary based on user requirements and access needs. Individual users may opt for single-user licenses, while businesses requiring broader access may choose multi-user or enterprise licenses for cost-effective access to the report.
13. Are there any additional resources or data provided in the Electronic Packaging Market report?
While the report offers comprehensive insights, it's advisable to review the specific contents or supplementary materials provided to ascertain if additional resources or data are available.
14. How can I stay updated on further developments or reports in the Electronic Packaging Market?
To stay informed about further developments, trends, and reports in the Electronic Packaging Market, consider subscribing to industry newsletters, following relevant companies and organizations, or regularly checking reputable industry news sources and publications.
Methodology
Step 1 - Identification of Relevant Samples Size from Population Database


Step 2 - Approaches for Defining Global Market Size (Value, Volume* & Price*)

Note*: In applicable scenarios
Step 3 - Data Sources
Primary Research
- Web Analytics
- Survey Reports
- Research Institute
- Latest Research Reports
- Opinion Leaders
Secondary Research
- Annual Reports
- White Paper
- Latest Press Release
- Industry Association
- Paid Database
- Investor Presentations

Step 4 - Data Triangulation
Involves using different sources of information in order to increase the validity of a study
These sources are likely to be stakeholders in a program - participants, other researchers, program staff, other community members, and so on.
Then we put all data in single framework & apply various statistical tools to find out the dynamic on the market.
During the analysis stage, feedback from the stakeholder groups would be compared to determine areas of agreement as well as areas of divergence


