
Key Insights
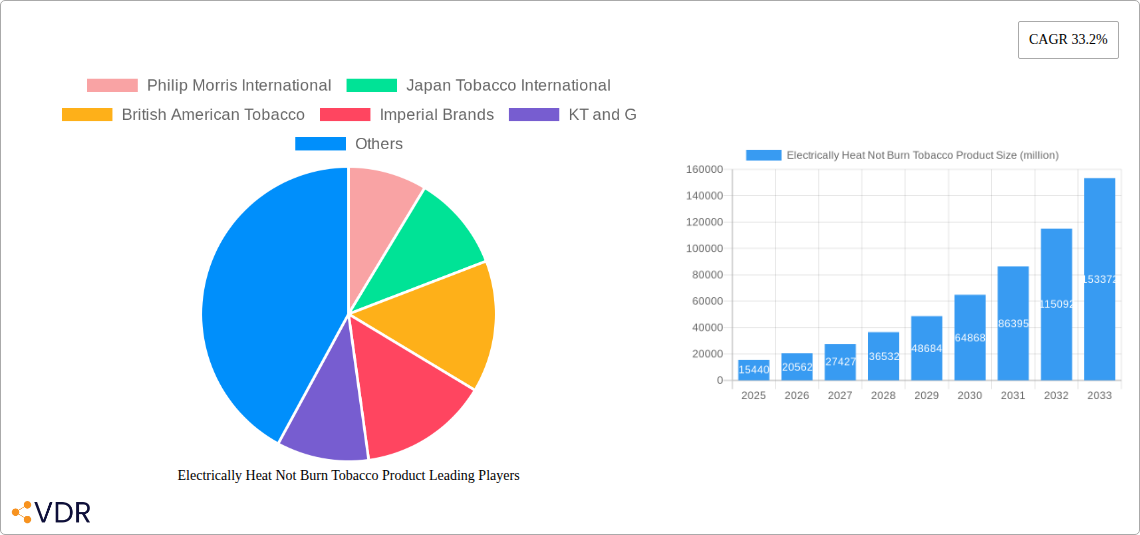
The Electrically Heated Not Burn (HNB) Tobacco Product market exhibits robust growth, projected to reach $15.44 billion in 2025 and maintain a significant Compound Annual Growth Rate (CAGR) of 33.2% from 2025 to 2033. This expansion is driven by several key factors. Firstly, increasing consumer awareness of the potential reduced health risks compared to traditional cigarettes fuels adoption among smokers seeking harm reduction alternatives. Secondly, the continuous innovation in HNB device technology, encompassing improved battery life, flavor profiles, and user experience, enhances market appeal. Furthermore, aggressive marketing strategies by major players like Philip Morris International, Japan Tobacco International, and British American Tobacco, contribute significantly to market penetration, particularly in regions with established tobacco consumption. Finally, the growing regulatory acceptance of HNB products in certain markets, offering a regulated alternative to illicit vaping products, presents an important opportunity for growth.
Despite this positive trajectory, certain challenges remain. The regulatory landscape varies across different geographies, creating uncertainty for manufacturers. Consumer perception regarding long-term health impacts remains a concern, requiring further scientific research and transparent communication. Furthermore, competition from the e-cigarette market and the evolving preferences of younger generations present ongoing challenges. However, the ongoing technological advancements within the HNB sector, coupled with a growing acceptance of its potential as a harm reduction strategy, strongly suggest a continued upward trajectory for this market, with significant potential for future expansion, particularly in emerging economies with large tobacco-consuming populations.
Electrically Heat Not Burn Tobacco Product Market Report: 2019-2033
This comprehensive report provides a detailed analysis of the Electrically Heated Not Burn (HNB) Tobacco Product market, encompassing market dynamics, growth trends, regional dominance, product landscape, key players, and future outlook. The study covers the period 2019-2033, with a focus on the base year 2025 and a forecast period of 2025-2033. The report is essential for industry professionals, investors, and strategic decision-makers seeking insights into this rapidly evolving sector. The parent market is the Tobacco Industry, with the child market being Reduced-Risk Tobacco Products.
Electrically Heat Not Burn Tobacco Product Market Dynamics & Structure
The Electrically Heat Not Burn (HNB) tobacco product market is characterized by intense competition among established players and emerging innovators. Market concentration is relatively high, with a few multinational corporations holding significant market share. Technological innovation is a key driver, with continuous advancements in heating element technology, aerosol delivery systems, and flavor profiles. Regulatory frameworks vary significantly across regions, impacting market access and product development. Competitive substitutes, including vaping products and traditional cigarettes, continue to present challenges. End-user demographics are shifting towards a more health-conscious consumer base seeking alternatives to traditional cigarettes. The market has witnessed several mergers and acquisitions (M&A) in recent years, reflecting consolidation trends. Our analysis estimates xx million units in M&A deals during the historical period (2019-2024).
- Market Concentration: High, with top 5 players holding xx% market share in 2025.
- Technological Innovation: Focus on improved flavor delivery, reduced harmful emissions, and enhanced user experience.
- Regulatory Frameworks: Vary significantly across countries, creating complexities for market entry and expansion.
- Competitive Substitutes: E-cigarettes and traditional cigarettes pose significant competition.
- End-User Demographics: Increasing adoption among health-conscious smokers seeking reduced-risk alternatives.
- M&A Trends: Significant consolidation activity observed, with xx million units of deals predicted for the forecast period (2025-2033).
Electrically Heat Not Burn Tobacco Product Growth Trends & Insights
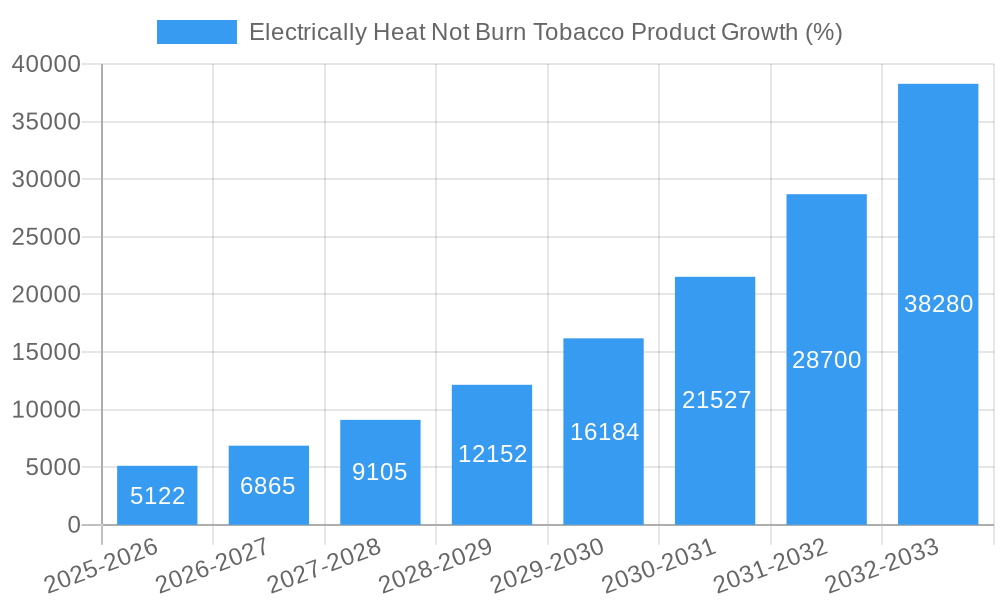
The global HNB tobacco product market experienced significant growth during the historical period (2019-2024). This growth is primarily attributed to rising consumer awareness of the potential health benefits compared to traditional cigarettes, coupled with technological advancements enhancing user experience. Adoption rates have increased steadily, particularly in Asia and Europe. Technological disruptions, such as the introduction of innovative heating technologies and improved aerosol delivery systems, have further fueled market expansion. Changing consumer behavior, including a preference for less harmful alternatives, has also contributed to market growth. We project a CAGR of xx% from 2025 to 2033, with market penetration reaching xx% by 2033. Market size is expected to reach xx million units by 2033.
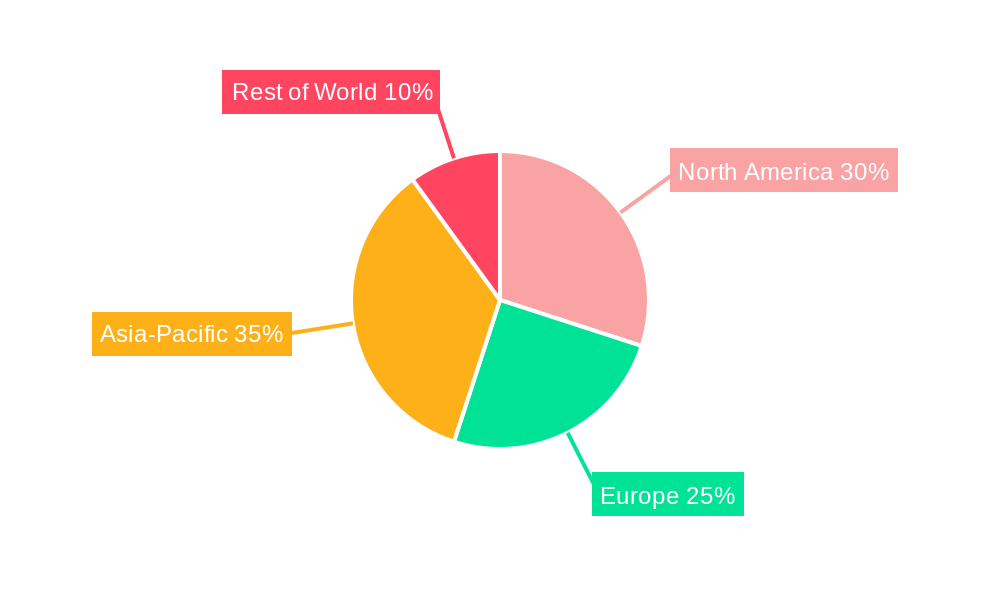
Dominant Regions, Countries, or Segments in Electrically Heat Not Burn Tobacco Product
Asia is projected to be the dominant region for HNB tobacco products, driven by high cigarette consumption rates and increasing consumer adoption of reduced-risk alternatives. Within Asia, Japan and South Korea are expected to remain key markets. Europe also shows significant growth potential, with favorable regulatory environments and a sizeable consumer base. The growth in these regions is driven by several factors:
- Economic policies: supportive regulatory frameworks for HNB products in some regions.
- Infrastructure: robust distribution networks and strong retail presence facilitating market access.
- Consumer preferences: increasing demand for reduced-risk tobacco products.
Japan and South Korea currently hold the largest market shares in the region, demonstrating strong consumer acceptance and well-established distribution channels. However, other countries in Asia and Europe are showing rapid growth, indicating significant future market potential.
Electrically Heat Not Burn Tobacco Product Product Landscape
The HNB tobacco product landscape features a diverse range of devices, each with unique heating mechanisms and design features. Innovations focus on improving flavor delivery, reducing harmful emissions, and enhancing the overall user experience. Manufacturers are constantly striving to differentiate their products through features such as customizable temperature settings, improved battery life, and enhanced aesthetic designs. Key performance metrics include the consistency of heating, aerosol production, and the overall sensory experience. The introduction of new tobacco sticks and improved heating technologies are continuous developments in this area.
Key Drivers, Barriers & Challenges in Electrically Heat Not Burn Tobacco Product
Key Drivers:
- Technological advancements in heating technology and aerosol delivery.
- Growing consumer demand for reduced-risk tobacco alternatives.
- Favorable regulatory environments in certain regions.
Challenges and Restraints:
- Stringent regulations and evolving regulatory landscapes in different regions are creating barriers to market entry.
- Intense competition from established tobacco companies and emerging players is creating pricing pressures.
- Concerns regarding long-term health effects and the potential for addiction remain a major challenge. This affects the market acceptance by an estimated xx million units.
Emerging Opportunities in Electrically Heat Not Burn Tobacco Product
- Expansion into new markets with high cigarette consumption rates, particularly in developing economies.
- Development of innovative product features and functionalities to meet evolving consumer preferences.
- Strategic partnerships and collaborations to broaden market reach and enhance brand visibility.
Growth Accelerators in the Electrically Heat Not Burn Tobacco Product Industry
Technological breakthroughs in heating element technology, battery life, and flavor delivery systems will significantly impact the market. Strategic partnerships between tobacco companies and technology firms, focusing on R&D and distribution, will further accelerate growth. Expanding into new markets and educating consumers about the benefits of HNB products compared to traditional cigarettes will also be vital.
Key Players Shaping the Electrically Heat Not Burn Tobacco Product Market
- Philip Morris International
- Japan Tobacco International
- British American Tobacco
- Imperial Brands
- KT and G
- Pax Labs
- Shenzhen Royal Tobacco Industrial
- Buddy Technology Development
- Shanghai Shunho New Materials
- First Union
- Mysmok Electronic Technology
Notable Milestones in Electrically Heat Not Burn Tobacco Product Sector
- 2016: Philip Morris International launches IQOS globally.
- 2017: Japan Tobacco International launches Ploom Tech in Japan.
- 2018: British American Tobacco launches glo in several markets.
- 2019: Increased regulatory scrutiny in various countries.
- 2020-2024: Continued product innovation and expansion into new markets. Further M&A activity with an estimated value of xx million units.
In-Depth Electrically Heat Not Burn Tobacco Product Market Outlook
The HNB tobacco product market is poised for significant growth over the next decade, driven by technological innovation, evolving consumer preferences, and strategic market expansion by key players. The focus on reduced-risk products, coupled with continuous improvements in product design and functionality, will create new opportunities for growth and market penetration. Companies that invest in R&D, strategic partnerships, and targeted marketing campaigns will be best positioned to capitalize on the future potential of this market.
Electrically Heat Not Burn Tobacco Product Segmentation
-
1. Application
- 1.1. Online
- 1.2. Offline
-
2. Types
- 2.1. Resistive Heating
- 2.2. Induction Heating
Electrically Heat Not Burn Tobacco Product Segmentation By Geography
-
1. North America
- 1.1. United States
- 1.2. Canada
- 1.3. Mexico
-
2. South America
- 2.1. Brazil
- 2.2. Argentina
- 2.3. Rest of South America
-
3. Europe
- 3.1. United Kingdom
- 3.2. Germany
- 3.3. France
- 3.4. Italy
- 3.5. Spain
- 3.6. Russia
- 3.7. Benelux
- 3.8. Nordics
- 3.9. Rest of Europe
-
4. Middle East & Africa
- 4.1. Turkey
- 4.2. Israel
- 4.3. GCC
- 4.4. North Africa
- 4.5. South Africa
- 4.6. Rest of Middle East & Africa
-
5. Asia Pacific
- 5.1. China
- 5.2. India
- 5.3. Japan
- 5.4. South Korea
- 5.5. ASEAN
- 5.6. Oceania
- 5.7. Rest of Asia Pacific
Electrically Heat Not Burn Tobacco Product REPORT HIGHLIGHTS
| Aspects | Details |
|---|---|
| Study Period | 2019-2033 |
| Base Year | 2024 |
| Estimated Year | 2025 |
| Forecast Period | 2025-2033 |
| Historical Period | 2019-2024 |
| Growth Rate | CAGR of 33.2% from 2019-2033 |
| Segmentation |
|
Table of Contents
- 1. Introduction
- 1.1. Research Scope
- 1.2. Market Segmentation
- 1.3. Research Methodology
- 1.4. Definitions and Assumptions
- 2. Executive Summary
- 2.1. Introduction
- 3. Market Dynamics
- 3.1. Introduction
- 3.2. Market Drivers
- 3.3. Market Restrains
- 3.4. Market Trends
- 4. Market Factor Analysis
- 4.1. Porters Five Forces
- 4.2. Supply/Value Chain
- 4.3. PESTEL analysis
- 4.4. Market Entropy
- 4.5. Patent/Trademark Analysis
- 5. Global Electrically Heat Not Burn Tobacco Product Analysis, Insights and Forecast, 2019-2031
- 5.1. Market Analysis, Insights and Forecast - by Application
- 5.1.1. Online
- 5.1.2. Offline
- 5.2. Market Analysis, Insights and Forecast - by Types
- 5.2.1. Resistive Heating
- 5.2.2. Induction Heating
- 5.3. Market Analysis, Insights and Forecast - by Region
- 5.3.1. North America
- 5.3.2. South America
- 5.3.3. Europe
- 5.3.4. Middle East & Africa
- 5.3.5. Asia Pacific
- 5.1. Market Analysis, Insights and Forecast - by Application
- 6. North America Electrically Heat Not Burn Tobacco Product Analysis, Insights and Forecast, 2019-2031
- 6.1. Market Analysis, Insights and Forecast - by Application
- 6.1.1. Online
- 6.1.2. Offline
- 6.2. Market Analysis, Insights and Forecast - by Types
- 6.2.1. Resistive Heating
- 6.2.2. Induction Heating
- 6.1. Market Analysis, Insights and Forecast - by Application
- 7. South America Electrically Heat Not Burn Tobacco Product Analysis, Insights and Forecast, 2019-2031
- 7.1. Market Analysis, Insights and Forecast - by Application
- 7.1.1. Online
- 7.1.2. Offline
- 7.2. Market Analysis, Insights and Forecast - by Types
- 7.2.1. Resistive Heating
- 7.2.2. Induction Heating
- 7.1. Market Analysis, Insights and Forecast - by Application
- 8. Europe Electrically Heat Not Burn Tobacco Product Analysis, Insights and Forecast, 2019-2031
- 8.1. Market Analysis, Insights and Forecast - by Application
- 8.1.1. Online
- 8.1.2. Offline
- 8.2. Market Analysis, Insights and Forecast - by Types
- 8.2.1. Resistive Heating
- 8.2.2. Induction Heating
- 8.1. Market Analysis, Insights and Forecast - by Application
- 9. Middle East & Africa Electrically Heat Not Burn Tobacco Product Analysis, Insights and Forecast, 2019-2031
- 9.1. Market Analysis, Insights and Forecast - by Application
- 9.1.1. Online
- 9.1.2. Offline
- 9.2. Market Analysis, Insights and Forecast - by Types
- 9.2.1. Resistive Heating
- 9.2.2. Induction Heating
- 9.1. Market Analysis, Insights and Forecast - by Application
- 10. Asia Pacific Electrically Heat Not Burn Tobacco Product Analysis, Insights and Forecast, 2019-2031
- 10.1. Market Analysis, Insights and Forecast - by Application
- 10.1.1. Online
- 10.1.2. Offline
- 10.2. Market Analysis, Insights and Forecast - by Types
- 10.2.1. Resistive Heating
- 10.2.2. Induction Heating
- 10.1. Market Analysis, Insights and Forecast - by Application
- 11. Competitive Analysis
- 11.1. Global Market Share Analysis 2024
- 11.2. Company Profiles
- 11.2.1 Philip Morris International
- 11.2.1.1. Overview
- 11.2.1.2. Products
- 11.2.1.3. SWOT Analysis
- 11.2.1.4. Recent Developments
- 11.2.1.5. Financials (Based on Availability)
- 11.2.2 Japan Tobacco International
- 11.2.2.1. Overview
- 11.2.2.2. Products
- 11.2.2.3. SWOT Analysis
- 11.2.2.4. Recent Developments
- 11.2.2.5. Financials (Based on Availability)
- 11.2.3 British American Tobacco
- 11.2.3.1. Overview
- 11.2.3.2. Products
- 11.2.3.3. SWOT Analysis
- 11.2.3.4. Recent Developments
- 11.2.3.5. Financials (Based on Availability)
- 11.2.4 Imperial Brands
- 11.2.4.1. Overview
- 11.2.4.2. Products
- 11.2.4.3. SWOT Analysis
- 11.2.4.4. Recent Developments
- 11.2.4.5. Financials (Based on Availability)
- 11.2.5 KT and G
- 11.2.5.1. Overview
- 11.2.5.2. Products
- 11.2.5.3. SWOT Analysis
- 11.2.5.4. Recent Developments
- 11.2.5.5. Financials (Based on Availability)
- 11.2.6 Pax Labs
- 11.2.6.1. Overview
- 11.2.6.2. Products
- 11.2.6.3. SWOT Analysis
- 11.2.6.4. Recent Developments
- 11.2.6.5. Financials (Based on Availability)
- 11.2.7 Shenzhen Royal Tobacco Industrial
- 11.2.7.1. Overview
- 11.2.7.2. Products
- 11.2.7.3. SWOT Analysis
- 11.2.7.4. Recent Developments
- 11.2.7.5. Financials (Based on Availability)
- 11.2.8 Buddy Technology Development
- 11.2.8.1. Overview
- 11.2.8.2. Products
- 11.2.8.3. SWOT Analysis
- 11.2.8.4. Recent Developments
- 11.2.8.5. Financials (Based on Availability)
- 11.2.9 Shanghai Shunho New Materials
- 11.2.9.1. Overview
- 11.2.9.2. Products
- 11.2.9.3. SWOT Analysis
- 11.2.9.4. Recent Developments
- 11.2.9.5. Financials (Based on Availability)
- 11.2.10 First Union
- 11.2.10.1. Overview
- 11.2.10.2. Products
- 11.2.10.3. SWOT Analysis
- 11.2.10.4. Recent Developments
- 11.2.10.5. Financials (Based on Availability)
- 11.2.11 Mysmok Electronic Technology
- 11.2.11.1. Overview
- 11.2.11.2. Products
- 11.2.11.3. SWOT Analysis
- 11.2.11.4. Recent Developments
- 11.2.11.5. Financials (Based on Availability)
- 11.2.1 Philip Morris International
List of Figures
- Figure 1: Global Electrically Heat Not Burn Tobacco Product Revenue Breakdown (million, %) by Region 2024 & 2032
- Figure 2: Global Electrically Heat Not Burn Tobacco Product Volume Breakdown (K, %) by Region 2024 & 2032
- Figure 3: North America Electrically Heat Not Burn Tobacco Product Revenue (million), by Application 2024 & 2032
- Figure 4: North America Electrically Heat Not Burn Tobacco Product Volume (K), by Application 2024 & 2032
- Figure 5: North America Electrically Heat Not Burn Tobacco Product Revenue Share (%), by Application 2024 & 2032
- Figure 6: North America Electrically Heat Not Burn Tobacco Product Volume Share (%), by Application 2024 & 2032
- Figure 7: North America Electrically Heat Not Burn Tobacco Product Revenue (million), by Types 2024 & 2032
- Figure 8: North America Electrically Heat Not Burn Tobacco Product Volume (K), by Types 2024 & 2032
- Figure 9: North America Electrically Heat Not Burn Tobacco Product Revenue Share (%), by Types 2024 & 2032
- Figure 10: North America Electrically Heat Not Burn Tobacco Product Volume Share (%), by Types 2024 & 2032
- Figure 11: North America Electrically Heat Not Burn Tobacco Product Revenue (million), by Country 2024 & 2032
- Figure 12: North America Electrically Heat Not Burn Tobacco Product Volume (K), by Country 2024 & 2032
- Figure 13: North America Electrically Heat Not Burn Tobacco Product Revenue Share (%), by Country 2024 & 2032
- Figure 14: North America Electrically Heat Not Burn Tobacco Product Volume Share (%), by Country 2024 & 2032
- Figure 15: South America Electrically Heat Not Burn Tobacco Product Revenue (million), by Application 2024 & 2032
- Figure 16: South America Electrically Heat Not Burn Tobacco Product Volume (K), by Application 2024 & 2032
- Figure 17: South America Electrically Heat Not Burn Tobacco Product Revenue Share (%), by Application 2024 & 2032
- Figure 18: South America Electrically Heat Not Burn Tobacco Product Volume Share (%), by Application 2024 & 2032
- Figure 19: South America Electrically Heat Not Burn Tobacco Product Revenue (million), by Types 2024 & 2032
- Figure 20: South America Electrically Heat Not Burn Tobacco Product Volume (K), by Types 2024 & 2032
- Figure 21: South America Electrically Heat Not Burn Tobacco Product Revenue Share (%), by Types 2024 & 2032
- Figure 22: South America Electrically Heat Not Burn Tobacco Product Volume Share (%), by Types 2024 & 2032
- Figure 23: South America Electrically Heat Not Burn Tobacco Product Revenue (million), by Country 2024 & 2032
- Figure 24: South America Electrically Heat Not Burn Tobacco Product Volume (K), by Country 2024 & 2032
- Figure 25: South America Electrically Heat Not Burn Tobacco Product Revenue Share (%), by Country 2024 & 2032
- Figure 26: South America Electrically Heat Not Burn Tobacco Product Volume Share (%), by Country 2024 & 2032
- Figure 27: Europe Electrically Heat Not Burn Tobacco Product Revenue (million), by Application 2024 & 2032
- Figure 28: Europe Electrically Heat Not Burn Tobacco Product Volume (K), by Application 2024 & 2032
- Figure 29: Europe Electrically Heat Not Burn Tobacco Product Revenue Share (%), by Application 2024 & 2032
- Figure 30: Europe Electrically Heat Not Burn Tobacco Product Volume Share (%), by Application 2024 & 2032
- Figure 31: Europe Electrically Heat Not Burn Tobacco Product Revenue (million), by Types 2024 & 2032
- Figure 32: Europe Electrically Heat Not Burn Tobacco Product Volume (K), by Types 2024 & 2032
- Figure 33: Europe Electrically Heat Not Burn Tobacco Product Revenue Share (%), by Types 2024 & 2032
- Figure 34: Europe Electrically Heat Not Burn Tobacco Product Volume Share (%), by Types 2024 & 2032
- Figure 35: Europe Electrically Heat Not Burn Tobacco Product Revenue (million), by Country 2024 & 2032
- Figure 36: Europe Electrically Heat Not Burn Tobacco Product Volume (K), by Country 2024 & 2032
- Figure 37: Europe Electrically Heat Not Burn Tobacco Product Revenue Share (%), by Country 2024 & 2032
- Figure 38: Europe Electrically Heat Not Burn Tobacco Product Volume Share (%), by Country 2024 & 2032
- Figure 39: Middle East & Africa Electrically Heat Not Burn Tobacco Product Revenue (million), by Application 2024 & 2032
- Figure 40: Middle East & Africa Electrically Heat Not Burn Tobacco Product Volume (K), by Application 2024 & 2032
- Figure 41: Middle East & Africa Electrically Heat Not Burn Tobacco Product Revenue Share (%), by Application 2024 & 2032
- Figure 42: Middle East & Africa Electrically Heat Not Burn Tobacco Product Volume Share (%), by Application 2024 & 2032
- Figure 43: Middle East & Africa Electrically Heat Not Burn Tobacco Product Revenue (million), by Types 2024 & 2032
- Figure 44: Middle East & Africa Electrically Heat Not Burn Tobacco Product Volume (K), by Types 2024 & 2032
- Figure 45: Middle East & Africa Electrically Heat Not Burn Tobacco Product Revenue Share (%), by Types 2024 & 2032
- Figure 46: Middle East & Africa Electrically Heat Not Burn Tobacco Product Volume Share (%), by Types 2024 & 2032
- Figure 47: Middle East & Africa Electrically Heat Not Burn Tobacco Product Revenue (million), by Country 2024 & 2032
- Figure 48: Middle East & Africa Electrically Heat Not Burn Tobacco Product Volume (K), by Country 2024 & 2032
- Figure 49: Middle East & Africa Electrically Heat Not Burn Tobacco Product Revenue Share (%), by Country 2024 & 2032
- Figure 50: Middle East & Africa Electrically Heat Not Burn Tobacco Product Volume Share (%), by Country 2024 & 2032
- Figure 51: Asia Pacific Electrically Heat Not Burn Tobacco Product Revenue (million), by Application 2024 & 2032
- Figure 52: Asia Pacific Electrically Heat Not Burn Tobacco Product Volume (K), by Application 2024 & 2032
- Figure 53: Asia Pacific Electrically Heat Not Burn Tobacco Product Revenue Share (%), by Application 2024 & 2032
- Figure 54: Asia Pacific Electrically Heat Not Burn Tobacco Product Volume Share (%), by Application 2024 & 2032
- Figure 55: Asia Pacific Electrically Heat Not Burn Tobacco Product Revenue (million), by Types 2024 & 2032
- Figure 56: Asia Pacific Electrically Heat Not Burn Tobacco Product Volume (K), by Types 2024 & 2032
- Figure 57: Asia Pacific Electrically Heat Not Burn Tobacco Product Revenue Share (%), by Types 2024 & 2032
- Figure 58: Asia Pacific Electrically Heat Not Burn Tobacco Product Volume Share (%), by Types 2024 & 2032
- Figure 59: Asia Pacific Electrically Heat Not Burn Tobacco Product Revenue (million), by Country 2024 & 2032
- Figure 60: Asia Pacific Electrically Heat Not Burn Tobacco Product Volume (K), by Country 2024 & 2032
- Figure 61: Asia Pacific Electrically Heat Not Burn Tobacco Product Revenue Share (%), by Country 2024 & 2032
- Figure 62: Asia Pacific Electrically Heat Not Burn Tobacco Product Volume Share (%), by Country 2024 & 2032
List of Tables
- Table 1: Global Electrically Heat Not Burn Tobacco Product Revenue million Forecast, by Region 2019 & 2032
- Table 2: Global Electrically Heat Not Burn Tobacco Product Volume K Forecast, by Region 2019 & 2032
- Table 3: Global Electrically Heat Not Burn Tobacco Product Revenue million Forecast, by Application 2019 & 2032
- Table 4: Global Electrically Heat Not Burn Tobacco Product Volume K Forecast, by Application 2019 & 2032
- Table 5: Global Electrically Heat Not Burn Tobacco Product Revenue million Forecast, by Types 2019 & 2032
- Table 6: Global Electrically Heat Not Burn Tobacco Product Volume K Forecast, by Types 2019 & 2032
- Table 7: Global Electrically Heat Not Burn Tobacco Product Revenue million Forecast, by Region 2019 & 2032
- Table 8: Global Electrically Heat Not Burn Tobacco Product Volume K Forecast, by Region 2019 & 2032
- Table 9: Global Electrically Heat Not Burn Tobacco Product Revenue million Forecast, by Application 2019 & 2032
- Table 10: Global Electrically Heat Not Burn Tobacco Product Volume K Forecast, by Application 2019 & 2032
- Table 11: Global Electrically Heat Not Burn Tobacco Product Revenue million Forecast, by Types 2019 & 2032
- Table 12: Global Electrically Heat Not Burn Tobacco Product Volume K Forecast, by Types 2019 & 2032
- Table 13: Global Electrically Heat Not Burn Tobacco Product Revenue million Forecast, by Country 2019 & 2032
- Table 14: Global Electrically Heat Not Burn Tobacco Product Volume K Forecast, by Country 2019 & 2032
- Table 15: United States Electrically Heat Not Burn Tobacco Product Revenue (million) Forecast, by Application 2019 & 2032
- Table 16: United States Electrically Heat Not Burn Tobacco Product Volume (K) Forecast, by Application 2019 & 2032
- Table 17: Canada Electrically Heat Not Burn Tobacco Product Revenue (million) Forecast, by Application 2019 & 2032
- Table 18: Canada Electrically Heat Not Burn Tobacco Product Volume (K) Forecast, by Application 2019 & 2032
- Table 19: Mexico Electrically Heat Not Burn Tobacco Product Revenue (million) Forecast, by Application 2019 & 2032
- Table 20: Mexico Electrically Heat Not Burn Tobacco Product Volume (K) Forecast, by Application 2019 & 2032
- Table 21: Global Electrically Heat Not Burn Tobacco Product Revenue million Forecast, by Application 2019 & 2032
- Table 22: Global Electrically Heat Not Burn Tobacco Product Volume K Forecast, by Application 2019 & 2032
- Table 23: Global Electrically Heat Not Burn Tobacco Product Revenue million Forecast, by Types 2019 & 2032
- Table 24: Global Electrically Heat Not Burn Tobacco Product Volume K Forecast, by Types 2019 & 2032
- Table 25: Global Electrically Heat Not Burn Tobacco Product Revenue million Forecast, by Country 2019 & 2032
- Table 26: Global Electrically Heat Not Burn Tobacco Product Volume K Forecast, by Country 2019 & 2032
- Table 27: Brazil Electrically Heat Not Burn Tobacco Product Revenue (million) Forecast, by Application 2019 & 2032
- Table 28: Brazil Electrically Heat Not Burn Tobacco Product Volume (K) Forecast, by Application 2019 & 2032
- Table 29: Argentina Electrically Heat Not Burn Tobacco Product Revenue (million) Forecast, by Application 2019 & 2032
- Table 30: Argentina Electrically Heat Not Burn Tobacco Product Volume (K) Forecast, by Application 2019 & 2032
- Table 31: Rest of South America Electrically Heat Not Burn Tobacco Product Revenue (million) Forecast, by Application 2019 & 2032
- Table 32: Rest of South America Electrically Heat Not Burn Tobacco Product Volume (K) Forecast, by Application 2019 & 2032
- Table 33: Global Electrically Heat Not Burn Tobacco Product Revenue million Forecast, by Application 2019 & 2032
- Table 34: Global Electrically Heat Not Burn Tobacco Product Volume K Forecast, by Application 2019 & 2032
- Table 35: Global Electrically Heat Not Burn Tobacco Product Revenue million Forecast, by Types 2019 & 2032
- Table 36: Global Electrically Heat Not Burn Tobacco Product Volume K Forecast, by Types 2019 & 2032
- Table 37: Global Electrically Heat Not Burn Tobacco Product Revenue million Forecast, by Country 2019 & 2032
- Table 38: Global Electrically Heat Not Burn Tobacco Product Volume K Forecast, by Country 2019 & 2032
- Table 39: United Kingdom Electrically Heat Not Burn Tobacco Product Revenue (million) Forecast, by Application 2019 & 2032
- Table 40: United Kingdom Electrically Heat Not Burn Tobacco Product Volume (K) Forecast, by Application 2019 & 2032
- Table 41: Germany Electrically Heat Not Burn Tobacco Product Revenue (million) Forecast, by Application 2019 & 2032
- Table 42: Germany Electrically Heat Not Burn Tobacco Product Volume (K) Forecast, by Application 2019 & 2032
- Table 43: France Electrically Heat Not Burn Tobacco Product Revenue (million) Forecast, by Application 2019 & 2032
- Table 44: France Electrically Heat Not Burn Tobacco Product Volume (K) Forecast, by Application 2019 & 2032
- Table 45: Italy Electrically Heat Not Burn Tobacco Product Revenue (million) Forecast, by Application 2019 & 2032
- Table 46: Italy Electrically Heat Not Burn Tobacco Product Volume (K) Forecast, by Application 2019 & 2032
- Table 47: Spain Electrically Heat Not Burn Tobacco Product Revenue (million) Forecast, by Application 2019 & 2032
- Table 48: Spain Electrically Heat Not Burn Tobacco Product Volume (K) Forecast, by Application 2019 & 2032
- Table 49: Russia Electrically Heat Not Burn Tobacco Product Revenue (million) Forecast, by Application 2019 & 2032
- Table 50: Russia Electrically Heat Not Burn Tobacco Product Volume (K) Forecast, by Application 2019 & 2032
- Table 51: Benelux Electrically Heat Not Burn Tobacco Product Revenue (million) Forecast, by Application 2019 & 2032
- Table 52: Benelux Electrically Heat Not Burn Tobacco Product Volume (K) Forecast, by Application 2019 & 2032
- Table 53: Nordics Electrically Heat Not Burn Tobacco Product Revenue (million) Forecast, by Application 2019 & 2032
- Table 54: Nordics Electrically Heat Not Burn Tobacco Product Volume (K) Forecast, by Application 2019 & 2032
- Table 55: Rest of Europe Electrically Heat Not Burn Tobacco Product Revenue (million) Forecast, by Application 2019 & 2032
- Table 56: Rest of Europe Electrically Heat Not Burn Tobacco Product Volume (K) Forecast, by Application 2019 & 2032
- Table 57: Global Electrically Heat Not Burn Tobacco Product Revenue million Forecast, by Application 2019 & 2032
- Table 58: Global Electrically Heat Not Burn Tobacco Product Volume K Forecast, by Application 2019 & 2032
- Table 59: Global Electrically Heat Not Burn Tobacco Product Revenue million Forecast, by Types 2019 & 2032
- Table 60: Global Electrically Heat Not Burn Tobacco Product Volume K Forecast, by Types 2019 & 2032
- Table 61: Global Electrically Heat Not Burn Tobacco Product Revenue million Forecast, by Country 2019 & 2032
- Table 62: Global Electrically Heat Not Burn Tobacco Product Volume K Forecast, by Country 2019 & 2032
- Table 63: Turkey Electrically Heat Not Burn Tobacco Product Revenue (million) Forecast, by Application 2019 & 2032
- Table 64: Turkey Electrically Heat Not Burn Tobacco Product Volume (K) Forecast, by Application 2019 & 2032
- Table 65: Israel Electrically Heat Not Burn Tobacco Product Revenue (million) Forecast, by Application 2019 & 2032
- Table 66: Israel Electrically Heat Not Burn Tobacco Product Volume (K) Forecast, by Application 2019 & 2032
- Table 67: GCC Electrically Heat Not Burn Tobacco Product Revenue (million) Forecast, by Application 2019 & 2032
- Table 68: GCC Electrically Heat Not Burn Tobacco Product Volume (K) Forecast, by Application 2019 & 2032
- Table 69: North Africa Electrically Heat Not Burn Tobacco Product Revenue (million) Forecast, by Application 2019 & 2032
- Table 70: North Africa Electrically Heat Not Burn Tobacco Product Volume (K) Forecast, by Application 2019 & 2032
- Table 71: South Africa Electrically Heat Not Burn Tobacco Product Revenue (million) Forecast, by Application 2019 & 2032
- Table 72: South Africa Electrically Heat Not Burn Tobacco Product Volume (K) Forecast, by Application 2019 & 2032
- Table 73: Rest of Middle East & Africa Electrically Heat Not Burn Tobacco Product Revenue (million) Forecast, by Application 2019 & 2032
- Table 74: Rest of Middle East & Africa Electrically Heat Not Burn Tobacco Product Volume (K) Forecast, by Application 2019 & 2032
- Table 75: Global Electrically Heat Not Burn Tobacco Product Revenue million Forecast, by Application 2019 & 2032
- Table 76: Global Electrically Heat Not Burn Tobacco Product Volume K Forecast, by Application 2019 & 2032
- Table 77: Global Electrically Heat Not Burn Tobacco Product Revenue million Forecast, by Types 2019 & 2032
- Table 78: Global Electrically Heat Not Burn Tobacco Product Volume K Forecast, by Types 2019 & 2032
- Table 79: Global Electrically Heat Not Burn Tobacco Product Revenue million Forecast, by Country 2019 & 2032
- Table 80: Global Electrically Heat Not Burn Tobacco Product Volume K Forecast, by Country 2019 & 2032
- Table 81: China Electrically Heat Not Burn Tobacco Product Revenue (million) Forecast, by Application 2019 & 2032
- Table 82: China Electrically Heat Not Burn Tobacco Product Volume (K) Forecast, by Application 2019 & 2032
- Table 83: India Electrically Heat Not Burn Tobacco Product Revenue (million) Forecast, by Application 2019 & 2032
- Table 84: India Electrically Heat Not Burn Tobacco Product Volume (K) Forecast, by Application 2019 & 2032
- Table 85: Japan Electrically Heat Not Burn Tobacco Product Revenue (million) Forecast, by Application 2019 & 2032
- Table 86: Japan Electrically Heat Not Burn Tobacco Product Volume (K) Forecast, by Application 2019 & 2032
- Table 87: South Korea Electrically Heat Not Burn Tobacco Product Revenue (million) Forecast, by Application 2019 & 2032
- Table 88: South Korea Electrically Heat Not Burn Tobacco Product Volume (K) Forecast, by Application 2019 & 2032
- Table 89: ASEAN Electrically Heat Not Burn Tobacco Product Revenue (million) Forecast, by Application 2019 & 2032
- Table 90: ASEAN Electrically Heat Not Burn Tobacco Product Volume (K) Forecast, by Application 2019 & 2032
- Table 91: Oceania Electrically Heat Not Burn Tobacco Product Revenue (million) Forecast, by Application 2019 & 2032
- Table 92: Oceania Electrically Heat Not Burn Tobacco Product Volume (K) Forecast, by Application 2019 & 2032
- Table 93: Rest of Asia Pacific Electrically Heat Not Burn Tobacco Product Revenue (million) Forecast, by Application 2019 & 2032
- Table 94: Rest of Asia Pacific Electrically Heat Not Burn Tobacco Product Volume (K) Forecast, by Application 2019 & 2032
Frequently Asked Questions
1. What is the projected Compound Annual Growth Rate (CAGR) of the Electrically Heat Not Burn Tobacco Product?
The projected CAGR is approximately 33.2%.
2. Which companies are prominent players in the Electrically Heat Not Burn Tobacco Product?
Key companies in the market include Philip Morris International, Japan Tobacco International, British American Tobacco, Imperial Brands, KT and G, Pax Labs, Shenzhen Royal Tobacco Industrial, Buddy Technology Development, Shanghai Shunho New Materials, First Union, Mysmok Electronic Technology.
3. What are the main segments of the Electrically Heat Not Burn Tobacco Product?
The market segments include Application, Types.
4. Can you provide details about the market size?
The market size is estimated to be USD 15440 million as of 2022.
5. What are some drivers contributing to market growth?
N/A
6. What are the notable trends driving market growth?
N/A
7. Are there any restraints impacting market growth?
N/A
8. Can you provide examples of recent developments in the market?
N/A
9. What pricing options are available for accessing the report?
Pricing options include single-user, multi-user, and enterprise licenses priced at USD 3350.00, USD 5025.00, and USD 6700.00 respectively.
10. Is the market size provided in terms of value or volume?
The market size is provided in terms of value, measured in million and volume, measured in K.
11. Are there any specific market keywords associated with the report?
Yes, the market keyword associated with the report is "Electrically Heat Not Burn Tobacco Product," which aids in identifying and referencing the specific market segment covered.
12. How do I determine which pricing option suits my needs best?
The pricing options vary based on user requirements and access needs. Individual users may opt for single-user licenses, while businesses requiring broader access may choose multi-user or enterprise licenses for cost-effective access to the report.
13. Are there any additional resources or data provided in the Electrically Heat Not Burn Tobacco Product report?
While the report offers comprehensive insights, it's advisable to review the specific contents or supplementary materials provided to ascertain if additional resources or data are available.
14. How can I stay updated on further developments or reports in the Electrically Heat Not Burn Tobacco Product?
To stay informed about further developments, trends, and reports in the Electrically Heat Not Burn Tobacco Product, consider subscribing to industry newsletters, following relevant companies and organizations, or regularly checking reputable industry news sources and publications.
Methodology
Step 1 - Identification of Relevant Samples Size from Population Database


Step 2 - Approaches for Defining Global Market Size (Value, Volume* & Price*)

Note*: In applicable scenarios
Step 3 - Data Sources
Primary Research
- Web Analytics
- Survey Reports
- Research Institute
- Latest Research Reports
- Opinion Leaders
Secondary Research
- Annual Reports
- White Paper
- Latest Press Release
- Industry Association
- Paid Database
- Investor Presentations

Step 4 - Data Triangulation
Involves using different sources of information in order to increase the validity of a study
These sources are likely to be stakeholders in a program - participants, other researchers, program staff, other community members, and so on.
Then we put all data in single framework & apply various statistical tools to find out the dynamic on the market.
During the analysis stage, feedback from the stakeholder groups would be compared to determine areas of agreement as well as areas of divergence


