
Key Insights
The global electrical pressure-sensitive tape market is experiencing robust growth, driven by the burgeoning electronics industry and the increasing demand for reliable insulation and protection in electrical applications. The market, estimated at $5 billion in 2025, is projected to exhibit a healthy Compound Annual Growth Rate (CAGR) of 6% from 2025 to 2033, reaching approximately $8 billion by 2033. This growth is fueled by several key factors: the proliferation of electric vehicles and renewable energy infrastructure requiring extensive electrical insulation, the miniaturization of electronic components demanding high-precision tapes, and the rising adoption of advanced materials offering enhanced performance characteristics like higher temperature resistance and improved adhesion. Major trends shaping the market include the development of eco-friendly, solvent-free adhesive formulations, the increasing demand for specialized tapes with unique properties like EMI shielding and conductive capabilities, and the growing preference for automated dispensing systems to improve efficiency in manufacturing processes. Despite these positive factors, challenges such as fluctuating raw material prices and the emergence of substitute materials could pose constraints on market growth. Leading players like 3M, Nitto, and Tesa are actively engaged in research and development to address these challenges and maintain their market share through innovation and product diversification.
The competitive landscape is characterized by a mix of established multinational corporations and regional players. While large players dominate the market with their extensive product portfolios and global distribution networks, smaller regional companies are focusing on niche applications and specialized products to gain market share. The market segmentation is expected to be further refined based on tape type (e.g., PVC, PET, acrylic), application (e.g., wire harnessing, PCB protection), and end-use industry (e.g., automotive, electronics). Geographic expansion, particularly in rapidly developing economies in Asia and South America, presents significant opportunities for both established and emerging players. Strategic alliances, acquisitions, and technological advancements will continue to be crucial for sustaining competitiveness in this dynamic market.
Electrical Pressure-Sensitive Tape Market Report: 2019-2033
This comprehensive report provides a detailed analysis of the global electrical pressure-sensitive tape market, offering invaluable insights for industry professionals, investors, and strategic decision-makers. The report covers the period from 2019 to 2033, with a focus on the forecast period of 2025-2033 and a base year of 2025. The parent market is the broader pressure-sensitive adhesive (PSA) tape market, while the child market focuses specifically on tapes utilized in electrical applications. The report analyzes market dynamics, growth trends, regional performance, product landscape, and key players, providing a 360-degree view of this dynamic sector. Expected market size values are presented in million units.
Electrical Pressure-sensitive Tape Market Dynamics & Structure
This section analyzes the competitive landscape of the electrical pressure-sensitive tape market, encompassing market concentration, technological innovation, regulatory influences, and market dynamics. The report investigates the impact of mergers and acquisitions (M&A) activities and identifies key competitive substitutes. The analysis considers end-user demographics and their evolving needs, providing a comprehensive overview of the market structure.
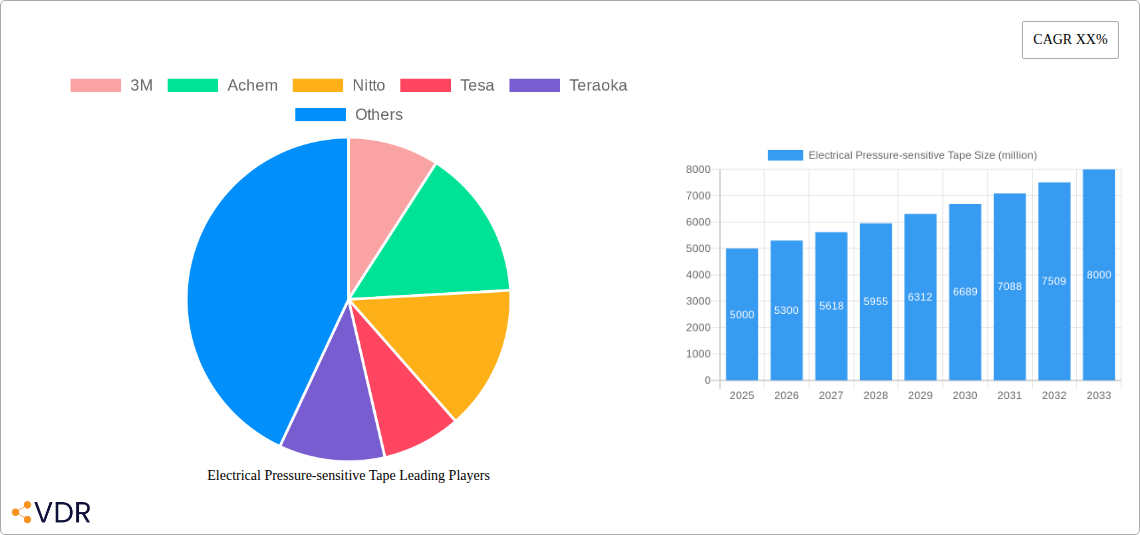
Market Concentration: The market exhibits a moderately concentrated structure, with the top five players – 3M, Nitto, Tesa, Scapa, and Teraoka – holding an estimated xx% of the global market share in 2025. Smaller players like Denka, Yongle Tape, and others compete primarily on price and regional specialization.
Technological Innovation: Ongoing innovation focuses on enhancing adhesion, temperature resistance, and electrical insulation properties. Development of specialized tapes for high-voltage applications and environmentally friendly materials are key drivers. Barriers to innovation include high R&D costs and stringent regulatory approvals.
Regulatory Frameworks: Regulations concerning material safety and environmental impact (e.g., RoHS compliance) significantly impact market dynamics. Stringent standards drive the adoption of eco-friendly materials and manufacturing processes.
Competitive Substitutes: Alternative materials like heat-shrink tubing and other insulation methods compete with electrical tapes, limiting market growth in some niche segments.
M&A Activity: The historical period (2019-2024) witnessed approximately xx M&A deals, primarily driven by expansion strategies and technology acquisitions. The forecast period (2025-2033) is expected to see a further xx M&A deals.
Electrical Pressure-sensitive Tape Growth Trends & Insights
This section presents a comprehensive analysis of the electrical pressure-sensitive tape market's growth trajectory, utilizing various analytical methodologies to provide a detailed understanding of market evolution. The analysis encompasses market size, adoption rates, technological disruptions, and shifts in consumer behavior.
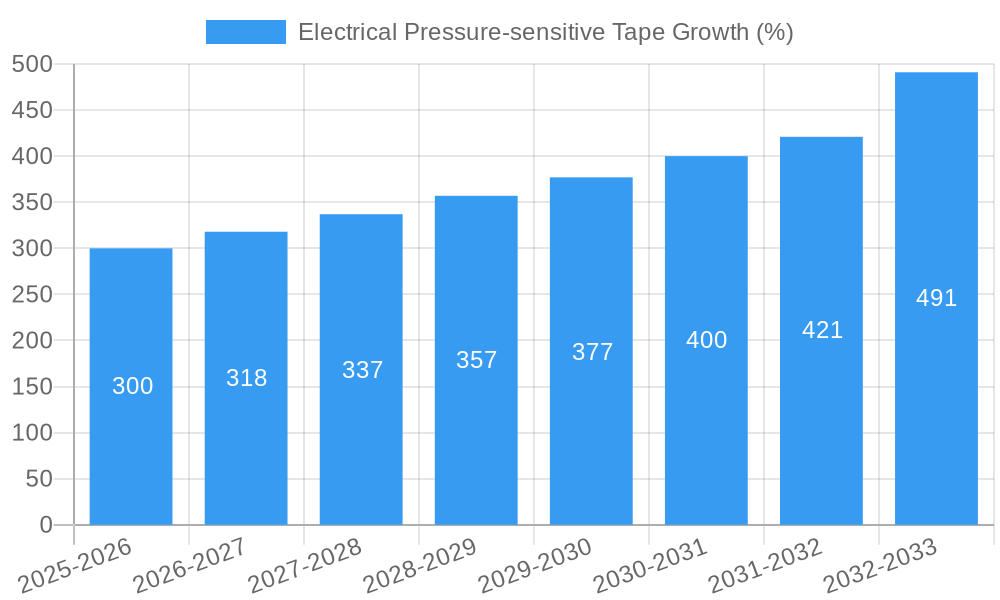
The global electrical pressure-sensitive tape market experienced a CAGR of xx% during the historical period (2019-2024), reaching an estimated xx million units in 2024. The market is projected to maintain a CAGR of xx% during the forecast period (2025-2033), driven by increasing demand from the electronics and automotive industries. Market penetration in developing economies is expected to increase significantly, contributing to this growth. Technological advancements, such as the development of high-temperature and high-voltage tapes, are driving adoption in specialized applications. Shifts in consumer preference toward eco-friendly materials are also influencing market dynamics.
Dominant Regions, Countries, or Segments in Electrical Pressure-sensitive Tape
This section identifies the leading regions, countries, or segments driving market growth. The analysis considers economic policies, infrastructure development, and regional-specific market drivers.
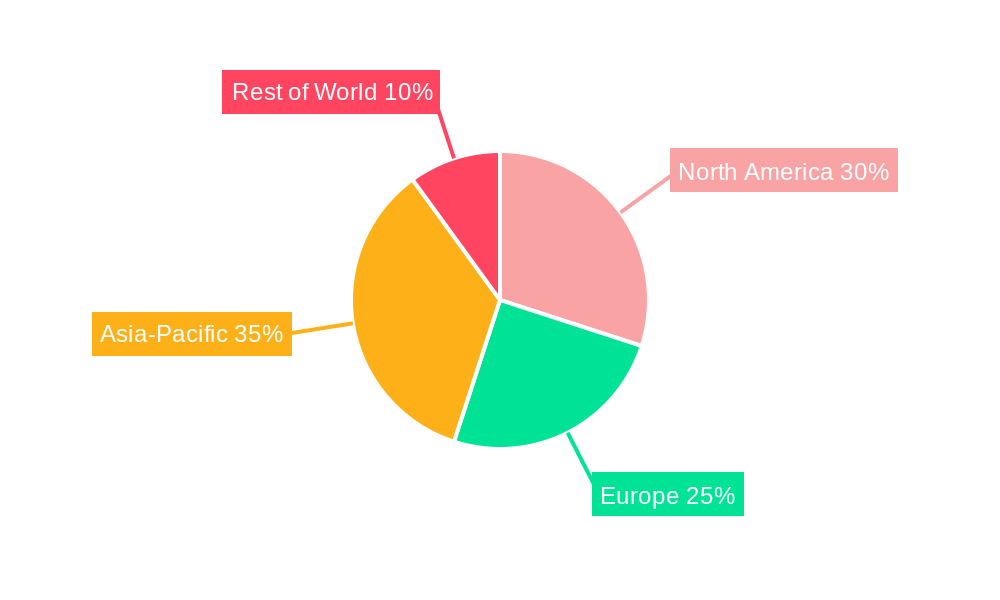
Asia-Pacific Dominance: The Asia-Pacific region is projected to be the largest market for electrical pressure-sensitive tape in 2025, holding approximately xx% market share, driven by rapid growth in electronics manufacturing and automotive production in countries like China, Japan, South Korea, and India. Key drivers include robust infrastructure development and favorable government policies supporting industrial growth.
North America's Steady Growth: North America holds a significant market share and maintains steady growth due to robust demand from the electronics, aerospace, and automotive sectors.
Europe's Mature Market: Europe represents a mature market with stable growth, driven by automotive and industrial applications. Stringent environmental regulations influence the adoption of eco-friendly tape materials.
Electrical Pressure-sensitive Tape Product Landscape
The electrical pressure-sensitive tape market offers a diverse range of products catering to varied applications and performance requirements. These include general-purpose tapes, high-temperature tapes, high-voltage tapes, and specialized tapes for specific industries. Key innovations focus on improving adhesion, dielectric strength, and resistance to environmental factors. Unique selling propositions often involve superior performance at extreme temperatures or enhanced electrical insulation properties. Technological advancements include the use of novel adhesive formulations and the incorporation of conductive or shielding materials.
Key Drivers, Barriers & Challenges in Electrical Pressure-sensitive Tape
Key Drivers:
- Growing demand from the electronics industry.
- Expansion of the automotive sector.
- Increasing adoption of renewable energy technologies.
- Development of advanced materials with improved performance characteristics.
Challenges and Restraints:
- Fluctuations in raw material prices.
- Intense competition from alternative insulation materials.
- Stringent environmental regulations.
- Supply chain disruptions impacting production and delivery timelines. This resulted in a xx% increase in lead times during 2022.
Emerging Opportunities in Electrical Pressure-sensitive Tape
Emerging opportunities lie in the growing demand for specialized tapes in niche applications, such as electric vehicles, renewable energy systems, and advanced electronics. The development of sustainable and eco-friendly tapes presents a significant opportunity. Untapped markets in developing economies also offer considerable growth potential. Furthermore, the increasing adoption of automation in manufacturing processes opens avenues for innovative applications in robotics and automated assembly lines.
Growth Accelerators in the Electrical Pressure-sensitive Tape Industry
Technological breakthroughs in adhesive formulations, the development of specialized tapes for high-performance applications, and strategic collaborations between tape manufacturers and end-users are driving long-term growth. Expanding into new geographic markets and focusing on sustainable materials further accelerate market expansion.
Key Players Shaping the Electrical Pressure-sensitive Tape Market
- 3M
- Achem
- Nitto
- Tesa
- Teraoka
- Scapa
- Denka
- Yongle Tape
- Shushi Group
- Ningbo Sincere
- Plymouth Yongle Tape
- Yiwu Topban
- Shanghai Yongguan
- Shenzhen Cotran
- JZT
- Tianjin Shuang’an
- Haijia Tape
Notable Milestones in Electrical Pressure-sensitive Tape Sector
- 2021 Q3: 3M launched a new line of high-temperature resistant tapes.
- 2022 Q1: Nitto announced a strategic partnership with a major automotive manufacturer.
- 2023 Q2: Scapa acquired a smaller tape manufacturer specializing in sustainable materials.
- Further milestones will be detailed in the full report.
In-Depth Electrical Pressure-sensitive Tape Market Outlook
The electrical pressure-sensitive tape market exhibits strong growth potential, driven by technological advancements, increasing demand from key industries, and expansion into new applications. Strategic partnerships, investments in R&D, and focus on sustainable solutions will be crucial for sustained success in this competitive landscape. The market is poised for continued growth, presenting significant opportunities for both established players and new entrants.
Electrical Pressure-sensitive Tape Segmentation
-
1. Application
- 1.1. Electrical Industry
- 1.2. Electronic Devices
- 1.3. Others
-
2. Types
- 2.1. Insulation Black Tape
- 2.2. PVC Electrical Tape Flame Retardant
- 2.3. High-Pressure Self-adhesive Tape
Electrical Pressure-sensitive Tape Segmentation By Geography
-
1. North America
- 1.1. United States
- 1.2. Canada
- 1.3. Mexico
-
2. South America
- 2.1. Brazil
- 2.2. Argentina
- 2.3. Rest of South America
-
3. Europe
- 3.1. United Kingdom
- 3.2. Germany
- 3.3. France
- 3.4. Italy
- 3.5. Spain
- 3.6. Russia
- 3.7. Benelux
- 3.8. Nordics
- 3.9. Rest of Europe
-
4. Middle East & Africa
- 4.1. Turkey
- 4.2. Israel
- 4.3. GCC
- 4.4. North Africa
- 4.5. South Africa
- 4.6. Rest of Middle East & Africa
-
5. Asia Pacific
- 5.1. China
- 5.2. India
- 5.3. Japan
- 5.4. South Korea
- 5.5. ASEAN
- 5.6. Oceania
- 5.7. Rest of Asia Pacific
Electrical Pressure-sensitive Tape REPORT HIGHLIGHTS
| Aspects | Details |
|---|---|
| Study Period | 2019-2033 |
| Base Year | 2024 |
| Estimated Year | 2025 |
| Forecast Period | 2025-2033 |
| Historical Period | 2019-2024 |
| Growth Rate | CAGR of XX% from 2019-2033 |
| Segmentation |
|
Table of Contents
- 1. Introduction
- 1.1. Research Scope
- 1.2. Market Segmentation
- 1.3. Research Methodology
- 1.4. Definitions and Assumptions
- 2. Executive Summary
- 2.1. Introduction
- 3. Market Dynamics
- 3.1. Introduction
- 3.2. Market Drivers
- 3.3. Market Restrains
- 3.4. Market Trends
- 4. Market Factor Analysis
- 4.1. Porters Five Forces
- 4.2. Supply/Value Chain
- 4.3. PESTEL analysis
- 4.4. Market Entropy
- 4.5. Patent/Trademark Analysis
- 5. Global Electrical Pressure-sensitive Tape Analysis, Insights and Forecast, 2019-2031
- 5.1. Market Analysis, Insights and Forecast - by Application
- 5.1.1. Electrical Industry
- 5.1.2. Electronic Devices
- 5.1.3. Others
- 5.2. Market Analysis, Insights and Forecast - by Types
- 5.2.1. Insulation Black Tape
- 5.2.2. PVC Electrical Tape Flame Retardant
- 5.2.3. High-Pressure Self-adhesive Tape
- 5.3. Market Analysis, Insights and Forecast - by Region
- 5.3.1. North America
- 5.3.2. South America
- 5.3.3. Europe
- 5.3.4. Middle East & Africa
- 5.3.5. Asia Pacific
- 5.1. Market Analysis, Insights and Forecast - by Application
- 6. North America Electrical Pressure-sensitive Tape Analysis, Insights and Forecast, 2019-2031
- 6.1. Market Analysis, Insights and Forecast - by Application
- 6.1.1. Electrical Industry
- 6.1.2. Electronic Devices
- 6.1.3. Others
- 6.2. Market Analysis, Insights and Forecast - by Types
- 6.2.1. Insulation Black Tape
- 6.2.2. PVC Electrical Tape Flame Retardant
- 6.2.3. High-Pressure Self-adhesive Tape
- 6.1. Market Analysis, Insights and Forecast - by Application
- 7. South America Electrical Pressure-sensitive Tape Analysis, Insights and Forecast, 2019-2031
- 7.1. Market Analysis, Insights and Forecast - by Application
- 7.1.1. Electrical Industry
- 7.1.2. Electronic Devices
- 7.1.3. Others
- 7.2. Market Analysis, Insights and Forecast - by Types
- 7.2.1. Insulation Black Tape
- 7.2.2. PVC Electrical Tape Flame Retardant
- 7.2.3. High-Pressure Self-adhesive Tape
- 7.1. Market Analysis, Insights and Forecast - by Application
- 8. Europe Electrical Pressure-sensitive Tape Analysis, Insights and Forecast, 2019-2031
- 8.1. Market Analysis, Insights and Forecast - by Application
- 8.1.1. Electrical Industry
- 8.1.2. Electronic Devices
- 8.1.3. Others
- 8.2. Market Analysis, Insights and Forecast - by Types
- 8.2.1. Insulation Black Tape
- 8.2.2. PVC Electrical Tape Flame Retardant
- 8.2.3. High-Pressure Self-adhesive Tape
- 8.1. Market Analysis, Insights and Forecast - by Application
- 9. Middle East & Africa Electrical Pressure-sensitive Tape Analysis, Insights and Forecast, 2019-2031
- 9.1. Market Analysis, Insights and Forecast - by Application
- 9.1.1. Electrical Industry
- 9.1.2. Electronic Devices
- 9.1.3. Others
- 9.2. Market Analysis, Insights and Forecast - by Types
- 9.2.1. Insulation Black Tape
- 9.2.2. PVC Electrical Tape Flame Retardant
- 9.2.3. High-Pressure Self-adhesive Tape
- 9.1. Market Analysis, Insights and Forecast - by Application
- 10. Asia Pacific Electrical Pressure-sensitive Tape Analysis, Insights and Forecast, 2019-2031
- 10.1. Market Analysis, Insights and Forecast - by Application
- 10.1.1. Electrical Industry
- 10.1.2. Electronic Devices
- 10.1.3. Others
- 10.2. Market Analysis, Insights and Forecast - by Types
- 10.2.1. Insulation Black Tape
- 10.2.2. PVC Electrical Tape Flame Retardant
- 10.2.3. High-Pressure Self-adhesive Tape
- 10.1. Market Analysis, Insights and Forecast - by Application
- 11. Competitive Analysis
- 11.1. Global Market Share Analysis 2024
- 11.2. Company Profiles
- 11.2.1 3M
- 11.2.1.1. Overview
- 11.2.1.2. Products
- 11.2.1.3. SWOT Analysis
- 11.2.1.4. Recent Developments
- 11.2.1.5. Financials (Based on Availability)
- 11.2.2 Achem
- 11.2.2.1. Overview
- 11.2.2.2. Products
- 11.2.2.3. SWOT Analysis
- 11.2.2.4. Recent Developments
- 11.2.2.5. Financials (Based on Availability)
- 11.2.3 Nitto
- 11.2.3.1. Overview
- 11.2.3.2. Products
- 11.2.3.3. SWOT Analysis
- 11.2.3.4. Recent Developments
- 11.2.3.5. Financials (Based on Availability)
- 11.2.4 Tesa
- 11.2.4.1. Overview
- 11.2.4.2. Products
- 11.2.4.3. SWOT Analysis
- 11.2.4.4. Recent Developments
- 11.2.4.5. Financials (Based on Availability)
- 11.2.5 Teraoka
- 11.2.5.1. Overview
- 11.2.5.2. Products
- 11.2.5.3. SWOT Analysis
- 11.2.5.4. Recent Developments
- 11.2.5.5. Financials (Based on Availability)
- 11.2.6 Scapa
- 11.2.6.1. Overview
- 11.2.6.2. Products
- 11.2.6.3. SWOT Analysis
- 11.2.6.4. Recent Developments
- 11.2.6.5. Financials (Based on Availability)
- 11.2.7 Denka
- 11.2.7.1. Overview
- 11.2.7.2. Products
- 11.2.7.3. SWOT Analysis
- 11.2.7.4. Recent Developments
- 11.2.7.5. Financials (Based on Availability)
- 11.2.8 Yongle Tape
- 11.2.8.1. Overview
- 11.2.8.2. Products
- 11.2.8.3. SWOT Analysis
- 11.2.8.4. Recent Developments
- 11.2.8.5. Financials (Based on Availability)
- 11.2.9 Shushi Group
- 11.2.9.1. Overview
- 11.2.9.2. Products
- 11.2.9.3. SWOT Analysis
- 11.2.9.4. Recent Developments
- 11.2.9.5. Financials (Based on Availability)
- 11.2.10 Ningbo Sincere
- 11.2.10.1. Overview
- 11.2.10.2. Products
- 11.2.10.3. SWOT Analysis
- 11.2.10.4. Recent Developments
- 11.2.10.5. Financials (Based on Availability)
- 11.2.11 Plymouth Yongle Tape
- 11.2.11.1. Overview
- 11.2.11.2. Products
- 11.2.11.3. SWOT Analysis
- 11.2.11.4. Recent Developments
- 11.2.11.5. Financials (Based on Availability)
- 11.2.12 Yiwu Topban
- 11.2.12.1. Overview
- 11.2.12.2. Products
- 11.2.12.3. SWOT Analysis
- 11.2.12.4. Recent Developments
- 11.2.12.5. Financials (Based on Availability)
- 11.2.13 Shanghai Yongguan
- 11.2.13.1. Overview
- 11.2.13.2. Products
- 11.2.13.3. SWOT Analysis
- 11.2.13.4. Recent Developments
- 11.2.13.5. Financials (Based on Availability)
- 11.2.14 Shenzhen Cotran
- 11.2.14.1. Overview
- 11.2.14.2. Products
- 11.2.14.3. SWOT Analysis
- 11.2.14.4. Recent Developments
- 11.2.14.5. Financials (Based on Availability)
- 11.2.15 JZT
- 11.2.15.1. Overview
- 11.2.15.2. Products
- 11.2.15.3. SWOT Analysis
- 11.2.15.4. Recent Developments
- 11.2.15.5. Financials (Based on Availability)
- 11.2.16 Tianjin Shuang’an
- 11.2.16.1. Overview
- 11.2.16.2. Products
- 11.2.16.3. SWOT Analysis
- 11.2.16.4. Recent Developments
- 11.2.16.5. Financials (Based on Availability)
- 11.2.17 Haijia Tape
- 11.2.17.1. Overview
- 11.2.17.2. Products
- 11.2.17.3. SWOT Analysis
- 11.2.17.4. Recent Developments
- 11.2.17.5. Financials (Based on Availability)
- 11.2.1 3M
List of Figures
- Figure 1: Global Electrical Pressure-sensitive Tape Revenue Breakdown (million, %) by Region 2024 & 2032
- Figure 2: North America Electrical Pressure-sensitive Tape Revenue (million), by Application 2024 & 2032
- Figure 3: North America Electrical Pressure-sensitive Tape Revenue Share (%), by Application 2024 & 2032
- Figure 4: North America Electrical Pressure-sensitive Tape Revenue (million), by Types 2024 & 2032
- Figure 5: North America Electrical Pressure-sensitive Tape Revenue Share (%), by Types 2024 & 2032
- Figure 6: North America Electrical Pressure-sensitive Tape Revenue (million), by Country 2024 & 2032
- Figure 7: North America Electrical Pressure-sensitive Tape Revenue Share (%), by Country 2024 & 2032
- Figure 8: South America Electrical Pressure-sensitive Tape Revenue (million), by Application 2024 & 2032
- Figure 9: South America Electrical Pressure-sensitive Tape Revenue Share (%), by Application 2024 & 2032
- Figure 10: South America Electrical Pressure-sensitive Tape Revenue (million), by Types 2024 & 2032
- Figure 11: South America Electrical Pressure-sensitive Tape Revenue Share (%), by Types 2024 & 2032
- Figure 12: South America Electrical Pressure-sensitive Tape Revenue (million), by Country 2024 & 2032
- Figure 13: South America Electrical Pressure-sensitive Tape Revenue Share (%), by Country 2024 & 2032
- Figure 14: Europe Electrical Pressure-sensitive Tape Revenue (million), by Application 2024 & 2032
- Figure 15: Europe Electrical Pressure-sensitive Tape Revenue Share (%), by Application 2024 & 2032
- Figure 16: Europe Electrical Pressure-sensitive Tape Revenue (million), by Types 2024 & 2032
- Figure 17: Europe Electrical Pressure-sensitive Tape Revenue Share (%), by Types 2024 & 2032
- Figure 18: Europe Electrical Pressure-sensitive Tape Revenue (million), by Country 2024 & 2032
- Figure 19: Europe Electrical Pressure-sensitive Tape Revenue Share (%), by Country 2024 & 2032
- Figure 20: Middle East & Africa Electrical Pressure-sensitive Tape Revenue (million), by Application 2024 & 2032
- Figure 21: Middle East & Africa Electrical Pressure-sensitive Tape Revenue Share (%), by Application 2024 & 2032
- Figure 22: Middle East & Africa Electrical Pressure-sensitive Tape Revenue (million), by Types 2024 & 2032
- Figure 23: Middle East & Africa Electrical Pressure-sensitive Tape Revenue Share (%), by Types 2024 & 2032
- Figure 24: Middle East & Africa Electrical Pressure-sensitive Tape Revenue (million), by Country 2024 & 2032
- Figure 25: Middle East & Africa Electrical Pressure-sensitive Tape Revenue Share (%), by Country 2024 & 2032
- Figure 26: Asia Pacific Electrical Pressure-sensitive Tape Revenue (million), by Application 2024 & 2032
- Figure 27: Asia Pacific Electrical Pressure-sensitive Tape Revenue Share (%), by Application 2024 & 2032
- Figure 28: Asia Pacific Electrical Pressure-sensitive Tape Revenue (million), by Types 2024 & 2032
- Figure 29: Asia Pacific Electrical Pressure-sensitive Tape Revenue Share (%), by Types 2024 & 2032
- Figure 30: Asia Pacific Electrical Pressure-sensitive Tape Revenue (million), by Country 2024 & 2032
- Figure 31: Asia Pacific Electrical Pressure-sensitive Tape Revenue Share (%), by Country 2024 & 2032
List of Tables
- Table 1: Global Electrical Pressure-sensitive Tape Revenue million Forecast, by Region 2019 & 2032
- Table 2: Global Electrical Pressure-sensitive Tape Revenue million Forecast, by Application 2019 & 2032
- Table 3: Global Electrical Pressure-sensitive Tape Revenue million Forecast, by Types 2019 & 2032
- Table 4: Global Electrical Pressure-sensitive Tape Revenue million Forecast, by Region 2019 & 2032
- Table 5: Global Electrical Pressure-sensitive Tape Revenue million Forecast, by Application 2019 & 2032
- Table 6: Global Electrical Pressure-sensitive Tape Revenue million Forecast, by Types 2019 & 2032
- Table 7: Global Electrical Pressure-sensitive Tape Revenue million Forecast, by Country 2019 & 2032
- Table 8: United States Electrical Pressure-sensitive Tape Revenue (million) Forecast, by Application 2019 & 2032
- Table 9: Canada Electrical Pressure-sensitive Tape Revenue (million) Forecast, by Application 2019 & 2032
- Table 10: Mexico Electrical Pressure-sensitive Tape Revenue (million) Forecast, by Application 2019 & 2032
- Table 11: Global Electrical Pressure-sensitive Tape Revenue million Forecast, by Application 2019 & 2032
- Table 12: Global Electrical Pressure-sensitive Tape Revenue million Forecast, by Types 2019 & 2032
- Table 13: Global Electrical Pressure-sensitive Tape Revenue million Forecast, by Country 2019 & 2032
- Table 14: Brazil Electrical Pressure-sensitive Tape Revenue (million) Forecast, by Application 2019 & 2032
- Table 15: Argentina Electrical Pressure-sensitive Tape Revenue (million) Forecast, by Application 2019 & 2032
- Table 16: Rest of South America Electrical Pressure-sensitive Tape Revenue (million) Forecast, by Application 2019 & 2032
- Table 17: Global Electrical Pressure-sensitive Tape Revenue million Forecast, by Application 2019 & 2032
- Table 18: Global Electrical Pressure-sensitive Tape Revenue million Forecast, by Types 2019 & 2032
- Table 19: Global Electrical Pressure-sensitive Tape Revenue million Forecast, by Country 2019 & 2032
- Table 20: United Kingdom Electrical Pressure-sensitive Tape Revenue (million) Forecast, by Application 2019 & 2032
- Table 21: Germany Electrical Pressure-sensitive Tape Revenue (million) Forecast, by Application 2019 & 2032
- Table 22: France Electrical Pressure-sensitive Tape Revenue (million) Forecast, by Application 2019 & 2032
- Table 23: Italy Electrical Pressure-sensitive Tape Revenue (million) Forecast, by Application 2019 & 2032
- Table 24: Spain Electrical Pressure-sensitive Tape Revenue (million) Forecast, by Application 2019 & 2032
- Table 25: Russia Electrical Pressure-sensitive Tape Revenue (million) Forecast, by Application 2019 & 2032
- Table 26: Benelux Electrical Pressure-sensitive Tape Revenue (million) Forecast, by Application 2019 & 2032
- Table 27: Nordics Electrical Pressure-sensitive Tape Revenue (million) Forecast, by Application 2019 & 2032
- Table 28: Rest of Europe Electrical Pressure-sensitive Tape Revenue (million) Forecast, by Application 2019 & 2032
- Table 29: Global Electrical Pressure-sensitive Tape Revenue million Forecast, by Application 2019 & 2032
- Table 30: Global Electrical Pressure-sensitive Tape Revenue million Forecast, by Types 2019 & 2032
- Table 31: Global Electrical Pressure-sensitive Tape Revenue million Forecast, by Country 2019 & 2032
- Table 32: Turkey Electrical Pressure-sensitive Tape Revenue (million) Forecast, by Application 2019 & 2032
- Table 33: Israel Electrical Pressure-sensitive Tape Revenue (million) Forecast, by Application 2019 & 2032
- Table 34: GCC Electrical Pressure-sensitive Tape Revenue (million) Forecast, by Application 2019 & 2032
- Table 35: North Africa Electrical Pressure-sensitive Tape Revenue (million) Forecast, by Application 2019 & 2032
- Table 36: South Africa Electrical Pressure-sensitive Tape Revenue (million) Forecast, by Application 2019 & 2032
- Table 37: Rest of Middle East & Africa Electrical Pressure-sensitive Tape Revenue (million) Forecast, by Application 2019 & 2032
- Table 38: Global Electrical Pressure-sensitive Tape Revenue million Forecast, by Application 2019 & 2032
- Table 39: Global Electrical Pressure-sensitive Tape Revenue million Forecast, by Types 2019 & 2032
- Table 40: Global Electrical Pressure-sensitive Tape Revenue million Forecast, by Country 2019 & 2032
- Table 41: China Electrical Pressure-sensitive Tape Revenue (million) Forecast, by Application 2019 & 2032
- Table 42: India Electrical Pressure-sensitive Tape Revenue (million) Forecast, by Application 2019 & 2032
- Table 43: Japan Electrical Pressure-sensitive Tape Revenue (million) Forecast, by Application 2019 & 2032
- Table 44: South Korea Electrical Pressure-sensitive Tape Revenue (million) Forecast, by Application 2019 & 2032
- Table 45: ASEAN Electrical Pressure-sensitive Tape Revenue (million) Forecast, by Application 2019 & 2032
- Table 46: Oceania Electrical Pressure-sensitive Tape Revenue (million) Forecast, by Application 2019 & 2032
- Table 47: Rest of Asia Pacific Electrical Pressure-sensitive Tape Revenue (million) Forecast, by Application 2019 & 2032
Frequently Asked Questions
1. What is the projected Compound Annual Growth Rate (CAGR) of the Electrical Pressure-sensitive Tape?
The projected CAGR is approximately XX%.
2. Which companies are prominent players in the Electrical Pressure-sensitive Tape?
Key companies in the market include 3M, Achem, Nitto, Tesa, Teraoka, Scapa, Denka, Yongle Tape, Shushi Group, Ningbo Sincere, Plymouth Yongle Tape, Yiwu Topban, Shanghai Yongguan, Shenzhen Cotran, JZT, Tianjin Shuang’an, Haijia Tape.
3. What are the main segments of the Electrical Pressure-sensitive Tape?
The market segments include Application, Types.
4. Can you provide details about the market size?
The market size is estimated to be USD XXX million as of 2022.
5. What are some drivers contributing to market growth?
N/A
6. What are the notable trends driving market growth?
N/A
7. Are there any restraints impacting market growth?
N/A
8. Can you provide examples of recent developments in the market?
N/A
9. What pricing options are available for accessing the report?
Pricing options include single-user, multi-user, and enterprise licenses priced at USD 4900.00, USD 7350.00, and USD 9800.00 respectively.
10. Is the market size provided in terms of value or volume?
The market size is provided in terms of value, measured in million.
11. Are there any specific market keywords associated with the report?
Yes, the market keyword associated with the report is "Electrical Pressure-sensitive Tape," which aids in identifying and referencing the specific market segment covered.
12. How do I determine which pricing option suits my needs best?
The pricing options vary based on user requirements and access needs. Individual users may opt for single-user licenses, while businesses requiring broader access may choose multi-user or enterprise licenses for cost-effective access to the report.
13. Are there any additional resources or data provided in the Electrical Pressure-sensitive Tape report?
While the report offers comprehensive insights, it's advisable to review the specific contents or supplementary materials provided to ascertain if additional resources or data are available.
14. How can I stay updated on further developments or reports in the Electrical Pressure-sensitive Tape?
To stay informed about further developments, trends, and reports in the Electrical Pressure-sensitive Tape, consider subscribing to industry newsletters, following relevant companies and organizations, or regularly checking reputable industry news sources and publications.
Methodology
Step 1 - Identification of Relevant Samples Size from Population Database


Step 2 - Approaches for Defining Global Market Size (Value, Volume* & Price*)

Note*: In applicable scenarios
Step 3 - Data Sources
Primary Research
- Web Analytics
- Survey Reports
- Research Institute
- Latest Research Reports
- Opinion Leaders
Secondary Research
- Annual Reports
- White Paper
- Latest Press Release
- Industry Association
- Paid Database
- Investor Presentations

Step 4 - Data Triangulation
Involves using different sources of information in order to increase the validity of a study
These sources are likely to be stakeholders in a program - participants, other researchers, program staff, other community members, and so on.
Then we put all data in single framework & apply various statistical tools to find out the dynamic on the market.
During the analysis stage, feedback from the stakeholder groups would be compared to determine areas of agreement as well as areas of divergence


