

Key Insights
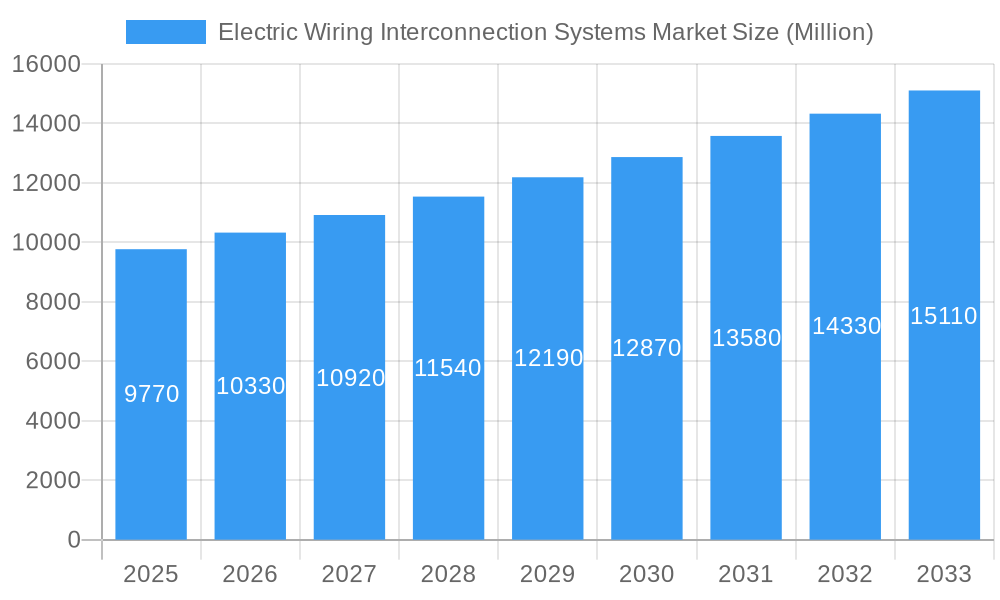
The Electric Wiring Interconnection Systems market is experiencing robust growth, projected to reach a valuation of $9.77 billion in 2025, expanding at a compound annual growth rate (CAGR) of 5.46% from 2025 to 2033. This growth is fueled by several key factors. The increasing adoption of electric vehicles (EVs) and hybrid electric vehicles (HEVs) is a significant driver, demanding sophisticated and reliable wiring interconnection systems to manage the complex power distribution within these vehicles. Furthermore, the expanding aerospace and defense sectors, with their stringent safety requirements and need for lightweight yet highly durable systems, contribute substantially to market expansion. Advancements in materials science, leading to lighter, more efficient, and heat-resistant components, are further propelling market growth. The integration of smart technologies and the rising demand for improved fuel efficiency in various applications also play crucial roles in shaping the market landscape.
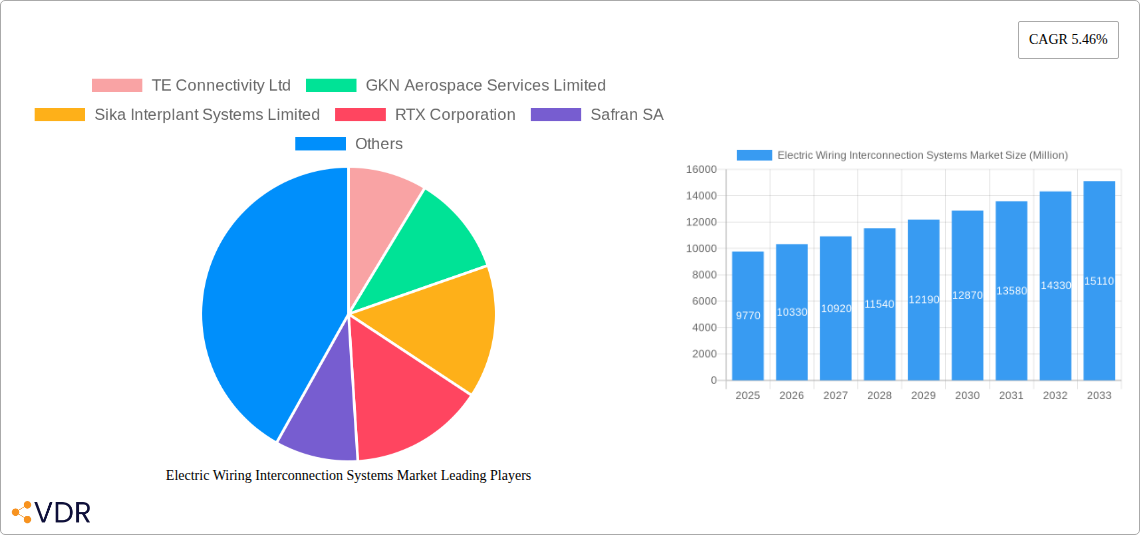
Electric Wiring Interconnection Systems Market Market Size (In Billion)
Competitive dynamics within the market are intense, with established players such as TE Connectivity Ltd, GKN Aerospace Services Limited, and Amphenol Corporation vying for market share. These companies are constantly innovating to meet evolving customer demands and to develop technologically advanced products capable of handling the ever-increasing power demands and data transmission requirements of modern applications. The market is also witnessing increased mergers and acquisitions, collaborations, and strategic partnerships, all aimed at enhancing product portfolios and expanding geographic reach. Despite the positive outlook, potential market restraints include the high initial investment costs associated with adopting new technologies and the ongoing challenges of meeting stringent safety and regulatory standards. However, the long-term growth trajectory remains positive, driven by ongoing technological advancements and the increasing electrification of various industries.
Electric Wiring Interconnection Systems Market Company Market Share
Electric Wiring Interconnection Systems (EWIS) Market Report: 2019-2033
This comprehensive report provides an in-depth analysis of the Electric Wiring Interconnection Systems (EWIS) market, encompassing its dynamics, growth trends, regional segmentation, product landscape, key players, and future outlook. The study period covers 2019-2033, with 2025 as the base and estimated year. The report is crucial for industry professionals, investors, and strategic decision-makers seeking a clear understanding of this rapidly evolving market. The parent market is the aerospace and defense sector, while the child market includes automotive, industrial automation, and renewable energy. The global EWIS market is projected to reach xx Million units by 2033.
Electric Wiring Interconnection Systems Market Dynamics & Structure
The EWIS market is characterized by a moderately concentrated landscape, with a few dominant players and numerous smaller specialized companies. Technological innovation, driven by increasing demand for lightweight, high-performance systems, is a major growth driver. Stringent regulatory frameworks concerning safety and reliability in various industries (e.g., aerospace) significantly influence market dynamics. Competitive product substitutes, such as wireless communication technologies, present challenges but also fuel innovation. End-user demographics are shifting towards sectors like electric vehicles and renewable energy, creating new growth opportunities. M&A activity remains relatively active, with a projected xx deals in 2025, primarily aimed at expanding product portfolios and geographical reach.
- Market Concentration: Moderately concentrated, with top 5 players holding approximately xx% market share in 2025.
- Technological Innovation: Focus on lightweight materials, miniaturization, and improved thermal management.
- Regulatory Landscape: Stringent safety standards and certifications (e.g., DO-160 for aerospace).
- Competitive Substitutes: Wireless technologies and alternative interconnection methods.
- End-User Demographics: Growing demand from electric vehicles, renewable energy, and industrial automation.
- M&A Activity: xx deals predicted in 2025, driving consolidation and expansion.
Electric Wiring Interconnection Systems Market Growth Trends & Insights
The Electric Wiring Interconnection Systems (EWIS) market is demonstrating exceptional dynamism and is poised for significant expansion. This robust growth is underpinned by several critical factors, including the accelerating trend of electrification across a multitude of industries, the imperative of adhering to increasingly stringent safety regulations, and continuous advancements in material science and sophisticated manufacturing techniques. The market experienced substantial growth, expanding from an estimated xx Million units in 2019 to xx Million units in 2024, reflecting a Compound Annual Growth Rate (CAGR) of xx% during this historical period. The uptake of cutting-edge EWIS technologies, particularly within the demanding aerospace and rapidly evolving automotive sectors, continues its upward trajectory. This surge is further propelled by the escalating complexity of modern electrical systems and the non-negotiable need for enhanced reliability and superior performance. Emerging technological disruptions, such as the seamless integration of smart sensors and sophisticated data analytics, are fundamentally reshaping the market landscape, thereby unlocking novel revenue streams. Concurrently, evolving consumer preferences are leaning towards sustainable and environmentally conscious solutions, actively driving the demand for EWIS that are not only lightweight but also energy-efficient. The market is projected to sustain this momentum, forecasting a CAGR of xx% during the upcoming forecast period (2025-2033). Consequently, market penetration is anticipated to rise from an estimated xx% in 2025 to xx% by 2033.
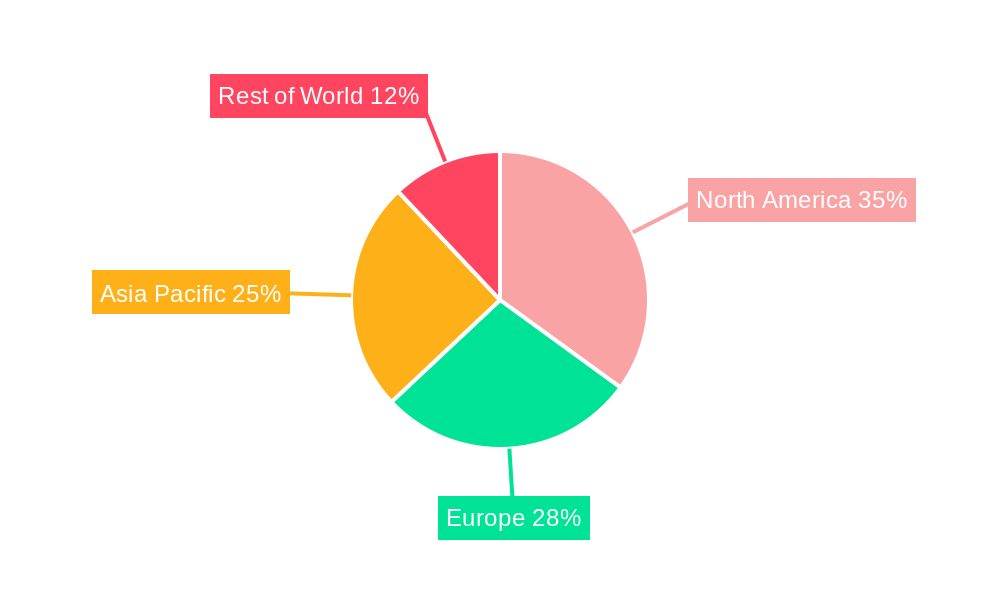
Dominant Regions, Countries, or Segments in Electric Wiring Interconnection Systems Market
North America currently holds a commanding position in the global EWIS market. This dominance is attributed to its well-established and advanced aerospace and automotive industries, complemented by a robust regulatory environment and substantial investments in research and development initiatives. Europe closely follows, exhibiting consistent growth driven by the escalating adoption of electric vehicles and stringent environmental mandates. The Asia-Pacific region, on the other hand, represents a high-growth potential market, primarily fueled by the burgeoning automotive and industrial sectors in its developing economies.
- North America: Characterized by strong aerospace and automotive sectors, coupled with advanced technological capabilities and significant R&D investment.
- Europe: Driven by high adoption rates of electric vehicles, stringent environmental regulations, and a mature industrial base.
- Asia-Pacific: Experiencing rapid expansion in automotive and industrial sectors, accompanied by increasing foreign and domestic investments in manufacturing and infrastructure.
- Market Share (Projected for 2025): North America is expected to hold approximately xx% of the market share, with Europe at xx% and Asia-Pacific at xx%.
Electric Wiring Interconnection Systems Market Product Landscape
The EWIS market is distinguished by an extensive and diverse array of products, encompassing essential components such as wire harnesses, connectors, terminals, and a variety of associated fittings. Each product category is meticulously engineered to meet the unique demands and specific performance criteria of distinct applications. Recent advancements in product innovation are prominently focused on achieving substantial weight reduction, enhancing overall durability and lifespan, and significantly improving signal integrity. The utilization of advanced materials, including lightweight composites and high-temperature resistant polymers, is becoming increasingly prevalent. Unique selling propositions for these products often stem from specialized features, such as advanced electromagnetic interference (EMI) shielding capabilities, support for high-speed data transmission, and superior environmental sealing against harsh conditions. These crucial advancements are largely driven by the escalating demand for more sophisticated and reliable electrical systems across key sectors like aerospace, electric vehicles, and industrial automation.
Key Drivers, Barriers & Challenges in Electric Wiring Interconnection Systems Market
Key Drivers:
- The pervasive and continuous increase in electrification across diverse sectors, including automotive, aerospace, and renewable energy.
- Stringent safety and performance standards that necessitate the adoption of advanced and highly reliable EWIS.
- Ongoing technological advancements in both material science and manufacturing processes, leading to more efficient and effective EWIS solutions.
Key Challenges & Restraints:
- Significant supply chain disruptions that can impact the availability of raw materials and extend lead times. These disruptions have had an estimated impact of xx% on production volumes in 2024.
- The inherent complexity of certification and regulatory compliance requirements, particularly in highly regulated industries such as aerospace.
- Intense market competition and prevailing pricing pressures, which can affect profit margins.
Emerging Opportunities in Electric Wiring Interconnection Systems Market
- Expansion into emerging markets (e.g., Africa, South America).
- Development of innovative EWIS solutions for electric aircraft and autonomous vehicles.
- Integration of smart sensors and data analytics for enhanced system monitoring and diagnostics.
- Growing demand for environmentally friendly and recyclable materials.
Growth Accelerators in the Electric Wiring Interconnection Systems Market Industry
Technological breakthroughs in miniaturization, lightweight materials, and high-speed data transmission will significantly accelerate long-term growth. Strategic partnerships between EWIS manufacturers and end-users, particularly in emerging sectors like electric aviation and autonomous vehicles, will drive market expansion. Market expansion strategies targeting niche segments and untapped geographical areas will also contribute to sustained growth.
Key Players Shaping the Electric Wiring Interconnection Systems Market Market
- TE Connectivity Ltd
- GKN Aerospace Services Limited
- Sika Interplant Systems Limited
- RTX Corporation
- Safran SA
- E I S Electronics GmbH
- Amphenol Corporation
- AMETEK Inc
- LATECOERE
- Radiall SA
- L3Harris Technologies Inc
- Smiths Group PL
Notable Milestones in Electric Wiring Interconnection Systems Market Sector
- May 2024: GKN Aerospace delivered the first fully integrated wings, empennage, and EWIS for Eviation's Alice all-electric aircraft.
- September 2023: Rosenberger secured a contract to supply high-voltage electrical harness systems for Lilium NV's all-electric VTOL jet.
In-Depth Electric Wiring Interconnection Systems Market Market Outlook
The EWIS market is poised for significant growth driven by the accelerating adoption of electric vehicles, the expansion of renewable energy infrastructure, and the growing demand for advanced electrical systems in aerospace and industrial automation. Strategic partnerships, focused R&D, and the development of innovative, sustainable solutions will unlock substantial opportunities for market expansion and propel future growth. The market's future potential is particularly strong in regions with developing industrial sectors and supportive government policies promoting electrification and sustainable technologies.
Electric Wiring Interconnection Systems Market Segmentation
-
1. Component
- 1.1. Wires and Cables
- 1.2. Connectors and Connector Accessories
- 1.3. Terminals and Splices
- 1.4. Other Components
-
2. Platform
-
2.1. Aviation
- 2.1.1. Military Aviation
- 2.1.2. Civil and Commercial Aviation
- 2.2. Defense
- 2.3. Marine
-
2.1. Aviation
Electric Wiring Interconnection Systems Market Segmentation By Geography
-
1. North America
- 1.1. United States
- 1.2. Canada
-
2. Europe
- 2.1. United Kingdom
- 2.2. Germany
- 2.3. France
- 2.4. Russia
- 2.5. Rest of Europe
-
3. Asia Pacific
- 3.1. China
- 3.2. India
- 3.3. Japan
- 3.4. South Korea
- 3.5. Rest of Asia Pacific
-
4. Latin America
- 4.1. Brazil
- 4.2. Rest of Latin America
-
5. Middle East and Africa
- 5.1. United Arab Emirates
- 5.2. Saudi Arabia
- 5.3. Egypt
- 5.4. Rest of Middle East and Africa
Electric Wiring Interconnection Systems Market Regional Market Share
Geographic Coverage of Electric Wiring Interconnection Systems Market
Electric Wiring Interconnection Systems Market REPORT HIGHLIGHTS
| Aspects | Details |
|---|---|
| Study Period | 2020-2034 |
| Base Year | 2025 |
| Estimated Year | 2026 |
| Forecast Period | 2026-2034 |
| Historical Period | 2020-2025 |
| Growth Rate | CAGR of 5.46% from 2020-2034 |
| Segmentation |
|
Table of Contents
- 1. Introduction
- 1.1. Research Scope
- 1.2. Market Segmentation
- 1.3. Research Objective
- 1.4. Definitions and Assumptions
- 2. Executive Summary
- 2.1. Market Snapshot
- 3. Market Dynamics
- 3.1. Market Drivers
- 3.2. Market Restrains
- 3.3. Market Trends
- 3.4. Market Opportunities
- 4. Market Factor Analysis
- 4.1. Porters Five Forces
- 4.1.1. Bargaining Power of Suppliers
- 4.1.2. Bargaining Power of Buyers
- 4.1.3. Threat of New Entrants
- 4.1.4. Threat of Substitutes
- 4.1.5. Competitive Rivalry
- 4.2. PESTEL analysis
- 4.3. BCG Analysis
- 4.3.1. Stars (High Growth, High Market Share)
- 4.3.2. Cash Cows (Low Growth, High Market Share)
- 4.3.3. Question Mark (High Growth, Low Market Share)
- 4.3.4. Dogs (Low Growth, Low Market Share)
- 4.4. Ansoff Matrix Analysis
- 4.5. Supply Chain Analysis
- 4.6. Regulatory Landscape
- 4.7. Current Market Potential and Opportunity Assessment (TAM–SAM–SOM Framework)
- 4.8. VDR Analyst Note
- 4.1. Porters Five Forces
- 5. Market Analysis, Insights and Forecast 2021-2033
- 5.1. Market Analysis, Insights and Forecast - by Component
- 5.1.1. Wires and Cables
- 5.1.2. Connectors and Connector Accessories
- 5.1.3. Terminals and Splices
- 5.1.4. Other Components
- 5.2. Market Analysis, Insights and Forecast - by Platform
- 5.2.1. Aviation
- 5.2.1.1. Military Aviation
- 5.2.1.2. Civil and Commercial Aviation
- 5.2.2. Defense
- 5.2.3. Marine
- 5.2.1. Aviation
- 5.3. Market Analysis, Insights and Forecast - by Region
- 5.3.1. North America
- 5.3.2. Europe
- 5.3.3. Asia Pacific
- 5.3.4. Latin America
- 5.3.5. Middle East and Africa
- 5.1. Market Analysis, Insights and Forecast - by Component
- 6. Global Electric Wiring Interconnection Systems Market Analysis, Insights and Forecast, 2021-2033
- 6.1. Market Analysis, Insights and Forecast - by Component
- 6.1.1. Wires and Cables
- 6.1.2. Connectors and Connector Accessories
- 6.1.3. Terminals and Splices
- 6.1.4. Other Components
- 6.2. Market Analysis, Insights and Forecast - by Platform
- 6.2.1. Aviation
- 6.2.1.1. Military Aviation
- 6.2.1.2. Civil and Commercial Aviation
- 6.2.2. Defense
- 6.2.3. Marine
- 6.2.1. Aviation
- 6.1. Market Analysis, Insights and Forecast - by Component
- 7. North America Electric Wiring Interconnection Systems Market Analysis, Insights and Forecast, 2021-2033
- 7.1. Market Analysis, Insights and Forecast - by Component
- 7.1.1. Wires and Cables
- 7.1.2. Connectors and Connector Accessories
- 7.1.3. Terminals and Splices
- 7.1.4. Other Components
- 7.2. Market Analysis, Insights and Forecast - by Platform
- 7.2.1. Aviation
- 7.2.1.1. Military Aviation
- 7.2.1.2. Civil and Commercial Aviation
- 7.2.2. Defense
- 7.2.3. Marine
- 7.2.1. Aviation
- 7.1. Market Analysis, Insights and Forecast - by Component
- 8. Europe Electric Wiring Interconnection Systems Market Analysis, Insights and Forecast, 2021-2033
- 8.1. Market Analysis, Insights and Forecast - by Component
- 8.1.1. Wires and Cables
- 8.1.2. Connectors and Connector Accessories
- 8.1.3. Terminals and Splices
- 8.1.4. Other Components
- 8.2. Market Analysis, Insights and Forecast - by Platform
- 8.2.1. Aviation
- 8.2.1.1. Military Aviation
- 8.2.1.2. Civil and Commercial Aviation
- 8.2.2. Defense
- 8.2.3. Marine
- 8.2.1. Aviation
- 8.1. Market Analysis, Insights and Forecast - by Component
- 9. Asia Pacific Electric Wiring Interconnection Systems Market Analysis, Insights and Forecast, 2021-2033
- 9.1. Market Analysis, Insights and Forecast - by Component
- 9.1.1. Wires and Cables
- 9.1.2. Connectors and Connector Accessories
- 9.1.3. Terminals and Splices
- 9.1.4. Other Components
- 9.2. Market Analysis, Insights and Forecast - by Platform
- 9.2.1. Aviation
- 9.2.1.1. Military Aviation
- 9.2.1.2. Civil and Commercial Aviation
- 9.2.2. Defense
- 9.2.3. Marine
- 9.2.1. Aviation
- 9.1. Market Analysis, Insights and Forecast - by Component
- 10. Latin America Electric Wiring Interconnection Systems Market Analysis, Insights and Forecast, 2021-2033
- 10.1. Market Analysis, Insights and Forecast - by Component
- 10.1.1. Wires and Cables
- 10.1.2. Connectors and Connector Accessories
- 10.1.3. Terminals and Splices
- 10.1.4. Other Components
- 10.2. Market Analysis, Insights and Forecast - by Platform
- 10.2.1. Aviation
- 10.2.1.1. Military Aviation
- 10.2.1.2. Civil and Commercial Aviation
- 10.2.2. Defense
- 10.2.3. Marine
- 10.2.1. Aviation
- 10.1. Market Analysis, Insights and Forecast - by Component
- 11. Middle East and Africa Electric Wiring Interconnection Systems Market Analysis, Insights and Forecast, 2021-2033
- 11.1. Market Analysis, Insights and Forecast - by Component
- 11.1.1. Wires and Cables
- 11.1.2. Connectors and Connector Accessories
- 11.1.3. Terminals and Splices
- 11.1.4. Other Components
- 11.2. Market Analysis, Insights and Forecast - by Platform
- 11.2.1. Aviation
- 11.2.1.1. Military Aviation
- 11.2.1.2. Civil and Commercial Aviation
- 11.2.2. Defense
- 11.2.3. Marine
- 11.2.1. Aviation
- 11.1. Market Analysis, Insights and Forecast - by Component
- 12. Competitive Analysis
- 12.1. Company Profiles
- 12.1.1 TE Connectivity Ltd
- 12.1.1.1. Company Overview
- 12.1.1.2. Products
- 12.1.1.3. Company Financials
- 12.1.1.4. SWOT Analysis
- 12.1.2 GKN Aerospace Services Limited
- 12.1.2.1. Company Overview
- 12.1.2.2. Products
- 12.1.2.3. Company Financials
- 12.1.2.4. SWOT Analysis
- 12.1.3 Sika Interplant Systems Limited
- 12.1.3.1. Company Overview
- 12.1.3.2. Products
- 12.1.3.3. Company Financials
- 12.1.3.4. SWOT Analysis
- 12.1.4 RTX Corporation
- 12.1.4.1. Company Overview
- 12.1.4.2. Products
- 12.1.4.3. Company Financials
- 12.1.4.4. SWOT Analysis
- 12.1.5 Safran SA
- 12.1.5.1. Company Overview
- 12.1.5.2. Products
- 12.1.5.3. Company Financials
- 12.1.5.4. SWOT Analysis
- 12.1.6 E I S Electronics GmbH
- 12.1.6.1. Company Overview
- 12.1.6.2. Products
- 12.1.6.3. Company Financials
- 12.1.6.4. SWOT Analysis
- 12.1.7 Amphenol Corporation
- 12.1.7.1. Company Overview
- 12.1.7.2. Products
- 12.1.7.3. Company Financials
- 12.1.7.4. SWOT Analysis
- 12.1.8 AMETEK Inc
- 12.1.8.1. Company Overview
- 12.1.8.2. Products
- 12.1.8.3. Company Financials
- 12.1.8.4. SWOT Analysis
- 12.1.9 LATECOERE
- 12.1.9.1. Company Overview
- 12.1.9.2. Products
- 12.1.9.3. Company Financials
- 12.1.9.4. SWOT Analysis
- 12.1.10 Radiall SA
- 12.1.10.1. Company Overview
- 12.1.10.2. Products
- 12.1.10.3. Company Financials
- 12.1.10.4. SWOT Analysis
- 12.1.11 L3Harris Technologies Inc
- 12.1.11.1. Company Overview
- 12.1.11.2. Products
- 12.1.11.3. Company Financials
- 12.1.11.4. SWOT Analysis
- 12.1.12 Smiths Group PL
- 12.1.12.1. Company Overview
- 12.1.12.2. Products
- 12.1.12.3. Company Financials
- 12.1.12.4. SWOT Analysis
- 12.1.1 TE Connectivity Ltd
- 12.2. Market Entropy
- 12.2.1 Company's Key Areas Served
- 12.2.2 Recent Developments
- 12.3. Company Market Share Analysis 2025
- 12.3.1 Top 5 Companies Market Share Analysis
- 12.3.2 Top 3 Companies Market Share Analysis
- 12.4. List of Potential Customers
- 13. Research Methodology
List of Figures
- Figure 1: Global Electric Wiring Interconnection Systems Market Revenue Breakdown (Million, %) by Region 2025 & 2033
- Figure 2: Global Electric Wiring Interconnection Systems Market Volume Breakdown (Billion, %) by Region 2025 & 2033
- Figure 3: North America Electric Wiring Interconnection Systems Market Revenue (Million), by Component 2025 & 2033
- Figure 4: North America Electric Wiring Interconnection Systems Market Volume (Billion), by Component 2025 & 2033
- Figure 5: North America Electric Wiring Interconnection Systems Market Revenue Share (%), by Component 2025 & 2033
- Figure 6: North America Electric Wiring Interconnection Systems Market Volume Share (%), by Component 2025 & 2033
- Figure 7: North America Electric Wiring Interconnection Systems Market Revenue (Million), by Platform 2025 & 2033
- Figure 8: North America Electric Wiring Interconnection Systems Market Volume (Billion), by Platform 2025 & 2033
- Figure 9: North America Electric Wiring Interconnection Systems Market Revenue Share (%), by Platform 2025 & 2033
- Figure 10: North America Electric Wiring Interconnection Systems Market Volume Share (%), by Platform 2025 & 2033
- Figure 11: North America Electric Wiring Interconnection Systems Market Revenue (Million), by Country 2025 & 2033
- Figure 12: North America Electric Wiring Interconnection Systems Market Volume (Billion), by Country 2025 & 2033
- Figure 13: North America Electric Wiring Interconnection Systems Market Revenue Share (%), by Country 2025 & 2033
- Figure 14: North America Electric Wiring Interconnection Systems Market Volume Share (%), by Country 2025 & 2033
- Figure 15: Europe Electric Wiring Interconnection Systems Market Revenue (Million), by Component 2025 & 2033
- Figure 16: Europe Electric Wiring Interconnection Systems Market Volume (Billion), by Component 2025 & 2033
- Figure 17: Europe Electric Wiring Interconnection Systems Market Revenue Share (%), by Component 2025 & 2033
- Figure 18: Europe Electric Wiring Interconnection Systems Market Volume Share (%), by Component 2025 & 2033
- Figure 19: Europe Electric Wiring Interconnection Systems Market Revenue (Million), by Platform 2025 & 2033
- Figure 20: Europe Electric Wiring Interconnection Systems Market Volume (Billion), by Platform 2025 & 2033
- Figure 21: Europe Electric Wiring Interconnection Systems Market Revenue Share (%), by Platform 2025 & 2033
- Figure 22: Europe Electric Wiring Interconnection Systems Market Volume Share (%), by Platform 2025 & 2033
- Figure 23: Europe Electric Wiring Interconnection Systems Market Revenue (Million), by Country 2025 & 2033
- Figure 24: Europe Electric Wiring Interconnection Systems Market Volume (Billion), by Country 2025 & 2033
- Figure 25: Europe Electric Wiring Interconnection Systems Market Revenue Share (%), by Country 2025 & 2033
- Figure 26: Europe Electric Wiring Interconnection Systems Market Volume Share (%), by Country 2025 & 2033
- Figure 27: Asia Pacific Electric Wiring Interconnection Systems Market Revenue (Million), by Component 2025 & 2033
- Figure 28: Asia Pacific Electric Wiring Interconnection Systems Market Volume (Billion), by Component 2025 & 2033
- Figure 29: Asia Pacific Electric Wiring Interconnection Systems Market Revenue Share (%), by Component 2025 & 2033
- Figure 30: Asia Pacific Electric Wiring Interconnection Systems Market Volume Share (%), by Component 2025 & 2033
- Figure 31: Asia Pacific Electric Wiring Interconnection Systems Market Revenue (Million), by Platform 2025 & 2033
- Figure 32: Asia Pacific Electric Wiring Interconnection Systems Market Volume (Billion), by Platform 2025 & 2033
- Figure 33: Asia Pacific Electric Wiring Interconnection Systems Market Revenue Share (%), by Platform 2025 & 2033
- Figure 34: Asia Pacific Electric Wiring Interconnection Systems Market Volume Share (%), by Platform 2025 & 2033
- Figure 35: Asia Pacific Electric Wiring Interconnection Systems Market Revenue (Million), by Country 2025 & 2033
- Figure 36: Asia Pacific Electric Wiring Interconnection Systems Market Volume (Billion), by Country 2025 & 2033
- Figure 37: Asia Pacific Electric Wiring Interconnection Systems Market Revenue Share (%), by Country 2025 & 2033
- Figure 38: Asia Pacific Electric Wiring Interconnection Systems Market Volume Share (%), by Country 2025 & 2033
- Figure 39: Latin America Electric Wiring Interconnection Systems Market Revenue (Million), by Component 2025 & 2033
- Figure 40: Latin America Electric Wiring Interconnection Systems Market Volume (Billion), by Component 2025 & 2033
- Figure 41: Latin America Electric Wiring Interconnection Systems Market Revenue Share (%), by Component 2025 & 2033
- Figure 42: Latin America Electric Wiring Interconnection Systems Market Volume Share (%), by Component 2025 & 2033
- Figure 43: Latin America Electric Wiring Interconnection Systems Market Revenue (Million), by Platform 2025 & 2033
- Figure 44: Latin America Electric Wiring Interconnection Systems Market Volume (Billion), by Platform 2025 & 2033
- Figure 45: Latin America Electric Wiring Interconnection Systems Market Revenue Share (%), by Platform 2025 & 2033
- Figure 46: Latin America Electric Wiring Interconnection Systems Market Volume Share (%), by Platform 2025 & 2033
- Figure 47: Latin America Electric Wiring Interconnection Systems Market Revenue (Million), by Country 2025 & 2033
- Figure 48: Latin America Electric Wiring Interconnection Systems Market Volume (Billion), by Country 2025 & 2033
- Figure 49: Latin America Electric Wiring Interconnection Systems Market Revenue Share (%), by Country 2025 & 2033
- Figure 50: Latin America Electric Wiring Interconnection Systems Market Volume Share (%), by Country 2025 & 2033
- Figure 51: Middle East and Africa Electric Wiring Interconnection Systems Market Revenue (Million), by Component 2025 & 2033
- Figure 52: Middle East and Africa Electric Wiring Interconnection Systems Market Volume (Billion), by Component 2025 & 2033
- Figure 53: Middle East and Africa Electric Wiring Interconnection Systems Market Revenue Share (%), by Component 2025 & 2033
- Figure 54: Middle East and Africa Electric Wiring Interconnection Systems Market Volume Share (%), by Component 2025 & 2033
- Figure 55: Middle East and Africa Electric Wiring Interconnection Systems Market Revenue (Million), by Platform 2025 & 2033
- Figure 56: Middle East and Africa Electric Wiring Interconnection Systems Market Volume (Billion), by Platform 2025 & 2033
- Figure 57: Middle East and Africa Electric Wiring Interconnection Systems Market Revenue Share (%), by Platform 2025 & 2033
- Figure 58: Middle East and Africa Electric Wiring Interconnection Systems Market Volume Share (%), by Platform 2025 & 2033
- Figure 59: Middle East and Africa Electric Wiring Interconnection Systems Market Revenue (Million), by Country 2025 & 2033
- Figure 60: Middle East and Africa Electric Wiring Interconnection Systems Market Volume (Billion), by Country 2025 & 2033
- Figure 61: Middle East and Africa Electric Wiring Interconnection Systems Market Revenue Share (%), by Country 2025 & 2033
- Figure 62: Middle East and Africa Electric Wiring Interconnection Systems Market Volume Share (%), by Country 2025 & 2033
List of Tables
- Table 1: Global Electric Wiring Interconnection Systems Market Revenue Million Forecast, by Component 2020 & 2033
- Table 2: Global Electric Wiring Interconnection Systems Market Volume Billion Forecast, by Component 2020 & 2033
- Table 3: Global Electric Wiring Interconnection Systems Market Revenue Million Forecast, by Platform 2020 & 2033
- Table 4: Global Electric Wiring Interconnection Systems Market Volume Billion Forecast, by Platform 2020 & 2033
- Table 5: Global Electric Wiring Interconnection Systems Market Revenue Million Forecast, by Region 2020 & 2033
- Table 6: Global Electric Wiring Interconnection Systems Market Volume Billion Forecast, by Region 2020 & 2033
- Table 7: Global Electric Wiring Interconnection Systems Market Revenue Million Forecast, by Component 2020 & 2033
- Table 8: Global Electric Wiring Interconnection Systems Market Volume Billion Forecast, by Component 2020 & 2033
- Table 9: Global Electric Wiring Interconnection Systems Market Revenue Million Forecast, by Platform 2020 & 2033
- Table 10: Global Electric Wiring Interconnection Systems Market Volume Billion Forecast, by Platform 2020 & 2033
- Table 11: Global Electric Wiring Interconnection Systems Market Revenue Million Forecast, by Country 2020 & 2033
- Table 12: Global Electric Wiring Interconnection Systems Market Volume Billion Forecast, by Country 2020 & 2033
- Table 13: United States Electric Wiring Interconnection Systems Market Revenue (Million) Forecast, by Application 2020 & 2033
- Table 14: United States Electric Wiring Interconnection Systems Market Volume (Billion) Forecast, by Application 2020 & 2033
- Table 15: Canada Electric Wiring Interconnection Systems Market Revenue (Million) Forecast, by Application 2020 & 2033
- Table 16: Canada Electric Wiring Interconnection Systems Market Volume (Billion) Forecast, by Application 2020 & 2033
- Table 17: Global Electric Wiring Interconnection Systems Market Revenue Million Forecast, by Component 2020 & 2033
- Table 18: Global Electric Wiring Interconnection Systems Market Volume Billion Forecast, by Component 2020 & 2033
- Table 19: Global Electric Wiring Interconnection Systems Market Revenue Million Forecast, by Platform 2020 & 2033
- Table 20: Global Electric Wiring Interconnection Systems Market Volume Billion Forecast, by Platform 2020 & 2033
- Table 21: Global Electric Wiring Interconnection Systems Market Revenue Million Forecast, by Country 2020 & 2033
- Table 22: Global Electric Wiring Interconnection Systems Market Volume Billion Forecast, by Country 2020 & 2033
- Table 23: United Kingdom Electric Wiring Interconnection Systems Market Revenue (Million) Forecast, by Application 2020 & 2033
- Table 24: United Kingdom Electric Wiring Interconnection Systems Market Volume (Billion) Forecast, by Application 2020 & 2033
- Table 25: Germany Electric Wiring Interconnection Systems Market Revenue (Million) Forecast, by Application 2020 & 2033
- Table 26: Germany Electric Wiring Interconnection Systems Market Volume (Billion) Forecast, by Application 2020 & 2033
- Table 27: France Electric Wiring Interconnection Systems Market Revenue (Million) Forecast, by Application 2020 & 2033
- Table 28: France Electric Wiring Interconnection Systems Market Volume (Billion) Forecast, by Application 2020 & 2033
- Table 29: Russia Electric Wiring Interconnection Systems Market Revenue (Million) Forecast, by Application 2020 & 2033
- Table 30: Russia Electric Wiring Interconnection Systems Market Volume (Billion) Forecast, by Application 2020 & 2033
- Table 31: Rest of Europe Electric Wiring Interconnection Systems Market Revenue (Million) Forecast, by Application 2020 & 2033
- Table 32: Rest of Europe Electric Wiring Interconnection Systems Market Volume (Billion) Forecast, by Application 2020 & 2033
- Table 33: Global Electric Wiring Interconnection Systems Market Revenue Million Forecast, by Component 2020 & 2033
- Table 34: Global Electric Wiring Interconnection Systems Market Volume Billion Forecast, by Component 2020 & 2033
- Table 35: Global Electric Wiring Interconnection Systems Market Revenue Million Forecast, by Platform 2020 & 2033
- Table 36: Global Electric Wiring Interconnection Systems Market Volume Billion Forecast, by Platform 2020 & 2033
- Table 37: Global Electric Wiring Interconnection Systems Market Revenue Million Forecast, by Country 2020 & 2033
- Table 38: Global Electric Wiring Interconnection Systems Market Volume Billion Forecast, by Country 2020 & 2033
- Table 39: China Electric Wiring Interconnection Systems Market Revenue (Million) Forecast, by Application 2020 & 2033
- Table 40: China Electric Wiring Interconnection Systems Market Volume (Billion) Forecast, by Application 2020 & 2033
- Table 41: India Electric Wiring Interconnection Systems Market Revenue (Million) Forecast, by Application 2020 & 2033
- Table 42: India Electric Wiring Interconnection Systems Market Volume (Billion) Forecast, by Application 2020 & 2033
- Table 43: Japan Electric Wiring Interconnection Systems Market Revenue (Million) Forecast, by Application 2020 & 2033
- Table 44: Japan Electric Wiring Interconnection Systems Market Volume (Billion) Forecast, by Application 2020 & 2033
- Table 45: South Korea Electric Wiring Interconnection Systems Market Revenue (Million) Forecast, by Application 2020 & 2033
- Table 46: South Korea Electric Wiring Interconnection Systems Market Volume (Billion) Forecast, by Application 2020 & 2033
- Table 47: Rest of Asia Pacific Electric Wiring Interconnection Systems Market Revenue (Million) Forecast, by Application 2020 & 2033
- Table 48: Rest of Asia Pacific Electric Wiring Interconnection Systems Market Volume (Billion) Forecast, by Application 2020 & 2033
- Table 49: Global Electric Wiring Interconnection Systems Market Revenue Million Forecast, by Component 2020 & 2033
- Table 50: Global Electric Wiring Interconnection Systems Market Volume Billion Forecast, by Component 2020 & 2033
- Table 51: Global Electric Wiring Interconnection Systems Market Revenue Million Forecast, by Platform 2020 & 2033
- Table 52: Global Electric Wiring Interconnection Systems Market Volume Billion Forecast, by Platform 2020 & 2033
- Table 53: Global Electric Wiring Interconnection Systems Market Revenue Million Forecast, by Country 2020 & 2033
- Table 54: Global Electric Wiring Interconnection Systems Market Volume Billion Forecast, by Country 2020 & 2033
- Table 55: Brazil Electric Wiring Interconnection Systems Market Revenue (Million) Forecast, by Application 2020 & 2033
- Table 56: Brazil Electric Wiring Interconnection Systems Market Volume (Billion) Forecast, by Application 2020 & 2033
- Table 57: Rest of Latin America Electric Wiring Interconnection Systems Market Revenue (Million) Forecast, by Application 2020 & 2033
- Table 58: Rest of Latin America Electric Wiring Interconnection Systems Market Volume (Billion) Forecast, by Application 2020 & 2033
- Table 59: Global Electric Wiring Interconnection Systems Market Revenue Million Forecast, by Component 2020 & 2033
- Table 60: Global Electric Wiring Interconnection Systems Market Volume Billion Forecast, by Component 2020 & 2033
- Table 61: Global Electric Wiring Interconnection Systems Market Revenue Million Forecast, by Platform 2020 & 2033
- Table 62: Global Electric Wiring Interconnection Systems Market Volume Billion Forecast, by Platform 2020 & 2033
- Table 63: Global Electric Wiring Interconnection Systems Market Revenue Million Forecast, by Country 2020 & 2033
- Table 64: Global Electric Wiring Interconnection Systems Market Volume Billion Forecast, by Country 2020 & 2033
- Table 65: United Arab Emirates Electric Wiring Interconnection Systems Market Revenue (Million) Forecast, by Application 2020 & 2033
- Table 66: United Arab Emirates Electric Wiring Interconnection Systems Market Volume (Billion) Forecast, by Application 2020 & 2033
- Table 67: Saudi Arabia Electric Wiring Interconnection Systems Market Revenue (Million) Forecast, by Application 2020 & 2033
- Table 68: Saudi Arabia Electric Wiring Interconnection Systems Market Volume (Billion) Forecast, by Application 2020 & 2033
- Table 69: Egypt Electric Wiring Interconnection Systems Market Revenue (Million) Forecast, by Application 2020 & 2033
- Table 70: Egypt Electric Wiring Interconnection Systems Market Volume (Billion) Forecast, by Application 2020 & 2033
- Table 71: Rest of Middle East and Africa Electric Wiring Interconnection Systems Market Revenue (Million) Forecast, by Application 2020 & 2033
- Table 72: Rest of Middle East and Africa Electric Wiring Interconnection Systems Market Volume (Billion) Forecast, by Application 2020 & 2033
Frequently Asked Questions
1. What is the projected Compound Annual Growth Rate (CAGR) of the Electric Wiring Interconnection Systems Market?
The projected CAGR is approximately 5.46%.
2. Which companies are prominent players in the Electric Wiring Interconnection Systems Market?
Key companies in the market include TE Connectivity Ltd, GKN Aerospace Services Limited, Sika Interplant Systems Limited, RTX Corporation, Safran SA, E I S Electronics GmbH, Amphenol Corporation, AMETEK Inc, LATECOERE, Radiall SA, L3Harris Technologies Inc, Smiths Group PL.
3. What are the main segments of the Electric Wiring Interconnection Systems Market?
The market segments include Component, Platform.
4. Can you provide details about the market size?
The market size is estimated to be USD 9.77 Million as of 2022.
5. What are some drivers contributing to market growth?
N/A
6. What are the notable trends driving market growth?
The Defense Segment is Expected to Showcase Remarkable Growth During the Forecast Period.
7. Are there any restraints impacting market growth?
N/A
8. Can you provide examples of recent developments in the market?
May 2024: GKN Aerospace reached an important milestone in its collaboration with Eviation (United States) by delivering the first fully integrated wings, empennage, and EWIS for the Alice all-electric aircraft. The wings and empennage featured advanced composite technology and were the first fully integrated structures offered by GKN Aerospace.
9. What pricing options are available for accessing the report?
Pricing options include single-user, multi-user, and enterprise licenses priced at USD 4750, USD 5250, and USD 8750 respectively.
10. Is the market size provided in terms of value or volume?
The market size is provided in terms of value, measured in Million and volume, measured in Billion.
11. Are there any specific market keywords associated with the report?
Yes, the market keyword associated with the report is "Electric Wiring Interconnection Systems Market," which aids in identifying and referencing the specific market segment covered.
12. How do I determine which pricing option suits my needs best?
The pricing options vary based on user requirements and access needs. Individual users may opt for single-user licenses, while businesses requiring broader access may choose multi-user or enterprise licenses for cost-effective access to the report.
13. Are there any additional resources or data provided in the Electric Wiring Interconnection Systems Market report?
While the report offers comprehensive insights, it's advisable to review the specific contents or supplementary materials provided to ascertain if additional resources or data are available.
14. How can I stay updated on further developments or reports in the Electric Wiring Interconnection Systems Market?
To stay informed about further developments, trends, and reports in the Electric Wiring Interconnection Systems Market, consider subscribing to industry newsletters, following relevant companies and organizations, or regularly checking reputable industry news sources and publications.
Methodology
Step 1 - Identification of Relevant Samples Size from Population Database


Step 2 - Approaches for Defining Global Market Size (Value, Volume* & Price*)

Note*: In applicable scenarios
Step 3 - Data Sources
Primary Research
- Web Analytics
- Survey Reports
- Research Institute
- Latest Research Reports
- Opinion Leaders
Secondary Research
- Annual Reports
- White Paper
- Latest Press Release
- Industry Association
- Paid Database
- Investor Presentations

Step 4 - Data Triangulation
Involves using different sources of information in order to increase the validity of a study
These sources are likely to be stakeholders in a program - participants, other researchers, program staff, other community members, and so on.
Then we put all data in single framework & apply various statistical tools to find out the dynamic on the market.
During the analysis stage, feedback from the stakeholder groups would be compared to determine areas of agreement as well as areas of divergence