

Key Insights
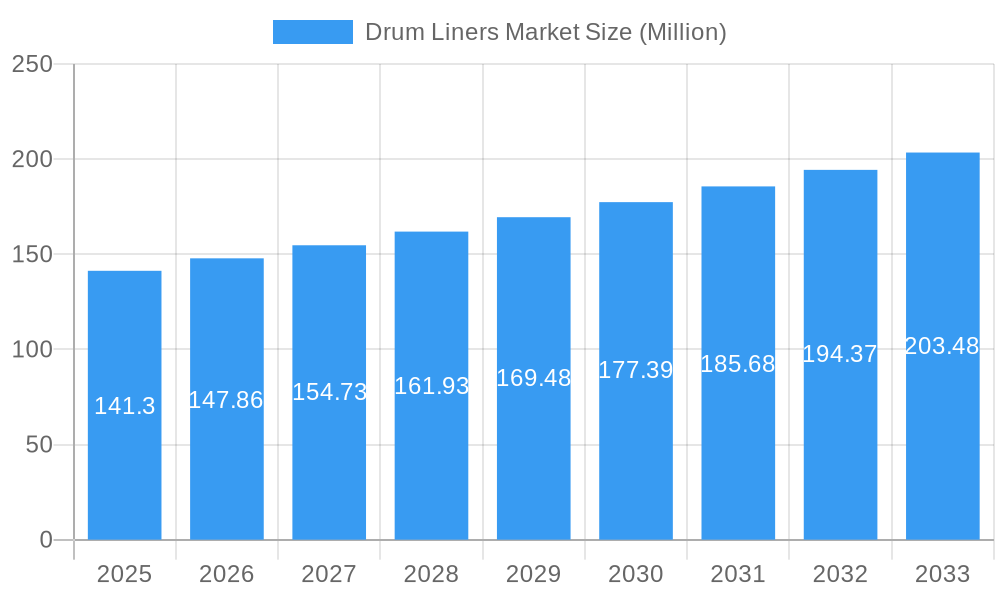
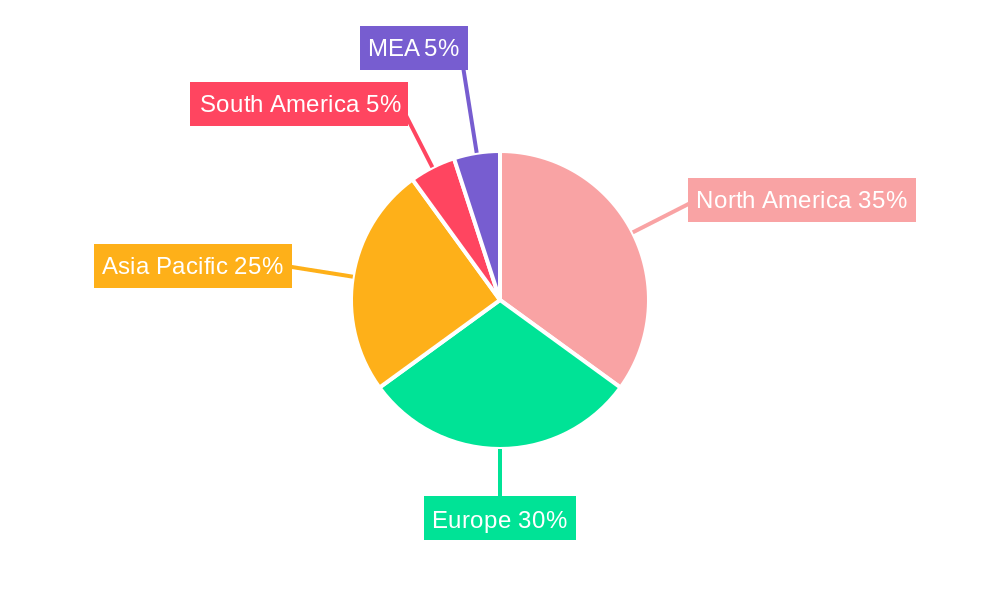
The global drum liners market, valued at $141.30 million in 2025, is projected to experience robust growth, driven by the increasing demand for efficient and safe packaging solutions across diverse industries. A Compound Annual Growth Rate (CAGR) of 4.67% from 2025 to 2033 indicates a significant expansion of the market, fueled by several key factors. The rising adoption of drum liners in the chemical and flammable materials sector, owing to stringent safety regulations and the need for leak-proof packaging, is a major driver. Furthermore, the growth of the food and beverage industry, coupled with the need for extended shelf life and product preservation, contributes significantly to market expansion. The market segmentation reveals that shrink liners and round bottom liners dominate the product type category, while the flexible packaging type holds a larger share in terms of packaging preference. Geographically, North America and Europe are currently leading the market, driven by established industrial sectors and robust regulatory frameworks. However, the Asia-Pacific region presents significant growth opportunities due to rapid industrialization and rising demand from emerging economies. Competition in the market is intense, with major players such as Greif, Terdex, and Bemis Company continuously innovating and expanding their product portfolios to meet evolving customer needs and preferences.
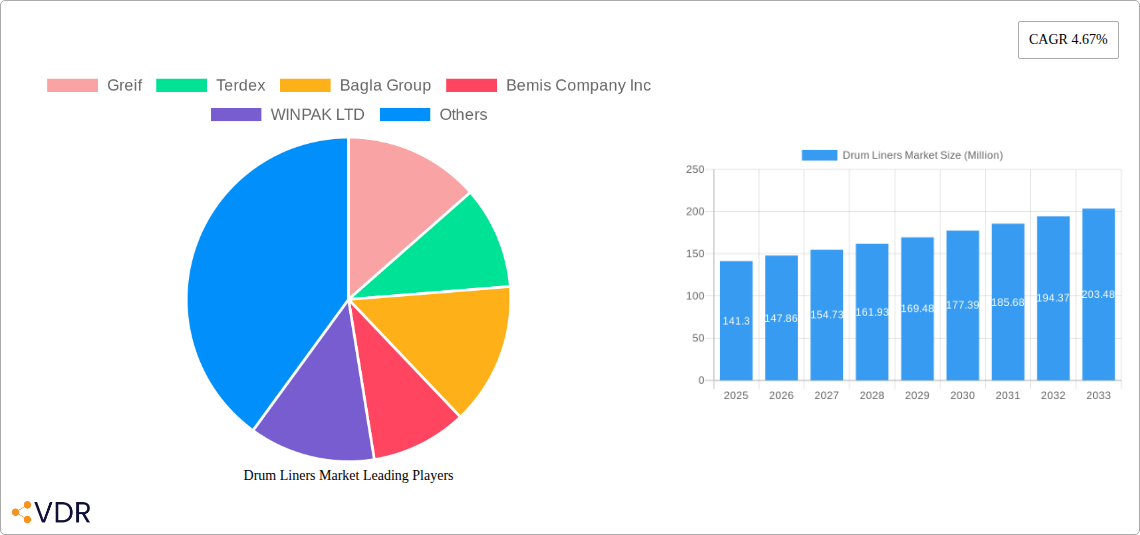
Drum Liners Market Market Size (In Million)
The continued growth of the drum liners market is expected to be influenced by ongoing advancements in liner materials and manufacturing processes. The development of eco-friendly and sustainable liner options, such as biodegradable and recyclable materials, will become increasingly crucial to meet growing environmental concerns. Moreover, technological advancements in automated packaging systems are likely to boost efficiency and reduce costs, further stimulating market expansion. Despite these positive drivers, factors like fluctuating raw material prices and the potential for alternative packaging solutions could pose challenges to market growth. Nevertheless, the overall outlook for the drum liners market remains positive, with significant opportunities for established players and new entrants alike to capitalize on the expanding demand for safe, efficient, and sustainable packaging solutions.
Drum Liners Market Company Market Share
Drum Liners Market: A Comprehensive Market Report (2019-2033)
This comprehensive report provides an in-depth analysis of the global Drum Liners Market, encompassing market dynamics, growth trends, regional dominance, product landscape, key players, and future outlook. The study period covers 2019-2033, with 2025 as the base year and a forecast period of 2025-2033. The report segments the market by product type (Shrink Liner, Round Bottom Liner, Flat Bottom Liner, Others), packaging type (Flexible, Rigid, Semi-Rigid), and end-user (Chemicals and Flammables, Adhesives, Inks and Coatings, Food Products, Others). The market size is valued in million units.
Drum Liners Market Dynamics & Structure
The Drum Liners Market is characterized by moderate concentration, with key players like Greif, Berry Global, and Sealed Air holding significant market share. Technological innovations, particularly in materials science and automation, are driving market growth. Stringent regulatory frameworks concerning hazardous material packaging influence product design and manufacturing processes. Competitive substitutes, such as alternative packaging solutions, pose a challenge, while the growth of the chemicals and food industries fuels market demand. Mergers and acquisitions (M&A) activity is impacting market consolidation. The past five years witnessed xx M&A deals, with an average deal value of xx million units.
- Market Concentration: Moderately concentrated, with top 5 players holding approximately xx% market share in 2024.
- Technological Innovation: Focus on sustainable materials (e.g., biodegradable liners), improved barrier properties, and automated production processes.
- Regulatory Framework: Compliance with regulations on hazardous material packaging is a key driver and challenge.
- Competitive Substitutes: Alternative packaging solutions, such as bulk containers and IBCs, create competitive pressure.
- End-User Demographics: Growth is driven by increasing demand from the chemicals, food, and adhesives industries.
- M&A Trends: Consolidation is evident through acquisitions like Greif's increased stake in Centurion Container.
Drum Liners Market Growth Trends & Insights
The Drum Liners Market exhibited a CAGR of xx% during the historical period (2019-2024) and is projected to grow at a CAGR of xx% during the forecast period (2025-2033), reaching a market size of xx million units by 2033. Increased adoption of drum liners across various end-use sectors, driven by the need for safe and efficient packaging of diverse materials, is the primary growth driver. Technological advancements, like the introduction of high-barrier liners and improved sealing technologies, are enhancing product performance and driving market penetration. Consumer behavior shifts towards sustainable and eco-friendly packaging are also influencing market trends. This includes a growing preference for recyclable and biodegradable liner materials. Regional variations in growth rates are influenced by economic factors, industrial output, and regulatory landscape. The market penetration rate for drum liners in emerging economies is expected to increase significantly in the coming years. Demand from the chemical industry is expected to remain a key driver, accounting for xx% of total market demand by 2033.
Dominant Regions, Countries, or Segments in Drum Liners Market
North America and Europe currently dominate the Drum Liners Market, accounting for xx% and xx% of the global market share respectively in 2024. However, the Asia-Pacific region is expected to witness the fastest growth in the coming years, driven by rapid industrialization and increasing demand from emerging economies like China and India. Within product types, Shrink Liners hold the largest market share, followed by Round Bottom Liners, due to their versatility and suitability for diverse applications. The Chemicals and Flammables end-use segment shows the highest demand, reflecting stringent safety regulations for hazardous materials.
- Key Drivers: Strong industrial growth in Asia-Pacific, stringent regulatory compliance in North America and Europe, increasing demand for safe packaging of chemicals and food products.
- Dominance Factors: Established manufacturing base in North America and Europe, cost-effective manufacturing in Asia-Pacific.
- Growth Potential: Significant growth potential in emerging markets due to increasing industrial activity and rising disposable incomes.
Drum Liners Market Product Landscape
Drum liners are constantly evolving to meet the diverse needs of various industries. Innovations focus on improved barrier properties, enhanced sealing mechanisms, and the use of sustainable materials like biodegradable polymers. This allows for better protection of contents and improved environmental sustainability. Product differentiation strategies often involve focusing on specific industry needs (e.g., liners for corrosive chemicals or food-grade liners) and offering customized solutions. Advancements in coating technologies and improved material strength are key performance metrics.
Key Drivers, Barriers & Challenges in Drum Liners Market
Key Drivers: Growing demand from various end-use industries (chemicals, food, etc.), stringent regulations promoting safer packaging, technological advancements leading to improved performance and sustainability.
Challenges: Fluctuations in raw material prices, competition from alternative packaging solutions, concerns about environmental impact of liner disposal, supply chain disruptions impacting production and delivery. The impact of these challenges can be quantified through xx% increase in production costs due to raw material price volatility and xx% decrease in sales due to supply chain disruptions in 2024.
Emerging Opportunities in Drum Liners Market
Emerging opportunities include the increasing demand for sustainable and eco-friendly liners made from recycled or biodegradable materials. Furthermore, there is potential growth in niche applications requiring specialized liners with unique barrier properties for sensitive products. Untapped markets in developing economies and the increasing adoption of drum liners in new industries like pharmaceuticals offer further expansion opportunities.
Growth Accelerators in the Drum Liners Market Industry
Technological breakthroughs in material science, enabling the development of high-performance, sustainable liners, are key growth accelerators. Strategic partnerships and collaborations among liner manufacturers, raw material suppliers, and end-users are improving supply chain efficiency and fostering innovation. Market expansion strategies focusing on emerging economies and new applications are broadening the market reach and driving long-term growth.
Key Players Shaping the Drum Liners Market Market
- Greif
- Terdex
- Bagla Group
- Bemis Company Inc
- WINPAK LTD
- Shenyang Weiming Technology Co Ltd
- Bollore Group
- Intertape Polymer Ltd
- Berry Global Inc
- Sealed Air
Notable Milestones in Drum Liners Market Sector
- February 2024: Berry Global's merger with Glatfelter Corporation (USD 3.6 billion), creating a larger player in the packaging sector and potentially impacting market share.
- April 2023: Greif Inc.'s acquisition of a majority stake in Centurion Container LLC (USD 145 million), strengthening its position in the market.
In-Depth Drum Liners Market Market Outlook
The Drum Liners Market is poised for sustained growth, driven by increasing demand from various industries, technological advancements, and strategic market expansion. Opportunities lie in developing innovative, sustainable products catering to evolving consumer preferences and tapping into emerging markets. Companies focusing on strategic partnerships, technological innovation, and sustainable practices are well-positioned to capitalize on the future market potential.
Drum Liners Market Segmentation
-
1. Product Type
- 1.1. Shrink Liner
- 1.2. Round Bottom Liner
- 1.3. Flat Bottom Liner
- 1.4. Others
-
2. Packaging Type
- 2.1. Flexible
- 2.2. Rigid
- 2.3. Semi-Rigid
-
3. End User
- 3.1. Chemicals and Flammables
- 3.2. Adhesives
- 3.3. Inks and Coatings
- 3.4. Food Products
- 3.5. Others
- 4. Geography
-
5. North America
- 5.1. United States
- 5.2. Canada
- 5.3. Rest of North America
-
6. Europe
- 6.1. United Kingdom
- 6.2. Germany
- 6.3. France
- 6.4. Russia
- 6.5. Italy
- 6.6. Spain
- 6.7. Rest of Europe
-
7. Asia-Pacific
- 7.1. India
- 7.2. China
- 7.3. Japan
- 7.4. Australia
- 7.5. Rest of Asia-Pacific
-
8. South America
- 8.1. Brazil
- 8.2. Argentina
- 8.3. Rest of South America
-
9. Middle-East and Africa
- 9.1. United Arab Emirates
- 9.2. South Africa
- 9.3. Rest of Middle-East and Africa
Drum Liners Market Segmentation By Geography
-
1. North America
- 1.1. United States
- 1.2. Canada
- 1.3. Mexico
-
2. South America
- 2.1. Brazil
- 2.2. Argentina
- 2.3. Rest of South America
-
3. Europe
- 3.1. United Kingdom
- 3.2. Germany
- 3.3. France
- 3.4. Italy
- 3.5. Spain
- 3.6. Russia
- 3.7. Benelux
- 3.8. Nordics
- 3.9. Rest of Europe
-
4. Middle East & Africa
- 4.1. Turkey
- 4.2. Israel
- 4.3. GCC
- 4.4. North Africa
- 4.5. South Africa
- 4.6. Rest of Middle East & Africa
-
5. Asia Pacific
- 5.1. China
- 5.2. India
- 5.3. Japan
- 5.4. South Korea
- 5.5. ASEAN
- 5.6. Oceania
- 5.7. Rest of Asia Pacific
Drum Liners Market Regional Market Share
Geographic Coverage of Drum Liners Market
Drum Liners Market REPORT HIGHLIGHTS
| Aspects | Details |
|---|---|
| Study Period | 2020-2034 |
| Base Year | 2025 |
| Estimated Year | 2026 |
| Forecast Period | 2026-2034 |
| Historical Period | 2020-2025 |
| Growth Rate | CAGR of 6.2% from 2020-2034 |
| Segmentation |
|
Table of Contents
- 1. Introduction
- 1.1. Research Scope
- 1.2. Market Segmentation
- 1.3. Research Objective
- 1.4. Definitions and Assumptions
- 2. Executive Summary
- 2.1. Market Snapshot
- 3. Market Dynamics
- 3.1. Market Drivers
- 3.2. Market Restrains
- 3.3. Market Trends
- 3.4. Market Opportunities
- 4. Market Factor Analysis
- 4.1. Porters Five Forces
- 4.1.1. Bargaining Power of Suppliers
- 4.1.2. Bargaining Power of Buyers
- 4.1.3. Threat of New Entrants
- 4.1.4. Threat of Substitutes
- 4.1.5. Competitive Rivalry
- 4.2. PESTEL analysis
- 4.3. BCG Analysis
- 4.3.1. Stars (High Growth, High Market Share)
- 4.3.2. Cash Cows (Low Growth, High Market Share)
- 4.3.3. Question Mark (High Growth, Low Market Share)
- 4.3.4. Dogs (Low Growth, Low Market Share)
- 4.4. Ansoff Matrix Analysis
- 4.5. Supply Chain Analysis
- 4.6. Regulatory Landscape
- 4.7. Current Market Potential and Opportunity Assessment (TAM–SAM–SOM Framework)
- 4.8. VDR Analyst Note
- 4.1. Porters Five Forces
- 5. Market Analysis, Insights and Forecast 2021-2033
- 5.1. Market Analysis, Insights and Forecast - by Product Type
- 5.1.1. Shrink Liner
- 5.1.2. Round Bottom Liner
- 5.1.3. Flat Bottom Liner
- 5.1.4. Others
- 5.2. Market Analysis, Insights and Forecast - by Packaging Type
- 5.2.1. Flexible
- 5.2.2. Rigid
- 5.2.3. Semi-Rigid
- 5.3. Market Analysis, Insights and Forecast - by End User
- 5.3.1. Chemicals and Flammables
- 5.3.2. Adhesives
- 5.3.3. Inks and Coatings
- 5.3.4. Food Products
- 5.3.5. Others
- 5.4. Market Analysis, Insights and Forecast - by Geography
- 5.5. Market Analysis, Insights and Forecast - by North America
- 5.5.1. United States
- 5.5.2. Canada
- 5.5.3. Rest of North America
- 5.6. Market Analysis, Insights and Forecast - by Europe
- 5.6.1. United Kingdom
- 5.6.2. Germany
- 5.6.3. France
- 5.6.4. Russia
- 5.6.5. Italy
- 5.6.6. Spain
- 5.6.7. Rest of Europe
- 5.7. Market Analysis, Insights and Forecast - by Asia-Pacific
- 5.7.1. India
- 5.7.2. China
- 5.7.3. Japan
- 5.7.4. Australia
- 5.7.5. Rest of Asia-Pacific
- 5.8. Market Analysis, Insights and Forecast - by South America
- 5.8.1. Brazil
- 5.8.2. Argentina
- 5.8.3. Rest of South America
- 5.9. Market Analysis, Insights and Forecast - by Middle-East and Africa
- 5.9.1. United Arab Emirates
- 5.9.2. South Africa
- 5.9.3. Rest of Middle-East and Africa
- 5.10. Market Analysis, Insights and Forecast - by Region
- 5.10.1. North America
- 5.10.2. South America
- 5.10.3. Europe
- 5.10.4. Middle East & Africa
- 5.10.5. Asia Pacific
- 5.1. Market Analysis, Insights and Forecast - by Product Type
- 6. Global Drum Liners Market Analysis, Insights and Forecast, 2021-2033
- 6.1. Market Analysis, Insights and Forecast - by Product Type
- 6.1.1. Shrink Liner
- 6.1.2. Round Bottom Liner
- 6.1.3. Flat Bottom Liner
- 6.1.4. Others
- 6.2. Market Analysis, Insights and Forecast - by Packaging Type
- 6.2.1. Flexible
- 6.2.2. Rigid
- 6.2.3. Semi-Rigid
- 6.3. Market Analysis, Insights and Forecast - by End User
- 6.3.1. Chemicals and Flammables
- 6.3.2. Adhesives
- 6.3.3. Inks and Coatings
- 6.3.4. Food Products
- 6.3.5. Others
- 6.4. Market Analysis, Insights and Forecast - by Geography
- 6.5. Market Analysis, Insights and Forecast - by North America
- 6.5.1. United States
- 6.5.2. Canada
- 6.5.3. Rest of North America
- 6.6. Market Analysis, Insights and Forecast - by Europe
- 6.6.1. United Kingdom
- 6.6.2. Germany
- 6.6.3. France
- 6.6.4. Russia
- 6.6.5. Italy
- 6.6.6. Spain
- 6.6.7. Rest of Europe
- 6.7. Market Analysis, Insights and Forecast - by Asia-Pacific
- 6.7.1. India
- 6.7.2. China
- 6.7.3. Japan
- 6.7.4. Australia
- 6.7.5. Rest of Asia-Pacific
- 6.8. Market Analysis, Insights and Forecast - by South America
- 6.8.1. Brazil
- 6.8.2. Argentina
- 6.8.3. Rest of South America
- 6.9. Market Analysis, Insights and Forecast - by Middle-East and Africa
- 6.9.1. United Arab Emirates
- 6.9.2. South Africa
- 6.9.3. Rest of Middle-East and Africa
- 6.1. Market Analysis, Insights and Forecast - by Product Type
- 7. North America Drum Liners Market Analysis, Insights and Forecast, 2021-2033
- 7.1. Market Analysis, Insights and Forecast - by Product Type
- 7.1.1. Shrink Liner
- 7.1.2. Round Bottom Liner
- 7.1.3. Flat Bottom Liner
- 7.1.4. Others
- 7.2. Market Analysis, Insights and Forecast - by Packaging Type
- 7.2.1. Flexible
- 7.2.2. Rigid
- 7.2.3. Semi-Rigid
- 7.3. Market Analysis, Insights and Forecast - by End User
- 7.3.1. Chemicals and Flammables
- 7.3.2. Adhesives
- 7.3.3. Inks and Coatings
- 7.3.4. Food Products
- 7.3.5. Others
- 7.4. Market Analysis, Insights and Forecast - by Geography
- 7.5. Market Analysis, Insights and Forecast - by North America
- 7.5.1. United States
- 7.5.2. Canada
- 7.5.3. Rest of North America
- 7.6. Market Analysis, Insights and Forecast - by Europe
- 7.6.1. United Kingdom
- 7.6.2. Germany
- 7.6.3. France
- 7.6.4. Russia
- 7.6.5. Italy
- 7.6.6. Spain
- 7.6.7. Rest of Europe
- 7.7. Market Analysis, Insights and Forecast - by Asia-Pacific
- 7.7.1. India
- 7.7.2. China
- 7.7.3. Japan
- 7.7.4. Australia
- 7.7.5. Rest of Asia-Pacific
- 7.8. Market Analysis, Insights and Forecast - by South America
- 7.8.1. Brazil
- 7.8.2. Argentina
- 7.8.3. Rest of South America
- 7.9. Market Analysis, Insights and Forecast - by Middle-East and Africa
- 7.9.1. United Arab Emirates
- 7.9.2. South Africa
- 7.9.3. Rest of Middle-East and Africa
- 7.1. Market Analysis, Insights and Forecast - by Product Type
- 8. South America Drum Liners Market Analysis, Insights and Forecast, 2021-2033
- 8.1. Market Analysis, Insights and Forecast - by Product Type
- 8.1.1. Shrink Liner
- 8.1.2. Round Bottom Liner
- 8.1.3. Flat Bottom Liner
- 8.1.4. Others
- 8.2. Market Analysis, Insights and Forecast - by Packaging Type
- 8.2.1. Flexible
- 8.2.2. Rigid
- 8.2.3. Semi-Rigid
- 8.3. Market Analysis, Insights and Forecast - by End User
- 8.3.1. Chemicals and Flammables
- 8.3.2. Adhesives
- 8.3.3. Inks and Coatings
- 8.3.4. Food Products
- 8.3.5. Others
- 8.4. Market Analysis, Insights and Forecast - by Geography
- 8.5. Market Analysis, Insights and Forecast - by North America
- 8.5.1. United States
- 8.5.2. Canada
- 8.5.3. Rest of North America
- 8.6. Market Analysis, Insights and Forecast - by Europe
- 8.6.1. United Kingdom
- 8.6.2. Germany
- 8.6.3. France
- 8.6.4. Russia
- 8.6.5. Italy
- 8.6.6. Spain
- 8.6.7. Rest of Europe
- 8.7. Market Analysis, Insights and Forecast - by Asia-Pacific
- 8.7.1. India
- 8.7.2. China
- 8.7.3. Japan
- 8.7.4. Australia
- 8.7.5. Rest of Asia-Pacific
- 8.8. Market Analysis, Insights and Forecast - by South America
- 8.8.1. Brazil
- 8.8.2. Argentina
- 8.8.3. Rest of South America
- 8.9. Market Analysis, Insights and Forecast - by Middle-East and Africa
- 8.9.1. United Arab Emirates
- 8.9.2. South Africa
- 8.9.3. Rest of Middle-East and Africa
- 8.1. Market Analysis, Insights and Forecast - by Product Type
- 9. Europe Drum Liners Market Analysis, Insights and Forecast, 2021-2033
- 9.1. Market Analysis, Insights and Forecast - by Product Type
- 9.1.1. Shrink Liner
- 9.1.2. Round Bottom Liner
- 9.1.3. Flat Bottom Liner
- 9.1.4. Others
- 9.2. Market Analysis, Insights and Forecast - by Packaging Type
- 9.2.1. Flexible
- 9.2.2. Rigid
- 9.2.3. Semi-Rigid
- 9.3. Market Analysis, Insights and Forecast - by End User
- 9.3.1. Chemicals and Flammables
- 9.3.2. Adhesives
- 9.3.3. Inks and Coatings
- 9.3.4. Food Products
- 9.3.5. Others
- 9.4. Market Analysis, Insights and Forecast - by Geography
- 9.5. Market Analysis, Insights and Forecast - by North America
- 9.5.1. United States
- 9.5.2. Canada
- 9.5.3. Rest of North America
- 9.6. Market Analysis, Insights and Forecast - by Europe
- 9.6.1. United Kingdom
- 9.6.2. Germany
- 9.6.3. France
- 9.6.4. Russia
- 9.6.5. Italy
- 9.6.6. Spain
- 9.6.7. Rest of Europe
- 9.7. Market Analysis, Insights and Forecast - by Asia-Pacific
- 9.7.1. India
- 9.7.2. China
- 9.7.3. Japan
- 9.7.4. Australia
- 9.7.5. Rest of Asia-Pacific
- 9.8. Market Analysis, Insights and Forecast - by South America
- 9.8.1. Brazil
- 9.8.2. Argentina
- 9.8.3. Rest of South America
- 9.9. Market Analysis, Insights and Forecast - by Middle-East and Africa
- 9.9.1. United Arab Emirates
- 9.9.2. South Africa
- 9.9.3. Rest of Middle-East and Africa
- 9.1. Market Analysis, Insights and Forecast - by Product Type
- 10. Middle East & Africa Drum Liners Market Analysis, Insights and Forecast, 2021-2033
- 10.1. Market Analysis, Insights and Forecast - by Product Type
- 10.1.1. Shrink Liner
- 10.1.2. Round Bottom Liner
- 10.1.3. Flat Bottom Liner
- 10.1.4. Others
- 10.2. Market Analysis, Insights and Forecast - by Packaging Type
- 10.2.1. Flexible
- 10.2.2. Rigid
- 10.2.3. Semi-Rigid
- 10.3. Market Analysis, Insights and Forecast - by End User
- 10.3.1. Chemicals and Flammables
- 10.3.2. Adhesives
- 10.3.3. Inks and Coatings
- 10.3.4. Food Products
- 10.3.5. Others
- 10.4. Market Analysis, Insights and Forecast - by Geography
- 10.5. Market Analysis, Insights and Forecast - by North America
- 10.5.1. United States
- 10.5.2. Canada
- 10.5.3. Rest of North America
- 10.6. Market Analysis, Insights and Forecast - by Europe
- 10.6.1. United Kingdom
- 10.6.2. Germany
- 10.6.3. France
- 10.6.4. Russia
- 10.6.5. Italy
- 10.6.6. Spain
- 10.6.7. Rest of Europe
- 10.7. Market Analysis, Insights and Forecast - by Asia-Pacific
- 10.7.1. India
- 10.7.2. China
- 10.7.3. Japan
- 10.7.4. Australia
- 10.7.5. Rest of Asia-Pacific
- 10.8. Market Analysis, Insights and Forecast - by South America
- 10.8.1. Brazil
- 10.8.2. Argentina
- 10.8.3. Rest of South America
- 10.9. Market Analysis, Insights and Forecast - by Middle-East and Africa
- 10.9.1. United Arab Emirates
- 10.9.2. South Africa
- 10.9.3. Rest of Middle-East and Africa
- 10.1. Market Analysis, Insights and Forecast - by Product Type
- 11. Asia Pacific Drum Liners Market Analysis, Insights and Forecast, 2021-2033
- 11.1. Market Analysis, Insights and Forecast - by Product Type
- 11.1.1. Shrink Liner
- 11.1.2. Round Bottom Liner
- 11.1.3. Flat Bottom Liner
- 11.1.4. Others
- 11.2. Market Analysis, Insights and Forecast - by Packaging Type
- 11.2.1. Flexible
- 11.2.2. Rigid
- 11.2.3. Semi-Rigid
- 11.3. Market Analysis, Insights and Forecast - by End User
- 11.3.1. Chemicals and Flammables
- 11.3.2. Adhesives
- 11.3.3. Inks and Coatings
- 11.3.4. Food Products
- 11.3.5. Others
- 11.4. Market Analysis, Insights and Forecast - by Geography
- 11.5. Market Analysis, Insights and Forecast - by North America
- 11.5.1. United States
- 11.5.2. Canada
- 11.5.3. Rest of North America
- 11.6. Market Analysis, Insights and Forecast - by Europe
- 11.6.1. United Kingdom
- 11.6.2. Germany
- 11.6.3. France
- 11.6.4. Russia
- 11.6.5. Italy
- 11.6.6. Spain
- 11.6.7. Rest of Europe
- 11.7. Market Analysis, Insights and Forecast - by Asia-Pacific
- 11.7.1. India
- 11.7.2. China
- 11.7.3. Japan
- 11.7.4. Australia
- 11.7.5. Rest of Asia-Pacific
- 11.8. Market Analysis, Insights and Forecast - by South America
- 11.8.1. Brazil
- 11.8.2. Argentina
- 11.8.3. Rest of South America
- 11.9. Market Analysis, Insights and Forecast - by Middle-East and Africa
- 11.9.1. United Arab Emirates
- 11.9.2. South Africa
- 11.9.3. Rest of Middle-East and Africa
- 11.1. Market Analysis, Insights and Forecast - by Product Type
- 12. Competitive Analysis
- 12.1. Company Profiles
- 12.1.1 Greif
- 12.1.1.1. Company Overview
- 12.1.1.2. Products
- 12.1.1.3. Company Financials
- 12.1.1.4. SWOT Analysis
- 12.1.2 Terdex
- 12.1.2.1. Company Overview
- 12.1.2.2. Products
- 12.1.2.3. Company Financials
- 12.1.2.4. SWOT Analysis
- 12.1.3 Bagla Group
- 12.1.3.1. Company Overview
- 12.1.3.2. Products
- 12.1.3.3. Company Financials
- 12.1.3.4. SWOT Analysis
- 12.1.4 Bemis Company Inc
- 12.1.4.1. Company Overview
- 12.1.4.2. Products
- 12.1.4.3. Company Financials
- 12.1.4.4. SWOT Analysis
- 12.1.5 WINPAK LTD
- 12.1.5.1. Company Overview
- 12.1.5.2. Products
- 12.1.5.3. Company Financials
- 12.1.5.4. SWOT Analysis
- 12.1.6 Shenyang Weiming Technology Co Ltd
- 12.1.6.1. Company Overview
- 12.1.6.2. Products
- 12.1.6.3. Company Financials
- 12.1.6.4. SWOT Analysis
- 12.1.7 Bollore Group
- 12.1.7.1. Company Overview
- 12.1.7.2. Products
- 12.1.7.3. Company Financials
- 12.1.7.4. SWOT Analysis
- 12.1.8 Intertape Polymer Ltd
- 12.1.8.1. Company Overview
- 12.1.8.2. Products
- 12.1.8.3. Company Financials
- 12.1.8.4. SWOT Analysis
- 12.1.9 Berry Global Inc
- 12.1.9.1. Company Overview
- 12.1.9.2. Products
- 12.1.9.3. Company Financials
- 12.1.9.4. SWOT Analysis
- 12.1.10 Sealed Air
- 12.1.10.1. Company Overview
- 12.1.10.2. Products
- 12.1.10.3. Company Financials
- 12.1.10.4. SWOT Analysis
- 12.1.1 Greif
- 12.2. Market Entropy
- 12.2.1 Company's Key Areas Served
- 12.2.2 Recent Developments
- 12.3. Company Market Share Analysis 2025
- 12.3.1 Top 5 Companies Market Share Analysis
- 12.3.2 Top 3 Companies Market Share Analysis
- 12.4. List of Potential Customers
- 13. Research Methodology
List of Figures
- Figure 1: Global Drum Liners Market Revenue Breakdown (million, %) by Region 2025 & 2033
- Figure 2: Global Drum Liners Market Volume Breakdown (K Tons, %) by Region 2025 & 2033
- Figure 3: North America Drum Liners Market Revenue (million), by Product Type 2025 & 2033
- Figure 4: North America Drum Liners Market Volume (K Tons), by Product Type 2025 & 2033
- Figure 5: North America Drum Liners Market Revenue Share (%), by Product Type 2025 & 2033
- Figure 6: North America Drum Liners Market Volume Share (%), by Product Type 2025 & 2033
- Figure 7: North America Drum Liners Market Revenue (million), by Packaging Type 2025 & 2033
- Figure 8: North America Drum Liners Market Volume (K Tons), by Packaging Type 2025 & 2033
- Figure 9: North America Drum Liners Market Revenue Share (%), by Packaging Type 2025 & 2033
- Figure 10: North America Drum Liners Market Volume Share (%), by Packaging Type 2025 & 2033
- Figure 11: North America Drum Liners Market Revenue (million), by End User 2025 & 2033
- Figure 12: North America Drum Liners Market Volume (K Tons), by End User 2025 & 2033
- Figure 13: North America Drum Liners Market Revenue Share (%), by End User 2025 & 2033
- Figure 14: North America Drum Liners Market Volume Share (%), by End User 2025 & 2033
- Figure 15: North America Drum Liners Market Revenue (million), by Geography 2025 & 2033
- Figure 16: North America Drum Liners Market Volume (K Tons), by Geography 2025 & 2033
- Figure 17: North America Drum Liners Market Revenue Share (%), by Geography 2025 & 2033
- Figure 18: North America Drum Liners Market Volume Share (%), by Geography 2025 & 2033
- Figure 19: North America Drum Liners Market Revenue (million), by North America 2025 & 2033
- Figure 20: North America Drum Liners Market Volume (K Tons), by North America 2025 & 2033
- Figure 21: North America Drum Liners Market Revenue Share (%), by North America 2025 & 2033
- Figure 22: North America Drum Liners Market Volume Share (%), by North America 2025 & 2033
- Figure 23: North America Drum Liners Market Revenue (million), by Europe 2025 & 2033
- Figure 24: North America Drum Liners Market Volume (K Tons), by Europe 2025 & 2033
- Figure 25: North America Drum Liners Market Revenue Share (%), by Europe 2025 & 2033
- Figure 26: North America Drum Liners Market Volume Share (%), by Europe 2025 & 2033
- Figure 27: North America Drum Liners Market Revenue (million), by Asia-Pacific 2025 & 2033
- Figure 28: North America Drum Liners Market Volume (K Tons), by Asia-Pacific 2025 & 2033
- Figure 29: North America Drum Liners Market Revenue Share (%), by Asia-Pacific 2025 & 2033
- Figure 30: North America Drum Liners Market Volume Share (%), by Asia-Pacific 2025 & 2033
- Figure 31: North America Drum Liners Market Revenue (million), by South America 2025 & 2033
- Figure 32: North America Drum Liners Market Volume (K Tons), by South America 2025 & 2033
- Figure 33: North America Drum Liners Market Revenue Share (%), by South America 2025 & 2033
- Figure 34: North America Drum Liners Market Volume Share (%), by South America 2025 & 2033
- Figure 35: North America Drum Liners Market Revenue (million), by Middle-East and Africa 2025 & 2033
- Figure 36: North America Drum Liners Market Volume (K Tons), by Middle-East and Africa 2025 & 2033
- Figure 37: North America Drum Liners Market Revenue Share (%), by Middle-East and Africa 2025 & 2033
- Figure 38: North America Drum Liners Market Volume Share (%), by Middle-East and Africa 2025 & 2033
- Figure 39: North America Drum Liners Market Revenue (million), by Country 2025 & 2033
- Figure 40: North America Drum Liners Market Volume (K Tons), by Country 2025 & 2033
- Figure 41: North America Drum Liners Market Revenue Share (%), by Country 2025 & 2033
- Figure 42: North America Drum Liners Market Volume Share (%), by Country 2025 & 2033
- Figure 43: South America Drum Liners Market Revenue (million), by Product Type 2025 & 2033
- Figure 44: South America Drum Liners Market Volume (K Tons), by Product Type 2025 & 2033
- Figure 45: South America Drum Liners Market Revenue Share (%), by Product Type 2025 & 2033
- Figure 46: South America Drum Liners Market Volume Share (%), by Product Type 2025 & 2033
- Figure 47: South America Drum Liners Market Revenue (million), by Packaging Type 2025 & 2033
- Figure 48: South America Drum Liners Market Volume (K Tons), by Packaging Type 2025 & 2033
- Figure 49: South America Drum Liners Market Revenue Share (%), by Packaging Type 2025 & 2033
- Figure 50: South America Drum Liners Market Volume Share (%), by Packaging Type 2025 & 2033
- Figure 51: South America Drum Liners Market Revenue (million), by End User 2025 & 2033
- Figure 52: South America Drum Liners Market Volume (K Tons), by End User 2025 & 2033
- Figure 53: South America Drum Liners Market Revenue Share (%), by End User 2025 & 2033
- Figure 54: South America Drum Liners Market Volume Share (%), by End User 2025 & 2033
- Figure 55: South America Drum Liners Market Revenue (million), by Geography 2025 & 2033
- Figure 56: South America Drum Liners Market Volume (K Tons), by Geography 2025 & 2033
- Figure 57: South America Drum Liners Market Revenue Share (%), by Geography 2025 & 2033
- Figure 58: South America Drum Liners Market Volume Share (%), by Geography 2025 & 2033
- Figure 59: South America Drum Liners Market Revenue (million), by North America 2025 & 2033
- Figure 60: South America Drum Liners Market Volume (K Tons), by North America 2025 & 2033
- Figure 61: South America Drum Liners Market Revenue Share (%), by North America 2025 & 2033
- Figure 62: South America Drum Liners Market Volume Share (%), by North America 2025 & 2033
- Figure 63: South America Drum Liners Market Revenue (million), by Europe 2025 & 2033
- Figure 64: South America Drum Liners Market Volume (K Tons), by Europe 2025 & 2033
- Figure 65: South America Drum Liners Market Revenue Share (%), by Europe 2025 & 2033
- Figure 66: South America Drum Liners Market Volume Share (%), by Europe 2025 & 2033
- Figure 67: South America Drum Liners Market Revenue (million), by Asia-Pacific 2025 & 2033
- Figure 68: South America Drum Liners Market Volume (K Tons), by Asia-Pacific 2025 & 2033
- Figure 69: South America Drum Liners Market Revenue Share (%), by Asia-Pacific 2025 & 2033
- Figure 70: South America Drum Liners Market Volume Share (%), by Asia-Pacific 2025 & 2033
- Figure 71: South America Drum Liners Market Revenue (million), by South America 2025 & 2033
- Figure 72: South America Drum Liners Market Volume (K Tons), by South America 2025 & 2033
- Figure 73: South America Drum Liners Market Revenue Share (%), by South America 2025 & 2033
- Figure 74: South America Drum Liners Market Volume Share (%), by South America 2025 & 2033
- Figure 75: South America Drum Liners Market Revenue (million), by Middle-East and Africa 2025 & 2033
- Figure 76: South America Drum Liners Market Volume (K Tons), by Middle-East and Africa 2025 & 2033
- Figure 77: South America Drum Liners Market Revenue Share (%), by Middle-East and Africa 2025 & 2033
- Figure 78: South America Drum Liners Market Volume Share (%), by Middle-East and Africa 2025 & 2033
- Figure 79: South America Drum Liners Market Revenue (million), by Country 2025 & 2033
- Figure 80: South America Drum Liners Market Volume (K Tons), by Country 2025 & 2033
- Figure 81: South America Drum Liners Market Revenue Share (%), by Country 2025 & 2033
- Figure 82: South America Drum Liners Market Volume Share (%), by Country 2025 & 2033
- Figure 83: Europe Drum Liners Market Revenue (million), by Product Type 2025 & 2033
- Figure 84: Europe Drum Liners Market Volume (K Tons), by Product Type 2025 & 2033
- Figure 85: Europe Drum Liners Market Revenue Share (%), by Product Type 2025 & 2033
- Figure 86: Europe Drum Liners Market Volume Share (%), by Product Type 2025 & 2033
- Figure 87: Europe Drum Liners Market Revenue (million), by Packaging Type 2025 & 2033
- Figure 88: Europe Drum Liners Market Volume (K Tons), by Packaging Type 2025 & 2033
- Figure 89: Europe Drum Liners Market Revenue Share (%), by Packaging Type 2025 & 2033
- Figure 90: Europe Drum Liners Market Volume Share (%), by Packaging Type 2025 & 2033
- Figure 91: Europe Drum Liners Market Revenue (million), by End User 2025 & 2033
- Figure 92: Europe Drum Liners Market Volume (K Tons), by End User 2025 & 2033
- Figure 93: Europe Drum Liners Market Revenue Share (%), by End User 2025 & 2033
- Figure 94: Europe Drum Liners Market Volume Share (%), by End User 2025 & 2033
- Figure 95: Europe Drum Liners Market Revenue (million), by Geography 2025 & 2033
- Figure 96: Europe Drum Liners Market Volume (K Tons), by Geography 2025 & 2033
- Figure 97: Europe Drum Liners Market Revenue Share (%), by Geography 2025 & 2033
- Figure 98: Europe Drum Liners Market Volume Share (%), by Geography 2025 & 2033
- Figure 99: Europe Drum Liners Market Revenue (million), by North America 2025 & 2033
- Figure 100: Europe Drum Liners Market Volume (K Tons), by North America 2025 & 2033
- Figure 101: Europe Drum Liners Market Revenue Share (%), by North America 2025 & 2033
- Figure 102: Europe Drum Liners Market Volume Share (%), by North America 2025 & 2033
- Figure 103: Europe Drum Liners Market Revenue (million), by Europe 2025 & 2033
- Figure 104: Europe Drum Liners Market Volume (K Tons), by Europe 2025 & 2033
- Figure 105: Europe Drum Liners Market Revenue Share (%), by Europe 2025 & 2033
- Figure 106: Europe Drum Liners Market Volume Share (%), by Europe 2025 & 2033
- Figure 107: Europe Drum Liners Market Revenue (million), by Asia-Pacific 2025 & 2033
- Figure 108: Europe Drum Liners Market Volume (K Tons), by Asia-Pacific 2025 & 2033
- Figure 109: Europe Drum Liners Market Revenue Share (%), by Asia-Pacific 2025 & 2033
- Figure 110: Europe Drum Liners Market Volume Share (%), by Asia-Pacific 2025 & 2033
- Figure 111: Europe Drum Liners Market Revenue (million), by South America 2025 & 2033
- Figure 112: Europe Drum Liners Market Volume (K Tons), by South America 2025 & 2033
- Figure 113: Europe Drum Liners Market Revenue Share (%), by South America 2025 & 2033
- Figure 114: Europe Drum Liners Market Volume Share (%), by South America 2025 & 2033
- Figure 115: Europe Drum Liners Market Revenue (million), by Middle-East and Africa 2025 & 2033
- Figure 116: Europe Drum Liners Market Volume (K Tons), by Middle-East and Africa 2025 & 2033
- Figure 117: Europe Drum Liners Market Revenue Share (%), by Middle-East and Africa 2025 & 2033
- Figure 118: Europe Drum Liners Market Volume Share (%), by Middle-East and Africa 2025 & 2033
- Figure 119: Europe Drum Liners Market Revenue (million), by Country 2025 & 2033
- Figure 120: Europe Drum Liners Market Volume (K Tons), by Country 2025 & 2033
- Figure 121: Europe Drum Liners Market Revenue Share (%), by Country 2025 & 2033
- Figure 122: Europe Drum Liners Market Volume Share (%), by Country 2025 & 2033
- Figure 123: Middle East & Africa Drum Liners Market Revenue (million), by Product Type 2025 & 2033
- Figure 124: Middle East & Africa Drum Liners Market Volume (K Tons), by Product Type 2025 & 2033
- Figure 125: Middle East & Africa Drum Liners Market Revenue Share (%), by Product Type 2025 & 2033
- Figure 126: Middle East & Africa Drum Liners Market Volume Share (%), by Product Type 2025 & 2033
- Figure 127: Middle East & Africa Drum Liners Market Revenue (million), by Packaging Type 2025 & 2033
- Figure 128: Middle East & Africa Drum Liners Market Volume (K Tons), by Packaging Type 2025 & 2033
- Figure 129: Middle East & Africa Drum Liners Market Revenue Share (%), by Packaging Type 2025 & 2033
- Figure 130: Middle East & Africa Drum Liners Market Volume Share (%), by Packaging Type 2025 & 2033
- Figure 131: Middle East & Africa Drum Liners Market Revenue (million), by End User 2025 & 2033
- Figure 132: Middle East & Africa Drum Liners Market Volume (K Tons), by End User 2025 & 2033
- Figure 133: Middle East & Africa Drum Liners Market Revenue Share (%), by End User 2025 & 2033
- Figure 134: Middle East & Africa Drum Liners Market Volume Share (%), by End User 2025 & 2033
- Figure 135: Middle East & Africa Drum Liners Market Revenue (million), by Geography 2025 & 2033
- Figure 136: Middle East & Africa Drum Liners Market Volume (K Tons), by Geography 2025 & 2033
- Figure 137: Middle East & Africa Drum Liners Market Revenue Share (%), by Geography 2025 & 2033
- Figure 138: Middle East & Africa Drum Liners Market Volume Share (%), by Geography 2025 & 2033
- Figure 139: Middle East & Africa Drum Liners Market Revenue (million), by North America 2025 & 2033
- Figure 140: Middle East & Africa Drum Liners Market Volume (K Tons), by North America 2025 & 2033
- Figure 141: Middle East & Africa Drum Liners Market Revenue Share (%), by North America 2025 & 2033
- Figure 142: Middle East & Africa Drum Liners Market Volume Share (%), by North America 2025 & 2033
- Figure 143: Middle East & Africa Drum Liners Market Revenue (million), by Europe 2025 & 2033
- Figure 144: Middle East & Africa Drum Liners Market Volume (K Tons), by Europe 2025 & 2033
- Figure 145: Middle East & Africa Drum Liners Market Revenue Share (%), by Europe 2025 & 2033
- Figure 146: Middle East & Africa Drum Liners Market Volume Share (%), by Europe 2025 & 2033
- Figure 147: Middle East & Africa Drum Liners Market Revenue (million), by Asia-Pacific 2025 & 2033
- Figure 148: Middle East & Africa Drum Liners Market Volume (K Tons), by Asia-Pacific 2025 & 2033
- Figure 149: Middle East & Africa Drum Liners Market Revenue Share (%), by Asia-Pacific 2025 & 2033
- Figure 150: Middle East & Africa Drum Liners Market Volume Share (%), by Asia-Pacific 2025 & 2033
- Figure 151: Middle East & Africa Drum Liners Market Revenue (million), by South America 2025 & 2033
- Figure 152: Middle East & Africa Drum Liners Market Volume (K Tons), by South America 2025 & 2033
- Figure 153: Middle East & Africa Drum Liners Market Revenue Share (%), by South America 2025 & 2033
- Figure 154: Middle East & Africa Drum Liners Market Volume Share (%), by South America 2025 & 2033
- Figure 155: Middle East & Africa Drum Liners Market Revenue (million), by Middle-East and Africa 2025 & 2033
- Figure 156: Middle East & Africa Drum Liners Market Volume (K Tons), by Middle-East and Africa 2025 & 2033
- Figure 157: Middle East & Africa Drum Liners Market Revenue Share (%), by Middle-East and Africa 2025 & 2033
- Figure 158: Middle East & Africa Drum Liners Market Volume Share (%), by Middle-East and Africa 2025 & 2033
- Figure 159: Middle East & Africa Drum Liners Market Revenue (million), by Country 2025 & 2033
- Figure 160: Middle East & Africa Drum Liners Market Volume (K Tons), by Country 2025 & 2033
- Figure 161: Middle East & Africa Drum Liners Market Revenue Share (%), by Country 2025 & 2033
- Figure 162: Middle East & Africa Drum Liners Market Volume Share (%), by Country 2025 & 2033
- Figure 163: Asia Pacific Drum Liners Market Revenue (million), by Product Type 2025 & 2033
- Figure 164: Asia Pacific Drum Liners Market Volume (K Tons), by Product Type 2025 & 2033
- Figure 165: Asia Pacific Drum Liners Market Revenue Share (%), by Product Type 2025 & 2033
- Figure 166: Asia Pacific Drum Liners Market Volume Share (%), by Product Type 2025 & 2033
- Figure 167: Asia Pacific Drum Liners Market Revenue (million), by Packaging Type 2025 & 2033
- Figure 168: Asia Pacific Drum Liners Market Volume (K Tons), by Packaging Type 2025 & 2033
- Figure 169: Asia Pacific Drum Liners Market Revenue Share (%), by Packaging Type 2025 & 2033
- Figure 170: Asia Pacific Drum Liners Market Volume Share (%), by Packaging Type 2025 & 2033
- Figure 171: Asia Pacific Drum Liners Market Revenue (million), by End User 2025 & 2033
- Figure 172: Asia Pacific Drum Liners Market Volume (K Tons), by End User 2025 & 2033
- Figure 173: Asia Pacific Drum Liners Market Revenue Share (%), by End User 2025 & 2033
- Figure 174: Asia Pacific Drum Liners Market Volume Share (%), by End User 2025 & 2033
- Figure 175: Asia Pacific Drum Liners Market Revenue (million), by Geography 2025 & 2033
- Figure 176: Asia Pacific Drum Liners Market Volume (K Tons), by Geography 2025 & 2033
- Figure 177: Asia Pacific Drum Liners Market Revenue Share (%), by Geography 2025 & 2033
- Figure 178: Asia Pacific Drum Liners Market Volume Share (%), by Geography 2025 & 2033
- Figure 179: Asia Pacific Drum Liners Market Revenue (million), by North America 2025 & 2033
- Figure 180: Asia Pacific Drum Liners Market Volume (K Tons), by North America 2025 & 2033
- Figure 181: Asia Pacific Drum Liners Market Revenue Share (%), by North America 2025 & 2033
- Figure 182: Asia Pacific Drum Liners Market Volume Share (%), by North America 2025 & 2033
- Figure 183: Asia Pacific Drum Liners Market Revenue (million), by Europe 2025 & 2033
- Figure 184: Asia Pacific Drum Liners Market Volume (K Tons), by Europe 2025 & 2033
- Figure 185: Asia Pacific Drum Liners Market Revenue Share (%), by Europe 2025 & 2033
- Figure 186: Asia Pacific Drum Liners Market Volume Share (%), by Europe 2025 & 2033
- Figure 187: Asia Pacific Drum Liners Market Revenue (million), by Asia-Pacific 2025 & 2033
- Figure 188: Asia Pacific Drum Liners Market Volume (K Tons), by Asia-Pacific 2025 & 2033
- Figure 189: Asia Pacific Drum Liners Market Revenue Share (%), by Asia-Pacific 2025 & 2033
- Figure 190: Asia Pacific Drum Liners Market Volume Share (%), by Asia-Pacific 2025 & 2033
- Figure 191: Asia Pacific Drum Liners Market Revenue (million), by South America 2025 & 2033
- Figure 192: Asia Pacific Drum Liners Market Volume (K Tons), by South America 2025 & 2033
- Figure 193: Asia Pacific Drum Liners Market Revenue Share (%), by South America 2025 & 2033
- Figure 194: Asia Pacific Drum Liners Market Volume Share (%), by South America 2025 & 2033
- Figure 195: Asia Pacific Drum Liners Market Revenue (million), by Middle-East and Africa 2025 & 2033
- Figure 196: Asia Pacific Drum Liners Market Volume (K Tons), by Middle-East and Africa 2025 & 2033
- Figure 197: Asia Pacific Drum Liners Market Revenue Share (%), by Middle-East and Africa 2025 & 2033
- Figure 198: Asia Pacific Drum Liners Market Volume Share (%), by Middle-East and Africa 2025 & 2033
- Figure 199: Asia Pacific Drum Liners Market Revenue (million), by Country 2025 & 2033
- Figure 200: Asia Pacific Drum Liners Market Volume (K Tons), by Country 2025 & 2033
- Figure 201: Asia Pacific Drum Liners Market Revenue Share (%), by Country 2025 & 2033
- Figure 202: Asia Pacific Drum Liners Market Volume Share (%), by Country 2025 & 2033
List of Tables
- Table 1: Global Drum Liners Market Revenue million Forecast, by Product Type 2020 & 2033
- Table 2: Global Drum Liners Market Volume K Tons Forecast, by Product Type 2020 & 2033
- Table 3: Global Drum Liners Market Revenue million Forecast, by Packaging Type 2020 & 2033
- Table 4: Global Drum Liners Market Volume K Tons Forecast, by Packaging Type 2020 & 2033
- Table 5: Global Drum Liners Market Revenue million Forecast, by End User 2020 & 2033
- Table 6: Global Drum Liners Market Volume K Tons Forecast, by End User 2020 & 2033
- Table 7: Global Drum Liners Market Revenue million Forecast, by Geography 2020 & 2033
- Table 8: Global Drum Liners Market Volume K Tons Forecast, by Geography 2020 & 2033
- Table 9: Global Drum Liners Market Revenue million Forecast, by North America 2020 & 2033
- Table 10: Global Drum Liners Market Volume K Tons Forecast, by North America 2020 & 2033
- Table 11: Global Drum Liners Market Revenue million Forecast, by Europe 2020 & 2033
- Table 12: Global Drum Liners Market Volume K Tons Forecast, by Europe 2020 & 2033
- Table 13: Global Drum Liners Market Revenue million Forecast, by Asia-Pacific 2020 & 2033
- Table 14: Global Drum Liners Market Volume K Tons Forecast, by Asia-Pacific 2020 & 2033
- Table 15: Global Drum Liners Market Revenue million Forecast, by South America 2020 & 2033
- Table 16: Global Drum Liners Market Volume K Tons Forecast, by South America 2020 & 2033
- Table 17: Global Drum Liners Market Revenue million Forecast, by Middle-East and Africa 2020 & 2033
- Table 18: Global Drum Liners Market Volume K Tons Forecast, by Middle-East and Africa 2020 & 2033
- Table 19: Global Drum Liners Market Revenue million Forecast, by Region 2020 & 2033
- Table 20: Global Drum Liners Market Volume K Tons Forecast, by Region 2020 & 2033
- Table 21: Global Drum Liners Market Revenue million Forecast, by Product Type 2020 & 2033
- Table 22: Global Drum Liners Market Volume K Tons Forecast, by Product Type 2020 & 2033
- Table 23: Global Drum Liners Market Revenue million Forecast, by Packaging Type 2020 & 2033
- Table 24: Global Drum Liners Market Volume K Tons Forecast, by Packaging Type 2020 & 2033
- Table 25: Global Drum Liners Market Revenue million Forecast, by End User 2020 & 2033
- Table 26: Global Drum Liners Market Volume K Tons Forecast, by End User 2020 & 2033
- Table 27: Global Drum Liners Market Revenue million Forecast, by Geography 2020 & 2033
- Table 28: Global Drum Liners Market Volume K Tons Forecast, by Geography 2020 & 2033
- Table 29: Global Drum Liners Market Revenue million Forecast, by North America 2020 & 2033
- Table 30: Global Drum Liners Market Volume K Tons Forecast, by North America 2020 & 2033
- Table 31: Global Drum Liners Market Revenue million Forecast, by Europe 2020 & 2033
- Table 32: Global Drum Liners Market Volume K Tons Forecast, by Europe 2020 & 2033
- Table 33: Global Drum Liners Market Revenue million Forecast, by Asia-Pacific 2020 & 2033
- Table 34: Global Drum Liners Market Volume K Tons Forecast, by Asia-Pacific 2020 & 2033
- Table 35: Global Drum Liners Market Revenue million Forecast, by South America 2020 & 2033
- Table 36: Global Drum Liners Market Volume K Tons Forecast, by South America 2020 & 2033
- Table 37: Global Drum Liners Market Revenue million Forecast, by Middle-East and Africa 2020 & 2033
- Table 38: Global Drum Liners Market Volume K Tons Forecast, by Middle-East and Africa 2020 & 2033
- Table 39: Global Drum Liners Market Revenue million Forecast, by Country 2020 & 2033
- Table 40: Global Drum Liners Market Volume K Tons Forecast, by Country 2020 & 2033
- Table 41: United States Drum Liners Market Revenue (million) Forecast, by Application 2020 & 2033
- Table 42: United States Drum Liners Market Volume (K Tons) Forecast, by Application 2020 & 2033
- Table 43: Canada Drum Liners Market Revenue (million) Forecast, by Application 2020 & 2033
- Table 44: Canada Drum Liners Market Volume (K Tons) Forecast, by Application 2020 & 2033
- Table 45: Mexico Drum Liners Market Revenue (million) Forecast, by Application 2020 & 2033
- Table 46: Mexico Drum Liners Market Volume (K Tons) Forecast, by Application 2020 & 2033
- Table 47: Global Drum Liners Market Revenue million Forecast, by Product Type 2020 & 2033
- Table 48: Global Drum Liners Market Volume K Tons Forecast, by Product Type 2020 & 2033
- Table 49: Global Drum Liners Market Revenue million Forecast, by Packaging Type 2020 & 2033
- Table 50: Global Drum Liners Market Volume K Tons Forecast, by Packaging Type 2020 & 2033
- Table 51: Global Drum Liners Market Revenue million Forecast, by End User 2020 & 2033
- Table 52: Global Drum Liners Market Volume K Tons Forecast, by End User 2020 & 2033
- Table 53: Global Drum Liners Market Revenue million Forecast, by Geography 2020 & 2033
- Table 54: Global Drum Liners Market Volume K Tons Forecast, by Geography 2020 & 2033
- Table 55: Global Drum Liners Market Revenue million Forecast, by North America 2020 & 2033
- Table 56: Global Drum Liners Market Volume K Tons Forecast, by North America 2020 & 2033
- Table 57: Global Drum Liners Market Revenue million Forecast, by Europe 2020 & 2033
- Table 58: Global Drum Liners Market Volume K Tons Forecast, by Europe 2020 & 2033
- Table 59: Global Drum Liners Market Revenue million Forecast, by Asia-Pacific 2020 & 2033
- Table 60: Global Drum Liners Market Volume K Tons Forecast, by Asia-Pacific 2020 & 2033
- Table 61: Global Drum Liners Market Revenue million Forecast, by South America 2020 & 2033
- Table 62: Global Drum Liners Market Volume K Tons Forecast, by South America 2020 & 2033
- Table 63: Global Drum Liners Market Revenue million Forecast, by Middle-East and Africa 2020 & 2033
- Table 64: Global Drum Liners Market Volume K Tons Forecast, by Middle-East and Africa 2020 & 2033
- Table 65: Global Drum Liners Market Revenue million Forecast, by Country 2020 & 2033
- Table 66: Global Drum Liners Market Volume K Tons Forecast, by Country 2020 & 2033
- Table 67: Brazil Drum Liners Market Revenue (million) Forecast, by Application 2020 & 2033
- Table 68: Brazil Drum Liners Market Volume (K Tons) Forecast, by Application 2020 & 2033
- Table 69: Argentina Drum Liners Market Revenue (million) Forecast, by Application 2020 & 2033
- Table 70: Argentina Drum Liners Market Volume (K Tons) Forecast, by Application 2020 & 2033
- Table 71: Rest of South America Drum Liners Market Revenue (million) Forecast, by Application 2020 & 2033
- Table 72: Rest of South America Drum Liners Market Volume (K Tons) Forecast, by Application 2020 & 2033
- Table 73: Global Drum Liners Market Revenue million Forecast, by Product Type 2020 & 2033
- Table 74: Global Drum Liners Market Volume K Tons Forecast, by Product Type 2020 & 2033
- Table 75: Global Drum Liners Market Revenue million Forecast, by Packaging Type 2020 & 2033
- Table 76: Global Drum Liners Market Volume K Tons Forecast, by Packaging Type 2020 & 2033
- Table 77: Global Drum Liners Market Revenue million Forecast, by End User 2020 & 2033
- Table 78: Global Drum Liners Market Volume K Tons Forecast, by End User 2020 & 2033
- Table 79: Global Drum Liners Market Revenue million Forecast, by Geography 2020 & 2033
- Table 80: Global Drum Liners Market Volume K Tons Forecast, by Geography 2020 & 2033
- Table 81: Global Drum Liners Market Revenue million Forecast, by North America 2020 & 2033
- Table 82: Global Drum Liners Market Volume K Tons Forecast, by North America 2020 & 2033
- Table 83: Global Drum Liners Market Revenue million Forecast, by Europe 2020 & 2033
- Table 84: Global Drum Liners Market Volume K Tons Forecast, by Europe 2020 & 2033
- Table 85: Global Drum Liners Market Revenue million Forecast, by Asia-Pacific 2020 & 2033
- Table 86: Global Drum Liners Market Volume K Tons Forecast, by Asia-Pacific 2020 & 2033
- Table 87: Global Drum Liners Market Revenue million Forecast, by South America 2020 & 2033
- Table 88: Global Drum Liners Market Volume K Tons Forecast, by South America 2020 & 2033
- Table 89: Global Drum Liners Market Revenue million Forecast, by Middle-East and Africa 2020 & 2033
- Table 90: Global Drum Liners Market Volume K Tons Forecast, by Middle-East and Africa 2020 & 2033
- Table 91: Global Drum Liners Market Revenue million Forecast, by Country 2020 & 2033
- Table 92: Global Drum Liners Market Volume K Tons Forecast, by Country 2020 & 2033
- Table 93: United Kingdom Drum Liners Market Revenue (million) Forecast, by Application 2020 & 2033
- Table 94: United Kingdom Drum Liners Market Volume (K Tons) Forecast, by Application 2020 & 2033
- Table 95: Germany Drum Liners Market Revenue (million) Forecast, by Application 2020 & 2033
- Table 96: Germany Drum Liners Market Volume (K Tons) Forecast, by Application 2020 & 2033
- Table 97: France Drum Liners Market Revenue (million) Forecast, by Application 2020 & 2033
- Table 98: France Drum Liners Market Volume (K Tons) Forecast, by Application 2020 & 2033
- Table 99: Italy Drum Liners Market Revenue (million) Forecast, by Application 2020 & 2033
- Table 100: Italy Drum Liners Market Volume (K Tons) Forecast, by Application 2020 & 2033
- Table 101: Spain Drum Liners Market Revenue (million) Forecast, by Application 2020 & 2033
- Table 102: Spain Drum Liners Market Volume (K Tons) Forecast, by Application 2020 & 2033
- Table 103: Russia Drum Liners Market Revenue (million) Forecast, by Application 2020 & 2033
- Table 104: Russia Drum Liners Market Volume (K Tons) Forecast, by Application 2020 & 2033
- Table 105: Benelux Drum Liners Market Revenue (million) Forecast, by Application 2020 & 2033
- Table 106: Benelux Drum Liners Market Volume (K Tons) Forecast, by Application 2020 & 2033
- Table 107: Nordics Drum Liners Market Revenue (million) Forecast, by Application 2020 & 2033
- Table 108: Nordics Drum Liners Market Volume (K Tons) Forecast, by Application 2020 & 2033
- Table 109: Rest of Europe Drum Liners Market Revenue (million) Forecast, by Application 2020 & 2033
- Table 110: Rest of Europe Drum Liners Market Volume (K Tons) Forecast, by Application 2020 & 2033
- Table 111: Global Drum Liners Market Revenue million Forecast, by Product Type 2020 & 2033
- Table 112: Global Drum Liners Market Volume K Tons Forecast, by Product Type 2020 & 2033
- Table 113: Global Drum Liners Market Revenue million Forecast, by Packaging Type 2020 & 2033
- Table 114: Global Drum Liners Market Volume K Tons Forecast, by Packaging Type 2020 & 2033
- Table 115: Global Drum Liners Market Revenue million Forecast, by End User 2020 & 2033
- Table 116: Global Drum Liners Market Volume K Tons Forecast, by End User 2020 & 2033
- Table 117: Global Drum Liners Market Revenue million Forecast, by Geography 2020 & 2033
- Table 118: Global Drum Liners Market Volume K Tons Forecast, by Geography 2020 & 2033
- Table 119: Global Drum Liners Market Revenue million Forecast, by North America 2020 & 2033
- Table 120: Global Drum Liners Market Volume K Tons Forecast, by North America 2020 & 2033
- Table 121: Global Drum Liners Market Revenue million Forecast, by Europe 2020 & 2033
- Table 122: Global Drum Liners Market Volume K Tons Forecast, by Europe 2020 & 2033
- Table 123: Global Drum Liners Market Revenue million Forecast, by Asia-Pacific 2020 & 2033
- Table 124: Global Drum Liners Market Volume K Tons Forecast, by Asia-Pacific 2020 & 2033
- Table 125: Global Drum Liners Market Revenue million Forecast, by South America 2020 & 2033
- Table 126: Global Drum Liners Market Volume K Tons Forecast, by South America 2020 & 2033
- Table 127: Global Drum Liners Market Revenue million Forecast, by Middle-East and Africa 2020 & 2033
- Table 128: Global Drum Liners Market Volume K Tons Forecast, by Middle-East and Africa 2020 & 2033
- Table 129: Global Drum Liners Market Revenue million Forecast, by Country 2020 & 2033
- Table 130: Global Drum Liners Market Volume K Tons Forecast, by Country 2020 & 2033
- Table 131: Turkey Drum Liners Market Revenue (million) Forecast, by Application 2020 & 2033
- Table 132: Turkey Drum Liners Market Volume (K Tons) Forecast, by Application 2020 & 2033
- Table 133: Israel Drum Liners Market Revenue (million) Forecast, by Application 2020 & 2033
- Table 134: Israel Drum Liners Market Volume (K Tons) Forecast, by Application 2020 & 2033
- Table 135: GCC Drum Liners Market Revenue (million) Forecast, by Application 2020 & 2033
- Table 136: GCC Drum Liners Market Volume (K Tons) Forecast, by Application 2020 & 2033
- Table 137: North Africa Drum Liners Market Revenue (million) Forecast, by Application 2020 & 2033
- Table 138: North Africa Drum Liners Market Volume (K Tons) Forecast, by Application 2020 & 2033
- Table 139: South Africa Drum Liners Market Revenue (million) Forecast, by Application 2020 & 2033
- Table 140: South Africa Drum Liners Market Volume (K Tons) Forecast, by Application 2020 & 2033
- Table 141: Rest of Middle East & Africa Drum Liners Market Revenue (million) Forecast, by Application 2020 & 2033
- Table 142: Rest of Middle East & Africa Drum Liners Market Volume (K Tons) Forecast, by Application 2020 & 2033
- Table 143: Global Drum Liners Market Revenue million Forecast, by Product Type 2020 & 2033
- Table 144: Global Drum Liners Market Volume K Tons Forecast, by Product Type 2020 & 2033
- Table 145: Global Drum Liners Market Revenue million Forecast, by Packaging Type 2020 & 2033
- Table 146: Global Drum Liners Market Volume K Tons Forecast, by Packaging Type 2020 & 2033
- Table 147: Global Drum Liners Market Revenue million Forecast, by End User 2020 & 2033
- Table 148: Global Drum Liners Market Volume K Tons Forecast, by End User 2020 & 2033
- Table 149: Global Drum Liners Market Revenue million Forecast, by Geography 2020 & 2033
- Table 150: Global Drum Liners Market Volume K Tons Forecast, by Geography 2020 & 2033
- Table 151: Global Drum Liners Market Revenue million Forecast, by North America 2020 & 2033
- Table 152: Global Drum Liners Market Volume K Tons Forecast, by North America 2020 & 2033
- Table 153: Global Drum Liners Market Revenue million Forecast, by Europe 2020 & 2033
- Table 154: Global Drum Liners Market Volume K Tons Forecast, by Europe 2020 & 2033
- Table 155: Global Drum Liners Market Revenue million Forecast, by Asia-Pacific 2020 & 2033
- Table 156: Global Drum Liners Market Volume K Tons Forecast, by Asia-Pacific 2020 & 2033
- Table 157: Global Drum Liners Market Revenue million Forecast, by South America 2020 & 2033
- Table 158: Global Drum Liners Market Volume K Tons Forecast, by South America 2020 & 2033
- Table 159: Global Drum Liners Market Revenue million Forecast, by Middle-East and Africa 2020 & 2033
- Table 160: Global Drum Liners Market Volume K Tons Forecast, by Middle-East and Africa 2020 & 2033
- Table 161: Global Drum Liners Market Revenue million Forecast, by Country 2020 & 2033
- Table 162: Global Drum Liners Market Volume K Tons Forecast, by Country 2020 & 2033
- Table 163: China Drum Liners Market Revenue (million) Forecast, by Application 2020 & 2033
- Table 164: China Drum Liners Market Volume (K Tons) Forecast, by Application 2020 & 2033
- Table 165: India Drum Liners Market Revenue (million) Forecast, by Application 2020 & 2033
- Table 166: India Drum Liners Market Volume (K Tons) Forecast, by Application 2020 & 2033
- Table 167: Japan Drum Liners Market Revenue (million) Forecast, by Application 2020 & 2033
- Table 168: Japan Drum Liners Market Volume (K Tons) Forecast, by Application 2020 & 2033
- Table 169: South Korea Drum Liners Market Revenue (million) Forecast, by Application 2020 & 2033
- Table 170: South Korea Drum Liners Market Volume (K Tons) Forecast, by Application 2020 & 2033
- Table 171: ASEAN Drum Liners Market Revenue (million) Forecast, by Application 2020 & 2033
- Table 172: ASEAN Drum Liners Market Volume (K Tons) Forecast, by Application 2020 & 2033
- Table 173: Oceania Drum Liners Market Revenue (million) Forecast, by Application 2020 & 2033
- Table 174: Oceania Drum Liners Market Volume (K Tons) Forecast, by Application 2020 & 2033
- Table 175: Rest of Asia Pacific Drum Liners Market Revenue (million) Forecast, by Application 2020 & 2033
- Table 176: Rest of Asia Pacific Drum Liners Market Volume (K Tons) Forecast, by Application 2020 & 2033
Frequently Asked Questions
1. What is the projected Compound Annual Growth Rate (CAGR) of the Drum Liners Market?
The projected CAGR is approximately 6.2%.
2. Which companies are prominent players in the Drum Liners Market?
Key companies in the market include Greif, Terdex, Bagla Group, Bemis Company Inc, WINPAK LTD, Shenyang Weiming Technology Co Ltd, Bollore Group, Intertape Polymer Ltd, Berry Global Inc, Sealed Air.
3. What are the main segments of the Drum Liners Market?
The market segments include Product Type, Packaging Type, End User, Geography, North America, Europe, Asia-Pacific, South America, Middle-East and Africa.
4. Can you provide details about the market size?
The market size is estimated to be USD 710 million as of 2022.
5. What are some drivers contributing to market growth?
Advancements in Materials or Designs that Enhance Durability Which Led to Increase the Drum Liner Market.
6. What are the notable trends driving market growth?
Chemicals and Flammables is the Fastest Growing Segment.
7. Are there any restraints impacting market growth?
Higher Production Costs or Expensive Raw Materials can Limit Market Accessibility.
8. Can you provide examples of recent developments in the market?
February 2024: Berry Global announced a merger with Glatfelter Corporation, valued at USD 3.6 billion. The merger involves combining the majority of Berry’s Health, Hygiene, and Specialties segment with its Global Nonwovens and Films business (HNNF) to establish a new publicly traded company, NewCo.
9. What pricing options are available for accessing the report?
Pricing options include single-user, multi-user, and enterprise licenses priced at USD 4750, USD 5250, and USD 8750 respectively.
10. Is the market size provided in terms of value or volume?
The market size is provided in terms of value, measured in million and volume, measured in K Tons.
11. Are there any specific market keywords associated with the report?
Yes, the market keyword associated with the report is "Drum Liners Market," which aids in identifying and referencing the specific market segment covered.
12. How do I determine which pricing option suits my needs best?
The pricing options vary based on user requirements and access needs. Individual users may opt for single-user licenses, while businesses requiring broader access may choose multi-user or enterprise licenses for cost-effective access to the report.
13. Are there any additional resources or data provided in the Drum Liners Market report?
While the report offers comprehensive insights, it's advisable to review the specific contents or supplementary materials provided to ascertain if additional resources or data are available.
14. How can I stay updated on further developments or reports in the Drum Liners Market?
To stay informed about further developments, trends, and reports in the Drum Liners Market, consider subscribing to industry newsletters, following relevant companies and organizations, or regularly checking reputable industry news sources and publications.
Methodology
Step 1 - Identification of Relevant Samples Size from Population Database


Step 2 - Approaches for Defining Global Market Size (Value, Volume* & Price*)

Note*: In applicable scenarios
Step 3 - Data Sources
Primary Research
- Web Analytics
- Survey Reports
- Research Institute
- Latest Research Reports
- Opinion Leaders
Secondary Research
- Annual Reports
- White Paper
- Latest Press Release
- Industry Association
- Paid Database
- Investor Presentations

Step 4 - Data Triangulation
Involves using different sources of information in order to increase the validity of a study
These sources are likely to be stakeholders in a program - participants, other researchers, program staff, other community members, and so on.
Then we put all data in single framework & apply various statistical tools to find out the dynamic on the market.
During the analysis stage, feedback from the stakeholder groups would be compared to determine areas of agreement as well as areas of divergence