

Key Insights
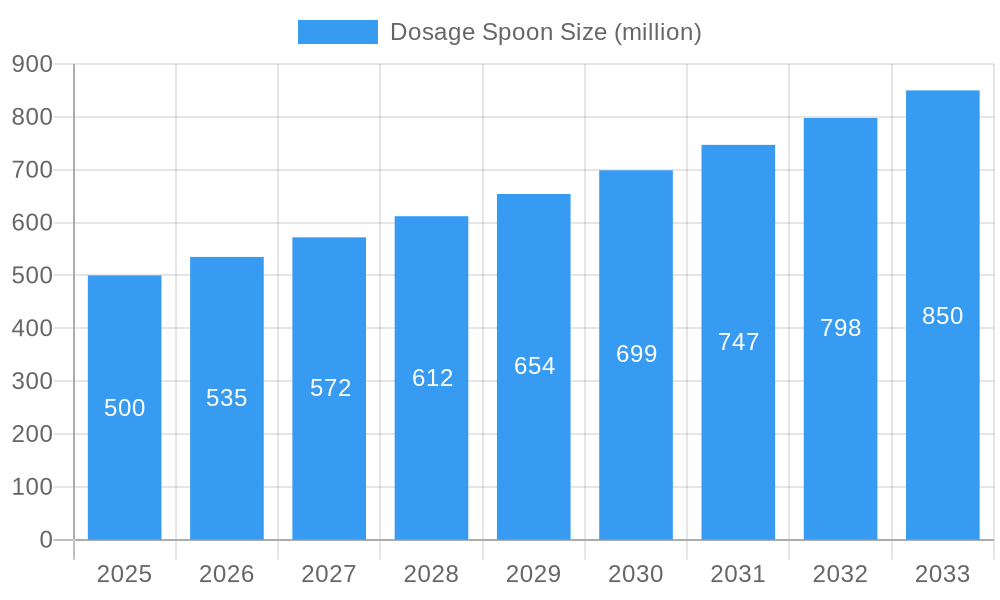
The global dosage spoon market is experiencing robust growth, driven by the increasing prevalence of chronic diseases requiring precise medication administration and a rising demand for convenient and child-safe medication dispensing solutions. The market's expansion is further fueled by stringent regulatory requirements for accurate drug dosage and the growing adoption of home healthcare. The market size in 2025 is estimated at $500 million, reflecting a Compound Annual Growth Rate (CAGR) of 7% from 2019 to 2024. This growth is expected to continue, with a projected market value of approximately $850 million by 2033, indicating significant growth opportunities for manufacturers and suppliers. Key segments driving this expansion include plastic dosage spoons due to cost-effectiveness and ease of sterilization, and spoons specifically designed for pediatric use to ensure accurate and safe medication delivery. Major players like SGH Healthcaring, Sampling Systems, and Comar are leveraging innovations in material science and design to enhance product functionality and cater to specific market needs. However, market growth might be restrained by the availability of alternative drug delivery systems and price sensitivity in certain regions.
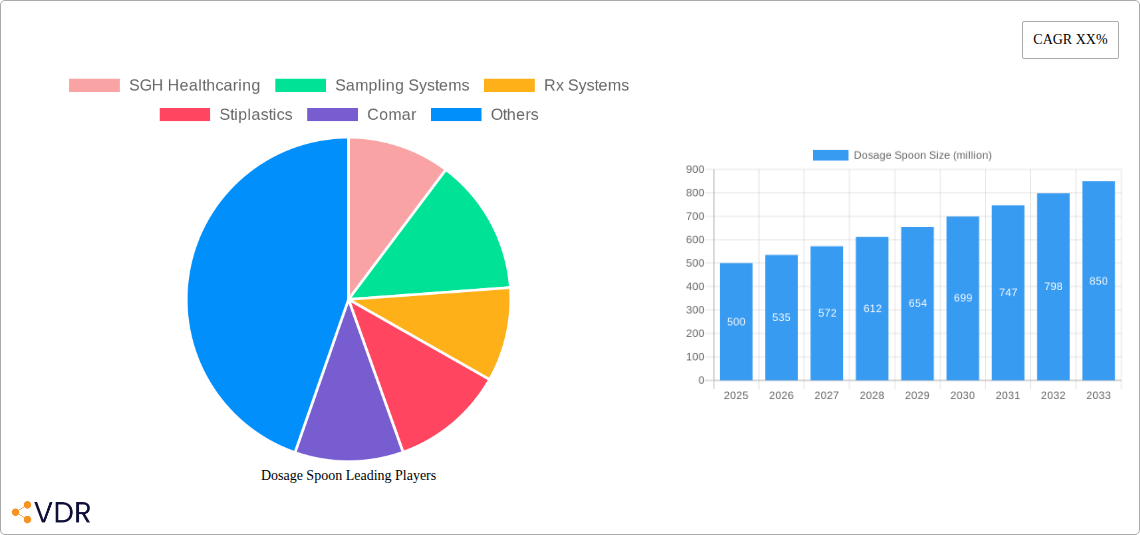
Dosage Spoon Market Size (In Million)
The forecast period (2025-2033) anticipates continued market growth, albeit at a slightly moderated pace. This moderation might be attributed to market saturation in developed regions and the emergence of substitute products. However, emerging markets, particularly in Asia-Pacific, present a significant opportunity for expansion due to rising healthcare expenditure and increasing awareness of medication adherence. Furthermore, innovative designs focusing on improved ergonomics, patient compliance, and enhanced hygiene are expected to drive future growth. Strategic partnerships and acquisitions within the industry, along with increasing investment in research and development, will be crucial factors shaping the competitive landscape and driving innovation within the dosage spoon market.
Dosage Spoon Company Market Share
Dosage Spoon Market Report: A Comprehensive Analysis (2019-2033)
This comprehensive report provides an in-depth analysis of the global Dosage Spoon market, offering invaluable insights for industry professionals, investors, and strategic decision-makers. The report meticulously examines market dynamics, growth trends, regional dominance, product landscapes, and key player strategies across the parent market of Pharmaceutical Packaging and the child market of Medical Devices. The study period spans from 2019 to 2033, with a base year of 2025 and a forecast period from 2025 to 2033. Data for the historical period (2019-2024) is also included. The report projects a market size of xx million units by 2033, representing a substantial CAGR of xx% during the forecast period.
Dosage Spoon Market Dynamics & Structure
The global Dosage Spoon market exhibits a moderately consolidated structure, with key players like SGH Healthcaring, Sampling Systems, Rx Systems, Stiplastics, Comar, and China Suncity Plastic Vials Factory holding significant market shares. Technological innovation, particularly in material science and manufacturing processes, is a key driver, alongside regulatory changes impacting pharmaceutical packaging standards. The market witnesses continuous product innovation, with companies focusing on enhancing accuracy, hygiene, and patient convenience. Competition from alternative dispensing methods, such as pre-filled syringes and blister packs, presents a challenge. The increasing demand for oral medications and growing adoption of home healthcare are key market growth drivers.
- Market Concentration: Moderately consolidated, with the top 5 players holding approximately xx% market share in 2025.
- Technological Innovation: Focus on improved accuracy, material sustainability, and ease of use.
- Regulatory Landscape: Stringent regulations regarding material safety and accuracy impact market dynamics.
- Competitive Substitutes: Pre-filled syringes, blister packs, and other dispensing methods.
- M&A Activity: xx M&A deals recorded between 2019 and 2024, with an estimated xx million USD in total deal value. This activity is driven by increased demand and growth opportunities, alongside a quest for innovation.
- Innovation Barriers: High R&D costs, stringent regulatory approvals, and the need for material compatibility with various medications.
Dosage Spoon Growth Trends & Insights
The global Dosage Spoon market has witnessed steady growth over the past few years, driven by several factors. The increasing prevalence of chronic diseases requiring consistent medication, coupled with the rising elderly population, is fuelling demand. Technological advancements have led to the development of more user-friendly and precise dosage spoons, increasing adoption rates. Consumer behavior is shifting towards greater convenience and self-medication, further bolstering market growth. The market experienced a slight dip in 2020 due to the pandemic’s impact on supply chains, but a swift recovery is predicted for the forecast period. Market penetration remains relatively high in developed regions, with growth potential concentrated in emerging economies due to rising healthcare spending.
- Market Size (2019): xx million units
- Market Size (2024): xx million units
- Market Size (2025): xx million units (Estimated)
- Market Size (2033): xx million units (Projected)
- CAGR (2025-2033): xx%
- Market Penetration (2025): xx% in developed regions, xx% in emerging regions.
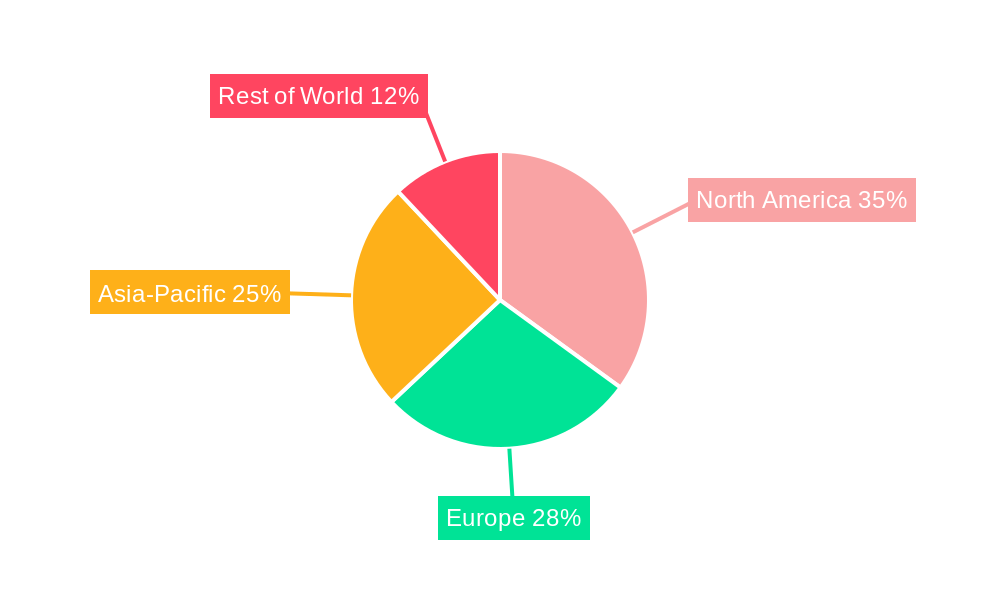
Dominant Regions, Countries, or Segments in Dosage Spoon
North America currently dominates the Dosage Spoon market, driven by factors like high healthcare expenditure, stringent regulatory frameworks (leading to high-quality product demand), and robust pharmaceutical industries. Europe follows closely, exhibiting substantial growth, particularly in Western European countries. Asia-Pacific is a rapidly emerging market, fueled by rising healthcare infrastructure development, increasing disposable incomes, and a growing geriatric population. The segment focusing on pediatric dosage spoons demonstrates high growth potential owing to an increase in the number of children with chronic illnesses.
- Key Drivers (North America): High healthcare spending, stringent regulations, established pharmaceutical industry.
- Key Drivers (Europe): Growing geriatric population, increasing healthcare expenditure, rising prevalence of chronic diseases.
- Key Drivers (Asia-Pacific): Rising disposable incomes, improving healthcare infrastructure, growing geriatric population.
- Market Share (2025): North America (xx%), Europe (xx%), Asia-Pacific (xx%), Rest of World (xx%).
Dosage Spoon Product Landscape
Dosage spoons are available in various materials (polypropylene, polyethylene, etc.), designs (single-dose, multi-dose, calibrated markings), and sizes catering to diverse age groups and medication needs. Recent innovations focus on incorporating features such as improved accuracy, ergonomic designs for ease of use, and incorporation of tamper-evident seals. Some products include integrated medicine measuring tools for multiple medications. Companies are emphasizing sustainable materials and recyclable packaging to address growing environmental concerns.
Key Drivers, Barriers & Challenges in Dosage Spoon
Key Drivers: Increasing prevalence of chronic diseases, rising geriatric population, stringent regulatory requirements pushing for accurate measurement, and growing demand for convenient self-medication.
Challenges: Intense competition, the need for compliance with stringent regulatory standards (increasing costs and lengthening development times), price sensitivity in emerging markets, and fluctuations in raw material prices impacting profitability. Supply chain disruptions, particularly during the pandemic, have highlighted vulnerability and necessitate resilient supply chain strategies. The projected impact of these challenges on market growth is estimated at a xx% reduction in the CAGR over the next decade.
Emerging Opportunities in Dosage Spoon
Emerging markets in developing countries present significant growth opportunities. The demand for customized dosage spoons tailored to specific medication types and patient needs is growing. There is potential for integrating smart technologies, such as connected devices, to improve medication adherence and patient monitoring.
Growth Accelerators in the Dosage Spoon Industry
Technological advancements like improved manufacturing processes leading to cost reductions and improved accuracy are key growth drivers. Strategic partnerships between dosage spoon manufacturers and pharmaceutical companies are vital for product integration and market penetration. Expansion into untapped markets, particularly in developing countries, offers significant potential for future growth.
Key Players Shaping the Dosage Spoon Market
- SGH Healthcaring
- Sampling Systems
- Rx Systems
- Stiplastics
- Comar
- China Suncity Plastic Vials Factory
Notable Milestones in Dosage Spoon Sector
- 2020: Several companies introduced recyclable and sustainable materials for dosage spoons.
- 2021: Rx Systems launched a new line of pediatric dosage spoons with improved accuracy.
- 2022: SGH Healthcaring announced a major investment in its manufacturing facility to increase production capacity.
- 2023: A significant number of M&A activities were seen between major players.
- 2024: New regulatory standards were introduced impacting design and manufacturing.
In-Depth Dosage Spoon Market Outlook
The future of the Dosage Spoon market appears promising. Continued technological advancements, increasing demand from developing countries, and strategic partnerships will drive significant growth over the next decade. The market is poised for further consolidation, with potential for more M&A activity among key players seeking to expand their product portfolios and global reach. Strategic investments in sustainable materials and advanced manufacturing technologies will be vital for long-term success in this dynamic market.
Dosage Spoon Segmentation
-
1. Application
- 1.1. Hospital
- 1.2. Clinic
- 1.3. Others
-
2. Types
- 2.1. Plasitc Dosage Spoon
- 2.2. Glass Dosage Spoon
- 2.3. Others
Dosage Spoon Segmentation By Geography
-
1. North America
- 1.1. United States
- 1.2. Canada
- 1.3. Mexico
-
2. South America
- 2.1. Brazil
- 2.2. Argentina
- 2.3. Rest of South America
-
3. Europe
- 3.1. United Kingdom
- 3.2. Germany
- 3.3. France
- 3.4. Italy
- 3.5. Spain
- 3.6. Russia
- 3.7. Benelux
- 3.8. Nordics
- 3.9. Rest of Europe
-
4. Middle East & Africa
- 4.1. Turkey
- 4.2. Israel
- 4.3. GCC
- 4.4. North Africa
- 4.5. South Africa
- 4.6. Rest of Middle East & Africa
-
5. Asia Pacific
- 5.1. China
- 5.2. India
- 5.3. Japan
- 5.4. South Korea
- 5.5. ASEAN
- 5.6. Oceania
- 5.7. Rest of Asia Pacific
Dosage Spoon Regional Market Share
Geographic Coverage of Dosage Spoon
Dosage Spoon REPORT HIGHLIGHTS
| Aspects | Details |
|---|---|
| Study Period | 2020-2034 |
| Base Year | 2025 |
| Estimated Year | 2026 |
| Forecast Period | 2026-2034 |
| Historical Period | 2020-2025 |
| Growth Rate | CAGR of 5.7% from 2020-2034 |
| Segmentation |
|
Table of Contents
- 1. Introduction
- 1.1. Research Scope
- 1.2. Market Segmentation
- 1.3. Research Objective
- 1.4. Definitions and Assumptions
- 2. Executive Summary
- 2.1. Market Snapshot
- 3. Market Dynamics
- 3.1. Market Drivers
- 3.2. Market Restrains
- 3.3. Market Trends
- 3.4. Market Opportunities
- 4. Market Factor Analysis
- 4.1. Porters Five Forces
- 4.1.1. Bargaining Power of Suppliers
- 4.1.2. Bargaining Power of Buyers
- 4.1.3. Threat of New Entrants
- 4.1.4. Threat of Substitutes
- 4.1.5. Competitive Rivalry
- 4.2. PESTEL analysis
- 4.3. BCG Analysis
- 4.3.1. Stars (High Growth, High Market Share)
- 4.3.2. Cash Cows (Low Growth, High Market Share)
- 4.3.3. Question Mark (High Growth, Low Market Share)
- 4.3.4. Dogs (Low Growth, Low Market Share)
- 4.4. Ansoff Matrix Analysis
- 4.5. Supply Chain Analysis
- 4.6. Regulatory Landscape
- 4.7. Current Market Potential and Opportunity Assessment (TAM–SAM–SOM Framework)
- 4.8. VDR Analyst Note
- 4.1. Porters Five Forces
- 5. Market Analysis, Insights and Forecast 2021-2033
- 5.1. Market Analysis, Insights and Forecast - by Application
- 5.1.1. Hospital
- 5.1.2. Clinic
- 5.1.3. Others
- 5.2. Market Analysis, Insights and Forecast - by Types
- 5.2.1. Plasitc Dosage Spoon
- 5.2.2. Glass Dosage Spoon
- 5.2.3. Others
- 5.3. Market Analysis, Insights and Forecast - by Region
- 5.3.1. North America
- 5.3.2. South America
- 5.3.3. Europe
- 5.3.4. Middle East & Africa
- 5.3.5. Asia Pacific
- 5.1. Market Analysis, Insights and Forecast - by Application
- 6. Global Dosage Spoon Analysis, Insights and Forecast, 2021-2033
- 6.1. Market Analysis, Insights and Forecast - by Application
- 6.1.1. Hospital
- 6.1.2. Clinic
- 6.1.3. Others
- 6.2. Market Analysis, Insights and Forecast - by Types
- 6.2.1. Plasitc Dosage Spoon
- 6.2.2. Glass Dosage Spoon
- 6.2.3. Others
- 6.1. Market Analysis, Insights and Forecast - by Application
- 7. North America Dosage Spoon Analysis, Insights and Forecast, 2021-2033
- 7.1. Market Analysis, Insights and Forecast - by Application
- 7.1.1. Hospital
- 7.1.2. Clinic
- 7.1.3. Others
- 7.2. Market Analysis, Insights and Forecast - by Types
- 7.2.1. Plasitc Dosage Spoon
- 7.2.2. Glass Dosage Spoon
- 7.2.3. Others
- 7.1. Market Analysis, Insights and Forecast - by Application
- 8. South America Dosage Spoon Analysis, Insights and Forecast, 2021-2033
- 8.1. Market Analysis, Insights and Forecast - by Application
- 8.1.1. Hospital
- 8.1.2. Clinic
- 8.1.3. Others
- 8.2. Market Analysis, Insights and Forecast - by Types
- 8.2.1. Plasitc Dosage Spoon
- 8.2.2. Glass Dosage Spoon
- 8.2.3. Others
- 8.1. Market Analysis, Insights and Forecast - by Application
- 9. Europe Dosage Spoon Analysis, Insights and Forecast, 2021-2033
- 9.1. Market Analysis, Insights and Forecast - by Application
- 9.1.1. Hospital
- 9.1.2. Clinic
- 9.1.3. Others
- 9.2. Market Analysis, Insights and Forecast - by Types
- 9.2.1. Plasitc Dosage Spoon
- 9.2.2. Glass Dosage Spoon
- 9.2.3. Others
- 9.1. Market Analysis, Insights and Forecast - by Application
- 10. Middle East & Africa Dosage Spoon Analysis, Insights and Forecast, 2021-2033
- 10.1. Market Analysis, Insights and Forecast - by Application
- 10.1.1. Hospital
- 10.1.2. Clinic
- 10.1.3. Others
- 10.2. Market Analysis, Insights and Forecast - by Types
- 10.2.1. Plasitc Dosage Spoon
- 10.2.2. Glass Dosage Spoon
- 10.2.3. Others
- 10.1. Market Analysis, Insights and Forecast - by Application
- 11. Asia Pacific Dosage Spoon Analysis, Insights and Forecast, 2021-2033
- 11.1. Market Analysis, Insights and Forecast - by Application
- 11.1.1. Hospital
- 11.1.2. Clinic
- 11.1.3. Others
- 11.2. Market Analysis, Insights and Forecast - by Types
- 11.2.1. Plasitc Dosage Spoon
- 11.2.2. Glass Dosage Spoon
- 11.2.3. Others
- 11.1. Market Analysis, Insights and Forecast - by Application
- 12. Competitive Analysis
- 12.1. Company Profiles
- 12.1.1 SGH Healthcaring
- 12.1.1.1. Company Overview
- 12.1.1.2. Products
- 12.1.1.3. Company Financials
- 12.1.1.4. SWOT Analysis
- 12.1.2 Sampling Systems
- 12.1.2.1. Company Overview
- 12.1.2.2. Products
- 12.1.2.3. Company Financials
- 12.1.2.4. SWOT Analysis
- 12.1.3 Rx Systems
- 12.1.3.1. Company Overview
- 12.1.3.2. Products
- 12.1.3.3. Company Financials
- 12.1.3.4. SWOT Analysis
- 12.1.4 Stiplastics
- 12.1.4.1. Company Overview
- 12.1.4.2. Products
- 12.1.4.3. Company Financials
- 12.1.4.4. SWOT Analysis
- 12.1.5 Comar
- 12.1.5.1. Company Overview
- 12.1.5.2. Products
- 12.1.5.3. Company Financials
- 12.1.5.4. SWOT Analysis
- 12.1.6 China Suncity Plastic Vials Factory
- 12.1.6.1. Company Overview
- 12.1.6.2. Products
- 12.1.6.3. Company Financials
- 12.1.6.4. SWOT Analysis
- 12.1.1 SGH Healthcaring
- 12.2. Market Entropy
- 12.2.1 Company's Key Areas Served
- 12.2.2 Recent Developments
- 12.3. Company Market Share Analysis 2025
- 12.3.1 Top 5 Companies Market Share Analysis
- 12.3.2 Top 3 Companies Market Share Analysis
- 12.4. List of Potential Customers
- 13. Research Methodology
List of Figures
- Figure 1: Global Dosage Spoon Revenue Breakdown (undefined, %) by Region 2025 & 2033
- Figure 2: North America Dosage Spoon Revenue (undefined), by Application 2025 & 2033
- Figure 3: North America Dosage Spoon Revenue Share (%), by Application 2025 & 2033
- Figure 4: North America Dosage Spoon Revenue (undefined), by Types 2025 & 2033
- Figure 5: North America Dosage Spoon Revenue Share (%), by Types 2025 & 2033
- Figure 6: North America Dosage Spoon Revenue (undefined), by Country 2025 & 2033
- Figure 7: North America Dosage Spoon Revenue Share (%), by Country 2025 & 2033
- Figure 8: South America Dosage Spoon Revenue (undefined), by Application 2025 & 2033
- Figure 9: South America Dosage Spoon Revenue Share (%), by Application 2025 & 2033
- Figure 10: South America Dosage Spoon Revenue (undefined), by Types 2025 & 2033
- Figure 11: South America Dosage Spoon Revenue Share (%), by Types 2025 & 2033
- Figure 12: South America Dosage Spoon Revenue (undefined), by Country 2025 & 2033
- Figure 13: South America Dosage Spoon Revenue Share (%), by Country 2025 & 2033
- Figure 14: Europe Dosage Spoon Revenue (undefined), by Application 2025 & 2033
- Figure 15: Europe Dosage Spoon Revenue Share (%), by Application 2025 & 2033
- Figure 16: Europe Dosage Spoon Revenue (undefined), by Types 2025 & 2033
- Figure 17: Europe Dosage Spoon Revenue Share (%), by Types 2025 & 2033
- Figure 18: Europe Dosage Spoon Revenue (undefined), by Country 2025 & 2033
- Figure 19: Europe Dosage Spoon Revenue Share (%), by Country 2025 & 2033
- Figure 20: Middle East & Africa Dosage Spoon Revenue (undefined), by Application 2025 & 2033
- Figure 21: Middle East & Africa Dosage Spoon Revenue Share (%), by Application 2025 & 2033
- Figure 22: Middle East & Africa Dosage Spoon Revenue (undefined), by Types 2025 & 2033
- Figure 23: Middle East & Africa Dosage Spoon Revenue Share (%), by Types 2025 & 2033
- Figure 24: Middle East & Africa Dosage Spoon Revenue (undefined), by Country 2025 & 2033
- Figure 25: Middle East & Africa Dosage Spoon Revenue Share (%), by Country 2025 & 2033
- Figure 26: Asia Pacific Dosage Spoon Revenue (undefined), by Application 2025 & 2033
- Figure 27: Asia Pacific Dosage Spoon Revenue Share (%), by Application 2025 & 2033
- Figure 28: Asia Pacific Dosage Spoon Revenue (undefined), by Types 2025 & 2033
- Figure 29: Asia Pacific Dosage Spoon Revenue Share (%), by Types 2025 & 2033
- Figure 30: Asia Pacific Dosage Spoon Revenue (undefined), by Country 2025 & 2033
- Figure 31: Asia Pacific Dosage Spoon Revenue Share (%), by Country 2025 & 2033
List of Tables
- Table 1: Global Dosage Spoon Revenue undefined Forecast, by Application 2020 & 2033
- Table 2: Global Dosage Spoon Revenue undefined Forecast, by Types 2020 & 2033
- Table 3: Global Dosage Spoon Revenue undefined Forecast, by Region 2020 & 2033
- Table 4: Global Dosage Spoon Revenue undefined Forecast, by Application 2020 & 2033
- Table 5: Global Dosage Spoon Revenue undefined Forecast, by Types 2020 & 2033
- Table 6: Global Dosage Spoon Revenue undefined Forecast, by Country 2020 & 2033
- Table 7: United States Dosage Spoon Revenue (undefined) Forecast, by Application 2020 & 2033
- Table 8: Canada Dosage Spoon Revenue (undefined) Forecast, by Application 2020 & 2033
- Table 9: Mexico Dosage Spoon Revenue (undefined) Forecast, by Application 2020 & 2033
- Table 10: Global Dosage Spoon Revenue undefined Forecast, by Application 2020 & 2033
- Table 11: Global Dosage Spoon Revenue undefined Forecast, by Types 2020 & 2033
- Table 12: Global Dosage Spoon Revenue undefined Forecast, by Country 2020 & 2033
- Table 13: Brazil Dosage Spoon Revenue (undefined) Forecast, by Application 2020 & 2033
- Table 14: Argentina Dosage Spoon Revenue (undefined) Forecast, by Application 2020 & 2033
- Table 15: Rest of South America Dosage Spoon Revenue (undefined) Forecast, by Application 2020 & 2033
- Table 16: Global Dosage Spoon Revenue undefined Forecast, by Application 2020 & 2033
- Table 17: Global Dosage Spoon Revenue undefined Forecast, by Types 2020 & 2033
- Table 18: Global Dosage Spoon Revenue undefined Forecast, by Country 2020 & 2033
- Table 19: United Kingdom Dosage Spoon Revenue (undefined) Forecast, by Application 2020 & 2033
- Table 20: Germany Dosage Spoon Revenue (undefined) Forecast, by Application 2020 & 2033
- Table 21: France Dosage Spoon Revenue (undefined) Forecast, by Application 2020 & 2033
- Table 22: Italy Dosage Spoon Revenue (undefined) Forecast, by Application 2020 & 2033
- Table 23: Spain Dosage Spoon Revenue (undefined) Forecast, by Application 2020 & 2033
- Table 24: Russia Dosage Spoon Revenue (undefined) Forecast, by Application 2020 & 2033
- Table 25: Benelux Dosage Spoon Revenue (undefined) Forecast, by Application 2020 & 2033
- Table 26: Nordics Dosage Spoon Revenue (undefined) Forecast, by Application 2020 & 2033
- Table 27: Rest of Europe Dosage Spoon Revenue (undefined) Forecast, by Application 2020 & 2033
- Table 28: Global Dosage Spoon Revenue undefined Forecast, by Application 2020 & 2033
- Table 29: Global Dosage Spoon Revenue undefined Forecast, by Types 2020 & 2033
- Table 30: Global Dosage Spoon Revenue undefined Forecast, by Country 2020 & 2033
- Table 31: Turkey Dosage Spoon Revenue (undefined) Forecast, by Application 2020 & 2033
- Table 32: Israel Dosage Spoon Revenue (undefined) Forecast, by Application 2020 & 2033
- Table 33: GCC Dosage Spoon Revenue (undefined) Forecast, by Application 2020 & 2033
- Table 34: North Africa Dosage Spoon Revenue (undefined) Forecast, by Application 2020 & 2033
- Table 35: South Africa Dosage Spoon Revenue (undefined) Forecast, by Application 2020 & 2033
- Table 36: Rest of Middle East & Africa Dosage Spoon Revenue (undefined) Forecast, by Application 2020 & 2033
- Table 37: Global Dosage Spoon Revenue undefined Forecast, by Application 2020 & 2033
- Table 38: Global Dosage Spoon Revenue undefined Forecast, by Types 2020 & 2033
- Table 39: Global Dosage Spoon Revenue undefined Forecast, by Country 2020 & 2033
- Table 40: China Dosage Spoon Revenue (undefined) Forecast, by Application 2020 & 2033
- Table 41: India Dosage Spoon Revenue (undefined) Forecast, by Application 2020 & 2033
- Table 42: Japan Dosage Spoon Revenue (undefined) Forecast, by Application 2020 & 2033
- Table 43: South Korea Dosage Spoon Revenue (undefined) Forecast, by Application 2020 & 2033
- Table 44: ASEAN Dosage Spoon Revenue (undefined) Forecast, by Application 2020 & 2033
- Table 45: Oceania Dosage Spoon Revenue (undefined) Forecast, by Application 2020 & 2033
- Table 46: Rest of Asia Pacific Dosage Spoon Revenue (undefined) Forecast, by Application 2020 & 2033
Frequently Asked Questions
1. What is the projected Compound Annual Growth Rate (CAGR) of the Dosage Spoon?
The projected CAGR is approximately 5.7%.
2. Which companies are prominent players in the Dosage Spoon?
Key companies in the market include SGH Healthcaring, Sampling Systems, Rx Systems, Stiplastics, Comar, China Suncity Plastic Vials Factory.
3. What are the main segments of the Dosage Spoon?
The market segments include Application, Types.
4. Can you provide details about the market size?
The market size is estimated to be USD XXX N/A as of 2022.
5. What are some drivers contributing to market growth?
N/A
6. What are the notable trends driving market growth?
N/A
7. Are there any restraints impacting market growth?
N/A
8. Can you provide examples of recent developments in the market?
N/A
9. What pricing options are available for accessing the report?
Pricing options include single-user, multi-user, and enterprise licenses priced at USD 4900.00, USD 7350.00, and USD 9800.00 respectively.
10. Is the market size provided in terms of value or volume?
The market size is provided in terms of value, measured in N/A.
11. Are there any specific market keywords associated with the report?
Yes, the market keyword associated with the report is "Dosage Spoon," which aids in identifying and referencing the specific market segment covered.
12. How do I determine which pricing option suits my needs best?
The pricing options vary based on user requirements and access needs. Individual users may opt for single-user licenses, while businesses requiring broader access may choose multi-user or enterprise licenses for cost-effective access to the report.
13. Are there any additional resources or data provided in the Dosage Spoon report?
While the report offers comprehensive insights, it's advisable to review the specific contents or supplementary materials provided to ascertain if additional resources or data are available.
14. How can I stay updated on further developments or reports in the Dosage Spoon?
To stay informed about further developments, trends, and reports in the Dosage Spoon, consider subscribing to industry newsletters, following relevant companies and organizations, or regularly checking reputable industry news sources and publications.
Methodology
Step 1 - Identification of Relevant Samples Size from Population Database


Step 2 - Approaches for Defining Global Market Size (Value, Volume* & Price*)

Note*: In applicable scenarios
Step 3 - Data Sources
Primary Research
- Web Analytics
- Survey Reports
- Research Institute
- Latest Research Reports
- Opinion Leaders
Secondary Research
- Annual Reports
- White Paper
- Latest Press Release
- Industry Association
- Paid Database
- Investor Presentations

Step 4 - Data Triangulation
Involves using different sources of information in order to increase the validity of a study
These sources are likely to be stakeholders in a program - participants, other researchers, program staff, other community members, and so on.
Then we put all data in single framework & apply various statistical tools to find out the dynamic on the market.
During the analysis stage, feedback from the stakeholder groups would be compared to determine areas of agreement as well as areas of divergence