
Key Insights
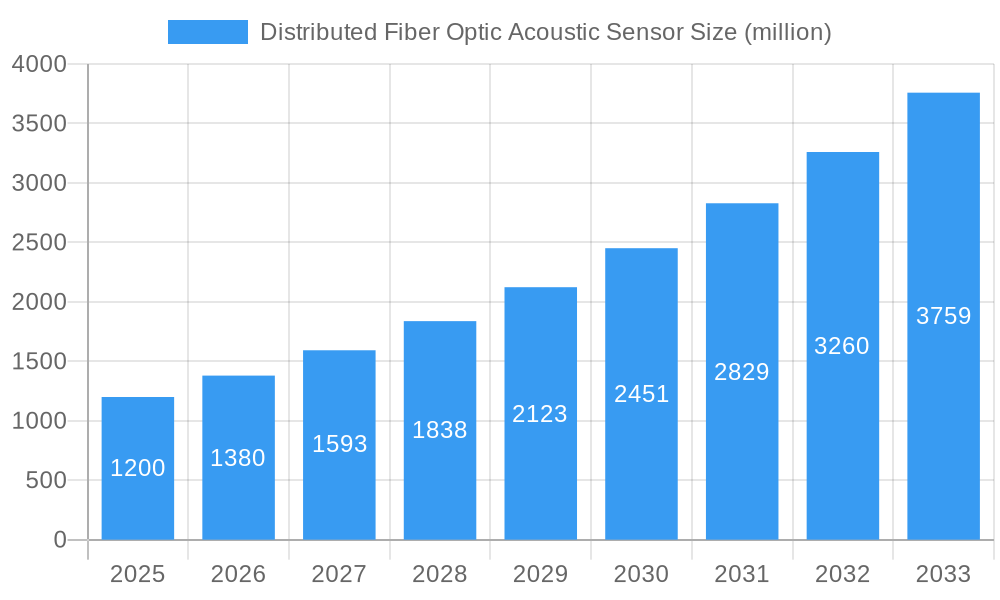
The Distributed Fiber Optic Acoustic Sensor (DFAS) market is experiencing robust growth, driven by increasing demand for advanced sensing technologies across diverse sectors. The market's expansion is fueled by several key factors, including the rising need for enhanced security and surveillance in critical infrastructure like pipelines, railways, and perimeters. DFAS technology offers a significant advantage over traditional point sensors due to its ability to provide continuous, distributed monitoring over extensive distances, leading to improved situational awareness and quicker response times to potential threats. Furthermore, the cost-effectiveness of DFAS, especially in large-scale deployments, is a compelling factor driving its adoption. The integration of DFAS with advanced analytics and data processing capabilities is further enhancing its value proposition, enabling real-time threat detection and predictive maintenance. We estimate the 2025 market size to be approximately $1.2 billion, with a Compound Annual Growth Rate (CAGR) of 15% projected through 2033. This growth is expected to be fueled by continuous technological advancements and expanding applications across various industry verticals.

Distributed Fiber Optic Acoustic Sensor Market Size (In Billion)

Major players like AGIOE, Siemens, ABB, Schneider Electric, and Honeywell are actively shaping the market through continuous innovation and strategic partnerships. However, the market also faces some restraints, including the relatively high initial investment cost for installation and the need for specialized expertise in deployment and data analysis. Despite these challenges, the long-term benefits of enhanced security, reduced maintenance costs, and improved operational efficiency are expected to overcome these limitations, resulting in sustained market growth. The segmentation of the market is likely to evolve based on applications (security, infrastructure monitoring, oil & gas), deployment types (perimeter security, pipeline monitoring), and sensor technology, creating various opportunities for specialized players and customized solutions. Regional growth will vary, with North America and Europe expected to lead initially, followed by growth in Asia-Pacific and other emerging markets as infrastructure development and security concerns increase.
Distributed Fiber Optic Acoustic Sensor Company Market Share
Distributed Fiber Optic Acoustic Sensor Market Report: 2019-2033
This comprehensive report provides an in-depth analysis of the Distributed Fiber Optic Acoustic Sensor (DFOAS) market, encompassing market dynamics, growth trends, regional dominance, product landscape, key players, and future outlook. The report covers the period from 2019 to 2033, with 2025 serving as the base and estimated year. The parent market is the broader fiber optic sensor market, while the child market is specifically DFOAS applications in various industries. The market size is projected to reach xx million units by 2033.
Distributed Fiber Optic Acoustic Sensor Market Dynamics & Structure
The Distributed Fiber Optic Acoustic Sensor market is characterized by moderate concentration, with key players holding significant market share. Technological innovation, particularly in sensitivity and range, is a primary driver. Stringent safety regulations in sectors like oil & gas and transportation influence market growth. While some substitute technologies exist, DFOAS offers unique advantages in terms of scalability and real-time monitoring. End-user demographics are diverse, spanning oil & gas, security, infrastructure monitoring, and environmental sensing. M&A activity has been relatively low, with approximately xx deals recorded during the historical period (2019-2024), suggesting opportunities for consolidation.
- Market Concentration: Moderately concentrated, with top 5 players holding approximately xx% market share in 2025.
- Technological Innovation: Focus on improved sensitivity, extended range, and data processing capabilities.
- Regulatory Landscape: Stringent regulations in key sectors drive adoption, especially for safety-critical applications.
- Competitive Substitutes: Limited direct substitutes, with DFOAS offering unique advantages in certain applications.
- End-User Demographics: Oil & gas, security, infrastructure monitoring, environmental sensing, and transportation.
- M&A Activity: xx deals recorded between 2019 and 2024, with potential for increased consolidation.
Distributed Fiber Optic Acoustic Sensor Growth Trends & Insights
The DFOAS market has experienced steady growth throughout the historical period (2019-2024), driven by increasing demand for enhanced monitoring and security solutions across various sectors. The market is projected to exhibit a Compound Annual Growth Rate (CAGR) of xx% during the forecast period (2025-2033), reaching a market size of xx million units by 2033. Technological advancements, such as improved signal processing and miniaturization, are fueling adoption. Consumer behavior is shifting towards proactive maintenance and risk mitigation, further driving market growth. Market penetration remains relatively low in some segments, indicating significant untapped potential.
Dominant Regions, Countries, or Segments in Distributed Fiber Optic Acoustic Sensor
North America currently dominates the DFOAS market, driven by strong investments in infrastructure monitoring and advanced security systems. Europe and Asia-Pacific are also experiencing significant growth, fueled by expanding industrial activities and government initiatives to enhance safety and security.
- North America: Leading market share due to early adoption and robust technological advancements.
- Europe: Growing market driven by infrastructure development and stringent environmental regulations.
- Asia-Pacific: Rapid growth potential driven by increasing industrialization and infrastructure investment.
- Key Drivers: Government investments in infrastructure projects, stringent safety and security regulations, increasing demand for real-time monitoring solutions.
Distributed Fiber Optic Acoustic Sensor Product Landscape
DFOAS products are evolving towards higher sensitivity, longer range, and improved data analytics capabilities. Innovations focus on optimizing signal processing for noise reduction and developing more robust and cost-effective solutions for diverse applications. Unique selling propositions include real-time monitoring, distributed sensing capabilities, and the ability to detect various types of acoustic events.
Key Drivers, Barriers & Challenges in Distributed Fiber Optic Acoustic Sensor
Key Drivers: Increasing demand for enhanced security and safety solutions, advancements in fiber optic technology, and the growing need for real-time monitoring in critical infrastructure.
Challenges: High initial investment costs, complexity of installation and maintenance, and competition from alternative technologies. Supply chain disruptions, particularly related to specialized fiber optics and components, can also impact market growth, potentially causing a xx% reduction in supply during peak demand periods. Regulatory hurdles in specific regions may also impede wider adoption.
Emerging Opportunities in Distributed Fiber Optic Acoustic Sensor
Untapped markets in developing economies present significant opportunities. Innovations in data analytics and integration with other IoT sensors will open new avenues for application development, including precision agriculture and smart cities.
Growth Accelerators in the Distributed Fiber Optic Acoustic Sensor Industry
Technological breakthroughs in fiber optic sensor technology, strategic partnerships between sensor manufacturers and system integrators, and aggressive expansion strategies into new markets are all driving long-term growth in the DFOAS market. Government incentives for adopting advanced monitoring systems also contribute to accelerated growth.
Key Players Shaping the Distributed Fiber Optic Acoustic Sensor Market
Notable Milestones in Distributed Fiber Optic Acoustic Sensor Sector
- 2021 Q3: Introduction of a new generation of high-sensitivity DFOAS sensors by AGIOE.
- 2022 Q1: Siemens announces strategic partnership with a leading system integrator for DFOAS deployment in infrastructure monitoring.
- 2023 Q2: Successful field trial of a long-range DFOAS system for pipeline monitoring.
In-Depth Distributed Fiber Optic Acoustic Sensor Market Outlook
The DFOAS market is poised for significant growth over the next decade, driven by continuous technological advancements, expanding applications, and increasing demand for real-time monitoring and enhanced security across various sectors. Strategic partnerships and investments in R&D will further accelerate market expansion, offering significant opportunities for both established players and new entrants.
Distributed Fiber Optic Acoustic Sensor Segmentation
-
1. Application
- 1.1. Petrochemical Industry
- 1.2. Environmental Industry
- 1.3. Transportation Industry
- 1.4. Aerospace Industry
- 1.5. Others
-
2. Type
- 2.1. Optical Time Domain Acoustic Sensor
- 2.2. Optical Time Domain Acoustic Sensor
Distributed Fiber Optic Acoustic Sensor Segmentation By Geography
-
1. North America
- 1.1. United States
- 1.2. Canada
- 1.3. Mexico
-
2. South America
- 2.1. Brazil
- 2.2. Argentina
- 2.3. Rest of South America
-
3. Europe
- 3.1. United Kingdom
- 3.2. Germany
- 3.3. France
- 3.4. Italy
- 3.5. Spain
- 3.6. Russia
- 3.7. Benelux
- 3.8. Nordics
- 3.9. Rest of Europe
-
4. Middle East & Africa
- 4.1. Turkey
- 4.2. Israel
- 4.3. GCC
- 4.4. North Africa
- 4.5. South Africa
- 4.6. Rest of Middle East & Africa
-
5. Asia Pacific
- 5.1. China
- 5.2. India
- 5.3. Japan
- 5.4. South Korea
- 5.5. ASEAN
- 5.6. Oceania
- 5.7. Rest of Asia Pacific

Distributed Fiber Optic Acoustic Sensor Regional Market Share
Geographic Coverage of Distributed Fiber Optic Acoustic Sensor
Distributed Fiber Optic Acoustic Sensor REPORT HIGHLIGHTS
| Aspects | Details |
|---|---|
| Study Period | 2020-2034 |
| Base Year | 2025 |
| Estimated Year | 2026 |
| Forecast Period | 2026-2034 |
| Historical Period | 2020-2025 |
| Growth Rate | CAGR of XXX% from 2020-2034 |
| Segmentation |
|
Table of Contents
- 1. Introduction
- 1.1. Research Scope
- 1.2. Market Segmentation
- 1.3. Research Methodology
- 1.4. Definitions and Assumptions
- 2. Executive Summary
- 2.1. Introduction
- 3. Market Dynamics
- 3.1. Introduction
- 3.2. Market Drivers
- 3.3. Market Restrains
- 3.4. Market Trends
- 4. Market Factor Analysis
- 4.1. Porters Five Forces
- 4.2. Supply/Value Chain
- 4.3. PESTEL analysis
- 4.4. Market Entropy
- 4.5. Patent/Trademark Analysis
- 5. Global Distributed Fiber Optic Acoustic Sensor Analysis, Insights and Forecast, 2020-2032
- 5.1. Market Analysis, Insights and Forecast - by Application
- 5.1.1. Petrochemical Industry
- 5.1.2. Environmental Industry
- 5.1.3. Transportation Industry
- 5.1.4. Aerospace Industry
- 5.1.5. Others
- 5.2. Market Analysis, Insights and Forecast - by Type
- 5.2.1. Optical Time Domain Acoustic Sensor
- 5.2.2. Optical Time Domain Acoustic Sensor
- 5.3. Market Analysis, Insights and Forecast - by Region
- 5.3.1. North America
- 5.3.2. South America
- 5.3.3. Europe
- 5.3.4. Middle East & Africa
- 5.3.5. Asia Pacific
- 5.1. Market Analysis, Insights and Forecast - by Application
- 6. North America Distributed Fiber Optic Acoustic Sensor Analysis, Insights and Forecast, 2020-2032
- 6.1. Market Analysis, Insights and Forecast - by Application
- 6.1.1. Petrochemical Industry
- 6.1.2. Environmental Industry
- 6.1.3. Transportation Industry
- 6.1.4. Aerospace Industry
- 6.1.5. Others
- 6.2. Market Analysis, Insights and Forecast - by Type
- 6.2.1. Optical Time Domain Acoustic Sensor
- 6.2.2. Optical Time Domain Acoustic Sensor
- 6.1. Market Analysis, Insights and Forecast - by Application
- 7. South America Distributed Fiber Optic Acoustic Sensor Analysis, Insights and Forecast, 2020-2032
- 7.1. Market Analysis, Insights and Forecast - by Application
- 7.1.1. Petrochemical Industry
- 7.1.2. Environmental Industry
- 7.1.3. Transportation Industry
- 7.1.4. Aerospace Industry
- 7.1.5. Others
- 7.2. Market Analysis, Insights and Forecast - by Type
- 7.2.1. Optical Time Domain Acoustic Sensor
- 7.2.2. Optical Time Domain Acoustic Sensor
- 7.1. Market Analysis, Insights and Forecast - by Application
- 8. Europe Distributed Fiber Optic Acoustic Sensor Analysis, Insights and Forecast, 2020-2032
- 8.1. Market Analysis, Insights and Forecast - by Application
- 8.1.1. Petrochemical Industry
- 8.1.2. Environmental Industry
- 8.1.3. Transportation Industry
- 8.1.4. Aerospace Industry
- 8.1.5. Others
- 8.2. Market Analysis, Insights and Forecast - by Type
- 8.2.1. Optical Time Domain Acoustic Sensor
- 8.2.2. Optical Time Domain Acoustic Sensor
- 8.1. Market Analysis, Insights and Forecast - by Application
- 9. Middle East & Africa Distributed Fiber Optic Acoustic Sensor Analysis, Insights and Forecast, 2020-2032
- 9.1. Market Analysis, Insights and Forecast - by Application
- 9.1.1. Petrochemical Industry
- 9.1.2. Environmental Industry
- 9.1.3. Transportation Industry
- 9.1.4. Aerospace Industry
- 9.1.5. Others
- 9.2. Market Analysis, Insights and Forecast - by Type
- 9.2.1. Optical Time Domain Acoustic Sensor
- 9.2.2. Optical Time Domain Acoustic Sensor
- 9.1. Market Analysis, Insights and Forecast - by Application
- 10. Asia Pacific Distributed Fiber Optic Acoustic Sensor Analysis, Insights and Forecast, 2020-2032
- 10.1. Market Analysis, Insights and Forecast - by Application
- 10.1.1. Petrochemical Industry
- 10.1.2. Environmental Industry
- 10.1.3. Transportation Industry
- 10.1.4. Aerospace Industry
- 10.1.5. Others
- 10.2. Market Analysis, Insights and Forecast - by Type
- 10.2.1. Optical Time Domain Acoustic Sensor
- 10.2.2. Optical Time Domain Acoustic Sensor
- 10.1. Market Analysis, Insights and Forecast - by Application
- 11. Competitive Analysis
- 11.1. Global Market Share Analysis 2025
- 11.2. Company Profiles
- 11.2.1 AGIOE
- 11.2.1.1. Overview
- 11.2.1.2. Products
- 11.2.1.3. SWOT Analysis
- 11.2.1.4. Recent Developments
- 11.2.1.5. Financials (Based on Availability)
- 11.2.2 Siemens
- 11.2.2.1. Overview
- 11.2.2.2. Products
- 11.2.2.3. SWOT Analysis
- 11.2.2.4. Recent Developments
- 11.2.2.5. Financials (Based on Availability)
- 11.2.3 ABB
- 11.2.3.1. Overview
- 11.2.3.2. Products
- 11.2.3.3. SWOT Analysis
- 11.2.3.4. Recent Developments
- 11.2.3.5. Financials (Based on Availability)
- 11.2.4 Schneider Electric
- 11.2.4.1. Overview
- 11.2.4.2. Products
- 11.2.4.3. SWOT Analysis
- 11.2.4.4. Recent Developments
- 11.2.4.5. Financials (Based on Availability)
- 11.2.5 Honeywell
- 11.2.5.1. Overview
- 11.2.5.2. Products
- 11.2.5.3. SWOT Analysis
- 11.2.5.4. Recent Developments
- 11.2.5.5. Financials (Based on Availability)
- 11.2.6 General Electric
- 11.2.6.1. Overview
- 11.2.6.2. Products
- 11.2.6.3. SWOT Analysis
- 11.2.6.4. Recent Developments
- 11.2.6.5. Financials (Based on Availability)
- 11.2.7 Rockwell Automation
- 11.2.7.1. Overview
- 11.2.7.2. Products
- 11.2.7.3. SWOT Analysis
- 11.2.7.4. Recent Developments
- 11.2.7.5. Financials (Based on Availability)
- 11.2.8 Emerson Electric
- 11.2.8.1. Overview
- 11.2.8.2. Products
- 11.2.8.3. SWOT Analysis
- 11.2.8.4. Recent Developments
- 11.2.8.5. Financials (Based on Availability)
- 11.2.9 Mitsubishi Electric
- 11.2.9.1. Overview
- 11.2.9.2. Products
- 11.2.9.3. SWOT Analysis
- 11.2.9.4. Recent Developments
- 11.2.9.5. Financials (Based on Availability)
- 11.2.10 Eaton Corporation
- 11.2.10.1. Overview
- 11.2.10.2. Products
- 11.2.10.3. SWOT Analysis
- 11.2.10.4. Recent Developments
- 11.2.10.5. Financials (Based on Availability)
- 11.2.11 Danaher Corporation
- 11.2.11.1. Overview
- 11.2.11.2. Products
- 11.2.11.3. SWOT Analysis
- 11.2.11.4. Recent Developments
- 11.2.11.5. Financials (Based on Availability)
- 11.2.12 Johnson Controls
- 11.2.12.1. Overview
- 11.2.12.2. Products
- 11.2.12.3. SWOT Analysis
- 11.2.12.4. Recent Developments
- 11.2.12.5. Financials (Based on Availability)
- 11.2.13 Toshiba Corporation
- 11.2.13.1. Overview
- 11.2.13.2. Products
- 11.2.13.3. SWOT Analysis
- 11.2.13.4. Recent Developments
- 11.2.13.5. Financials (Based on Availability)
- 11.2.14 Hitachi Ltd.
- 11.2.14.1. Overview
- 11.2.14.2. Products
- 11.2.14.3. SWOT Analysis
- 11.2.14.4. Recent Developments
- 11.2.14.5. Financials (Based on Availability)
- 11.2.15 Corning Incorporated
- 11.2.15.1. Overview
- 11.2.15.2. Products
- 11.2.15.3. SWOT Analysis
- 11.2.15.4. Recent Developments
- 11.2.15.5. Financials (Based on Availability)
- 11.2.16 Prysmian Group
- 11.2.16.1. Overview
- 11.2.16.2. Products
- 11.2.16.3. SWOT Analysis
- 11.2.16.4. Recent Developments
- 11.2.16.5. Financials (Based on Availability)
- 11.2.1 AGIOE
List of Figures
- Figure 1: Global Distributed Fiber Optic Acoustic Sensor Revenue Breakdown (million, %) by Region 2025 & 2033
- Figure 2: Global Distributed Fiber Optic Acoustic Sensor Volume Breakdown (K, %) by Region 2025 & 2033
- Figure 3: North America Distributed Fiber Optic Acoustic Sensor Revenue (million), by Application 2025 & 2033
- Figure 4: North America Distributed Fiber Optic Acoustic Sensor Volume (K), by Application 2025 & 2033
- Figure 5: North America Distributed Fiber Optic Acoustic Sensor Revenue Share (%), by Application 2025 & 2033
- Figure 6: North America Distributed Fiber Optic Acoustic Sensor Volume Share (%), by Application 2025 & 2033
- Figure 7: North America Distributed Fiber Optic Acoustic Sensor Revenue (million), by Type 2025 & 2033
- Figure 8: North America Distributed Fiber Optic Acoustic Sensor Volume (K), by Type 2025 & 2033
- Figure 9: North America Distributed Fiber Optic Acoustic Sensor Revenue Share (%), by Type 2025 & 2033
- Figure 10: North America Distributed Fiber Optic Acoustic Sensor Volume Share (%), by Type 2025 & 2033
- Figure 11: North America Distributed Fiber Optic Acoustic Sensor Revenue (million), by Country 2025 & 2033
- Figure 12: North America Distributed Fiber Optic Acoustic Sensor Volume (K), by Country 2025 & 2033
- Figure 13: North America Distributed Fiber Optic Acoustic Sensor Revenue Share (%), by Country 2025 & 2033
- Figure 14: North America Distributed Fiber Optic Acoustic Sensor Volume Share (%), by Country 2025 & 2033
- Figure 15: South America Distributed Fiber Optic Acoustic Sensor Revenue (million), by Application 2025 & 2033
- Figure 16: South America Distributed Fiber Optic Acoustic Sensor Volume (K), by Application 2025 & 2033
- Figure 17: South America Distributed Fiber Optic Acoustic Sensor Revenue Share (%), by Application 2025 & 2033
- Figure 18: South America Distributed Fiber Optic Acoustic Sensor Volume Share (%), by Application 2025 & 2033
- Figure 19: South America Distributed Fiber Optic Acoustic Sensor Revenue (million), by Type 2025 & 2033
- Figure 20: South America Distributed Fiber Optic Acoustic Sensor Volume (K), by Type 2025 & 2033
- Figure 21: South America Distributed Fiber Optic Acoustic Sensor Revenue Share (%), by Type 2025 & 2033
- Figure 22: South America Distributed Fiber Optic Acoustic Sensor Volume Share (%), by Type 2025 & 2033
- Figure 23: South America Distributed Fiber Optic Acoustic Sensor Revenue (million), by Country 2025 & 2033
- Figure 24: South America Distributed Fiber Optic Acoustic Sensor Volume (K), by Country 2025 & 2033
- Figure 25: South America Distributed Fiber Optic Acoustic Sensor Revenue Share (%), by Country 2025 & 2033
- Figure 26: South America Distributed Fiber Optic Acoustic Sensor Volume Share (%), by Country 2025 & 2033
- Figure 27: Europe Distributed Fiber Optic Acoustic Sensor Revenue (million), by Application 2025 & 2033
- Figure 28: Europe Distributed Fiber Optic Acoustic Sensor Volume (K), by Application 2025 & 2033
- Figure 29: Europe Distributed Fiber Optic Acoustic Sensor Revenue Share (%), by Application 2025 & 2033
- Figure 30: Europe Distributed Fiber Optic Acoustic Sensor Volume Share (%), by Application 2025 & 2033
- Figure 31: Europe Distributed Fiber Optic Acoustic Sensor Revenue (million), by Type 2025 & 2033
- Figure 32: Europe Distributed Fiber Optic Acoustic Sensor Volume (K), by Type 2025 & 2033
- Figure 33: Europe Distributed Fiber Optic Acoustic Sensor Revenue Share (%), by Type 2025 & 2033
- Figure 34: Europe Distributed Fiber Optic Acoustic Sensor Volume Share (%), by Type 2025 & 2033
- Figure 35: Europe Distributed Fiber Optic Acoustic Sensor Revenue (million), by Country 2025 & 2033
- Figure 36: Europe Distributed Fiber Optic Acoustic Sensor Volume (K), by Country 2025 & 2033
- Figure 37: Europe Distributed Fiber Optic Acoustic Sensor Revenue Share (%), by Country 2025 & 2033
- Figure 38: Europe Distributed Fiber Optic Acoustic Sensor Volume Share (%), by Country 2025 & 2033
- Figure 39: Middle East & Africa Distributed Fiber Optic Acoustic Sensor Revenue (million), by Application 2025 & 2033
- Figure 40: Middle East & Africa Distributed Fiber Optic Acoustic Sensor Volume (K), by Application 2025 & 2033
- Figure 41: Middle East & Africa Distributed Fiber Optic Acoustic Sensor Revenue Share (%), by Application 2025 & 2033
- Figure 42: Middle East & Africa Distributed Fiber Optic Acoustic Sensor Volume Share (%), by Application 2025 & 2033
- Figure 43: Middle East & Africa Distributed Fiber Optic Acoustic Sensor Revenue (million), by Type 2025 & 2033
- Figure 44: Middle East & Africa Distributed Fiber Optic Acoustic Sensor Volume (K), by Type 2025 & 2033
- Figure 45: Middle East & Africa Distributed Fiber Optic Acoustic Sensor Revenue Share (%), by Type 2025 & 2033
- Figure 46: Middle East & Africa Distributed Fiber Optic Acoustic Sensor Volume Share (%), by Type 2025 & 2033
- Figure 47: Middle East & Africa Distributed Fiber Optic Acoustic Sensor Revenue (million), by Country 2025 & 2033
- Figure 48: Middle East & Africa Distributed Fiber Optic Acoustic Sensor Volume (K), by Country 2025 & 2033
- Figure 49: Middle East & Africa Distributed Fiber Optic Acoustic Sensor Revenue Share (%), by Country 2025 & 2033
- Figure 50: Middle East & Africa Distributed Fiber Optic Acoustic Sensor Volume Share (%), by Country 2025 & 2033
- Figure 51: Asia Pacific Distributed Fiber Optic Acoustic Sensor Revenue (million), by Application 2025 & 2033
- Figure 52: Asia Pacific Distributed Fiber Optic Acoustic Sensor Volume (K), by Application 2025 & 2033
- Figure 53: Asia Pacific Distributed Fiber Optic Acoustic Sensor Revenue Share (%), by Application 2025 & 2033
- Figure 54: Asia Pacific Distributed Fiber Optic Acoustic Sensor Volume Share (%), by Application 2025 & 2033
- Figure 55: Asia Pacific Distributed Fiber Optic Acoustic Sensor Revenue (million), by Type 2025 & 2033
- Figure 56: Asia Pacific Distributed Fiber Optic Acoustic Sensor Volume (K), by Type 2025 & 2033
- Figure 57: Asia Pacific Distributed Fiber Optic Acoustic Sensor Revenue Share (%), by Type 2025 & 2033
- Figure 58: Asia Pacific Distributed Fiber Optic Acoustic Sensor Volume Share (%), by Type 2025 & 2033
- Figure 59: Asia Pacific Distributed Fiber Optic Acoustic Sensor Revenue (million), by Country 2025 & 2033
- Figure 60: Asia Pacific Distributed Fiber Optic Acoustic Sensor Volume (K), by Country 2025 & 2033
- Figure 61: Asia Pacific Distributed Fiber Optic Acoustic Sensor Revenue Share (%), by Country 2025 & 2033
- Figure 62: Asia Pacific Distributed Fiber Optic Acoustic Sensor Volume Share (%), by Country 2025 & 2033
List of Tables
- Table 1: Global Distributed Fiber Optic Acoustic Sensor Revenue million Forecast, by Application 2020 & 2033
- Table 2: Global Distributed Fiber Optic Acoustic Sensor Volume K Forecast, by Application 2020 & 2033
- Table 3: Global Distributed Fiber Optic Acoustic Sensor Revenue million Forecast, by Type 2020 & 2033
- Table 4: Global Distributed Fiber Optic Acoustic Sensor Volume K Forecast, by Type 2020 & 2033
- Table 5: Global Distributed Fiber Optic Acoustic Sensor Revenue million Forecast, by Region 2020 & 2033
- Table 6: Global Distributed Fiber Optic Acoustic Sensor Volume K Forecast, by Region 2020 & 2033
- Table 7: Global Distributed Fiber Optic Acoustic Sensor Revenue million Forecast, by Application 2020 & 2033
- Table 8: Global Distributed Fiber Optic Acoustic Sensor Volume K Forecast, by Application 2020 & 2033
- Table 9: Global Distributed Fiber Optic Acoustic Sensor Revenue million Forecast, by Type 2020 & 2033
- Table 10: Global Distributed Fiber Optic Acoustic Sensor Volume K Forecast, by Type 2020 & 2033
- Table 11: Global Distributed Fiber Optic Acoustic Sensor Revenue million Forecast, by Country 2020 & 2033
- Table 12: Global Distributed Fiber Optic Acoustic Sensor Volume K Forecast, by Country 2020 & 2033
- Table 13: United States Distributed Fiber Optic Acoustic Sensor Revenue (million) Forecast, by Application 2020 & 2033
- Table 14: United States Distributed Fiber Optic Acoustic Sensor Volume (K) Forecast, by Application 2020 & 2033
- Table 15: Canada Distributed Fiber Optic Acoustic Sensor Revenue (million) Forecast, by Application 2020 & 2033
- Table 16: Canada Distributed Fiber Optic Acoustic Sensor Volume (K) Forecast, by Application 2020 & 2033
- Table 17: Mexico Distributed Fiber Optic Acoustic Sensor Revenue (million) Forecast, by Application 2020 & 2033
- Table 18: Mexico Distributed Fiber Optic Acoustic Sensor Volume (K) Forecast, by Application 2020 & 2033
- Table 19: Global Distributed Fiber Optic Acoustic Sensor Revenue million Forecast, by Application 2020 & 2033
- Table 20: Global Distributed Fiber Optic Acoustic Sensor Volume K Forecast, by Application 2020 & 2033
- Table 21: Global Distributed Fiber Optic Acoustic Sensor Revenue million Forecast, by Type 2020 & 2033
- Table 22: Global Distributed Fiber Optic Acoustic Sensor Volume K Forecast, by Type 2020 & 2033
- Table 23: Global Distributed Fiber Optic Acoustic Sensor Revenue million Forecast, by Country 2020 & 2033
- Table 24: Global Distributed Fiber Optic Acoustic Sensor Volume K Forecast, by Country 2020 & 2033
- Table 25: Brazil Distributed Fiber Optic Acoustic Sensor Revenue (million) Forecast, by Application 2020 & 2033
- Table 26: Brazil Distributed Fiber Optic Acoustic Sensor Volume (K) Forecast, by Application 2020 & 2033
- Table 27: Argentina Distributed Fiber Optic Acoustic Sensor Revenue (million) Forecast, by Application 2020 & 2033
- Table 28: Argentina Distributed Fiber Optic Acoustic Sensor Volume (K) Forecast, by Application 2020 & 2033
- Table 29: Rest of South America Distributed Fiber Optic Acoustic Sensor Revenue (million) Forecast, by Application 2020 & 2033
- Table 30: Rest of South America Distributed Fiber Optic Acoustic Sensor Volume (K) Forecast, by Application 2020 & 2033
- Table 31: Global Distributed Fiber Optic Acoustic Sensor Revenue million Forecast, by Application 2020 & 2033
- Table 32: Global Distributed Fiber Optic Acoustic Sensor Volume K Forecast, by Application 2020 & 2033
- Table 33: Global Distributed Fiber Optic Acoustic Sensor Revenue million Forecast, by Type 2020 & 2033
- Table 34: Global Distributed Fiber Optic Acoustic Sensor Volume K Forecast, by Type 2020 & 2033
- Table 35: Global Distributed Fiber Optic Acoustic Sensor Revenue million Forecast, by Country 2020 & 2033
- Table 36: Global Distributed Fiber Optic Acoustic Sensor Volume K Forecast, by Country 2020 & 2033
- Table 37: United Kingdom Distributed Fiber Optic Acoustic Sensor Revenue (million) Forecast, by Application 2020 & 2033
- Table 38: United Kingdom Distributed Fiber Optic Acoustic Sensor Volume (K) Forecast, by Application 2020 & 2033
- Table 39: Germany Distributed Fiber Optic Acoustic Sensor Revenue (million) Forecast, by Application 2020 & 2033
- Table 40: Germany Distributed Fiber Optic Acoustic Sensor Volume (K) Forecast, by Application 2020 & 2033
- Table 41: France Distributed Fiber Optic Acoustic Sensor Revenue (million) Forecast, by Application 2020 & 2033
- Table 42: France Distributed Fiber Optic Acoustic Sensor Volume (K) Forecast, by Application 2020 & 2033
- Table 43: Italy Distributed Fiber Optic Acoustic Sensor Revenue (million) Forecast, by Application 2020 & 2033
- Table 44: Italy Distributed Fiber Optic Acoustic Sensor Volume (K) Forecast, by Application 2020 & 2033
- Table 45: Spain Distributed Fiber Optic Acoustic Sensor Revenue (million) Forecast, by Application 2020 & 2033
- Table 46: Spain Distributed Fiber Optic Acoustic Sensor Volume (K) Forecast, by Application 2020 & 2033
- Table 47: Russia Distributed Fiber Optic Acoustic Sensor Revenue (million) Forecast, by Application 2020 & 2033
- Table 48: Russia Distributed Fiber Optic Acoustic Sensor Volume (K) Forecast, by Application 2020 & 2033
- Table 49: Benelux Distributed Fiber Optic Acoustic Sensor Revenue (million) Forecast, by Application 2020 & 2033
- Table 50: Benelux Distributed Fiber Optic Acoustic Sensor Volume (K) Forecast, by Application 2020 & 2033
- Table 51: Nordics Distributed Fiber Optic Acoustic Sensor Revenue (million) Forecast, by Application 2020 & 2033
- Table 52: Nordics Distributed Fiber Optic Acoustic Sensor Volume (K) Forecast, by Application 2020 & 2033
- Table 53: Rest of Europe Distributed Fiber Optic Acoustic Sensor Revenue (million) Forecast, by Application 2020 & 2033
- Table 54: Rest of Europe Distributed Fiber Optic Acoustic Sensor Volume (K) Forecast, by Application 2020 & 2033
- Table 55: Global Distributed Fiber Optic Acoustic Sensor Revenue million Forecast, by Application 2020 & 2033
- Table 56: Global Distributed Fiber Optic Acoustic Sensor Volume K Forecast, by Application 2020 & 2033
- Table 57: Global Distributed Fiber Optic Acoustic Sensor Revenue million Forecast, by Type 2020 & 2033
- Table 58: Global Distributed Fiber Optic Acoustic Sensor Volume K Forecast, by Type 2020 & 2033
- Table 59: Global Distributed Fiber Optic Acoustic Sensor Revenue million Forecast, by Country 2020 & 2033
- Table 60: Global Distributed Fiber Optic Acoustic Sensor Volume K Forecast, by Country 2020 & 2033
- Table 61: Turkey Distributed Fiber Optic Acoustic Sensor Revenue (million) Forecast, by Application 2020 & 2033
- Table 62: Turkey Distributed Fiber Optic Acoustic Sensor Volume (K) Forecast, by Application 2020 & 2033
- Table 63: Israel Distributed Fiber Optic Acoustic Sensor Revenue (million) Forecast, by Application 2020 & 2033
- Table 64: Israel Distributed Fiber Optic Acoustic Sensor Volume (K) Forecast, by Application 2020 & 2033
- Table 65: GCC Distributed Fiber Optic Acoustic Sensor Revenue (million) Forecast, by Application 2020 & 2033
- Table 66: GCC Distributed Fiber Optic Acoustic Sensor Volume (K) Forecast, by Application 2020 & 2033
- Table 67: North Africa Distributed Fiber Optic Acoustic Sensor Revenue (million) Forecast, by Application 2020 & 2033
- Table 68: North Africa Distributed Fiber Optic Acoustic Sensor Volume (K) Forecast, by Application 2020 & 2033
- Table 69: South Africa Distributed Fiber Optic Acoustic Sensor Revenue (million) Forecast, by Application 2020 & 2033
- Table 70: South Africa Distributed Fiber Optic Acoustic Sensor Volume (K) Forecast, by Application 2020 & 2033
- Table 71: Rest of Middle East & Africa Distributed Fiber Optic Acoustic Sensor Revenue (million) Forecast, by Application 2020 & 2033
- Table 72: Rest of Middle East & Africa Distributed Fiber Optic Acoustic Sensor Volume (K) Forecast, by Application 2020 & 2033
- Table 73: Global Distributed Fiber Optic Acoustic Sensor Revenue million Forecast, by Application 2020 & 2033
- Table 74: Global Distributed Fiber Optic Acoustic Sensor Volume K Forecast, by Application 2020 & 2033
- Table 75: Global Distributed Fiber Optic Acoustic Sensor Revenue million Forecast, by Type 2020 & 2033
- Table 76: Global Distributed Fiber Optic Acoustic Sensor Volume K Forecast, by Type 2020 & 2033
- Table 77: Global Distributed Fiber Optic Acoustic Sensor Revenue million Forecast, by Country 2020 & 2033
- Table 78: Global Distributed Fiber Optic Acoustic Sensor Volume K Forecast, by Country 2020 & 2033
- Table 79: China Distributed Fiber Optic Acoustic Sensor Revenue (million) Forecast, by Application 2020 & 2033
- Table 80: China Distributed Fiber Optic Acoustic Sensor Volume (K) Forecast, by Application 2020 & 2033
- Table 81: India Distributed Fiber Optic Acoustic Sensor Revenue (million) Forecast, by Application 2020 & 2033
- Table 82: India Distributed Fiber Optic Acoustic Sensor Volume (K) Forecast, by Application 2020 & 2033
- Table 83: Japan Distributed Fiber Optic Acoustic Sensor Revenue (million) Forecast, by Application 2020 & 2033
- Table 84: Japan Distributed Fiber Optic Acoustic Sensor Volume (K) Forecast, by Application 2020 & 2033
- Table 85: South Korea Distributed Fiber Optic Acoustic Sensor Revenue (million) Forecast, by Application 2020 & 2033
- Table 86: South Korea Distributed Fiber Optic Acoustic Sensor Volume (K) Forecast, by Application 2020 & 2033
- Table 87: ASEAN Distributed Fiber Optic Acoustic Sensor Revenue (million) Forecast, by Application 2020 & 2033
- Table 88: ASEAN Distributed Fiber Optic Acoustic Sensor Volume (K) Forecast, by Application 2020 & 2033
- Table 89: Oceania Distributed Fiber Optic Acoustic Sensor Revenue (million) Forecast, by Application 2020 & 2033
- Table 90: Oceania Distributed Fiber Optic Acoustic Sensor Volume (K) Forecast, by Application 2020 & 2033
- Table 91: Rest of Asia Pacific Distributed Fiber Optic Acoustic Sensor Revenue (million) Forecast, by Application 2020 & 2033
- Table 92: Rest of Asia Pacific Distributed Fiber Optic Acoustic Sensor Volume (K) Forecast, by Application 2020 & 2033
Frequently Asked Questions
1. What is the projected Compound Annual Growth Rate (CAGR) of the Distributed Fiber Optic Acoustic Sensor?
The projected CAGR is approximately XXX%.
2. Which companies are prominent players in the Distributed Fiber Optic Acoustic Sensor?
Key companies in the market include AGIOE, Siemens, ABB, Schneider Electric, Honeywell, General Electric, Rockwell Automation, Emerson Electric, Mitsubishi Electric, Eaton Corporation, Danaher Corporation, Johnson Controls, Toshiba Corporation, Hitachi Ltd., Corning Incorporated, Prysmian Group.
3. What are the main segments of the Distributed Fiber Optic Acoustic Sensor?
The market segments include Application, Type.
4. Can you provide details about the market size?
The market size is estimated to be USD XXX million as of 2022.
5. What are some drivers contributing to market growth?
N/A
6. What are the notable trends driving market growth?
N/A
7. Are there any restraints impacting market growth?
N/A
8. Can you provide examples of recent developments in the market?
N/A
9. What pricing options are available for accessing the report?
Pricing options include single-user, multi-user, and enterprise licenses priced at USD 3950.00, USD 5925.00, and USD 7900.00 respectively.
10. Is the market size provided in terms of value or volume?
The market size is provided in terms of value, measured in million and volume, measured in K.
11. Are there any specific market keywords associated with the report?
Yes, the market keyword associated with the report is "Distributed Fiber Optic Acoustic Sensor," which aids in identifying and referencing the specific market segment covered.
12. How do I determine which pricing option suits my needs best?
The pricing options vary based on user requirements and access needs. Individual users may opt for single-user licenses, while businesses requiring broader access may choose multi-user or enterprise licenses for cost-effective access to the report.
13. Are there any additional resources or data provided in the Distributed Fiber Optic Acoustic Sensor report?
While the report offers comprehensive insights, it's advisable to review the specific contents or supplementary materials provided to ascertain if additional resources or data are available.
14. How can I stay updated on further developments or reports in the Distributed Fiber Optic Acoustic Sensor?
To stay informed about further developments, trends, and reports in the Distributed Fiber Optic Acoustic Sensor, consider subscribing to industry newsletters, following relevant companies and organizations, or regularly checking reputable industry news sources and publications.
Methodology
Step 1 - Identification of Relevant Samples Size from Population Database


Step 2 - Approaches for Defining Global Market Size (Value, Volume* & Price*)

Note*: In applicable scenarios
Step 3 - Data Sources
Primary Research
- Web Analytics
- Survey Reports
- Research Institute
- Latest Research Reports
- Opinion Leaders
Secondary Research
- Annual Reports
- White Paper
- Latest Press Release
- Industry Association
- Paid Database
- Investor Presentations

Step 4 - Data Triangulation
Involves using different sources of information in order to increase the validity of a study
These sources are likely to be stakeholders in a program - participants, other researchers, program staff, other community members, and so on.
Then we put all data in single framework & apply various statistical tools to find out the dynamic on the market.
During the analysis stage, feedback from the stakeholder groups would be compared to determine areas of agreement as well as areas of divergence

