

Key Insights
The global Display Driver Integrated Circuit (DDIC) market is projected for significant expansion, anticipated to reach 9467.18 million by 2025, with a Compound Annual Growth Rate (CAGR) of 6.6% from the base year 2025 through 2033. This growth is propelled by the increasing demand for advanced display technologies across consumer electronics, smart devices, and automotive sectors. Key drivers include the rising adoption of high-resolution displays and the widespread integration of OLED and advanced LCD technologies in smartphones, tablets, notebooks, and large-screen televisions. The automotive industry's growing reliance on in-car displays for infotainment and Advanced Driver-Assistance Systems (ADAS) also presents a substantial growth opportunity. Continuous innovation in display panel technology, focusing on thinner, more flexible, and energy-efficient designs, further fuels the need for advanced DDICs, thereby stimulating market expansion.
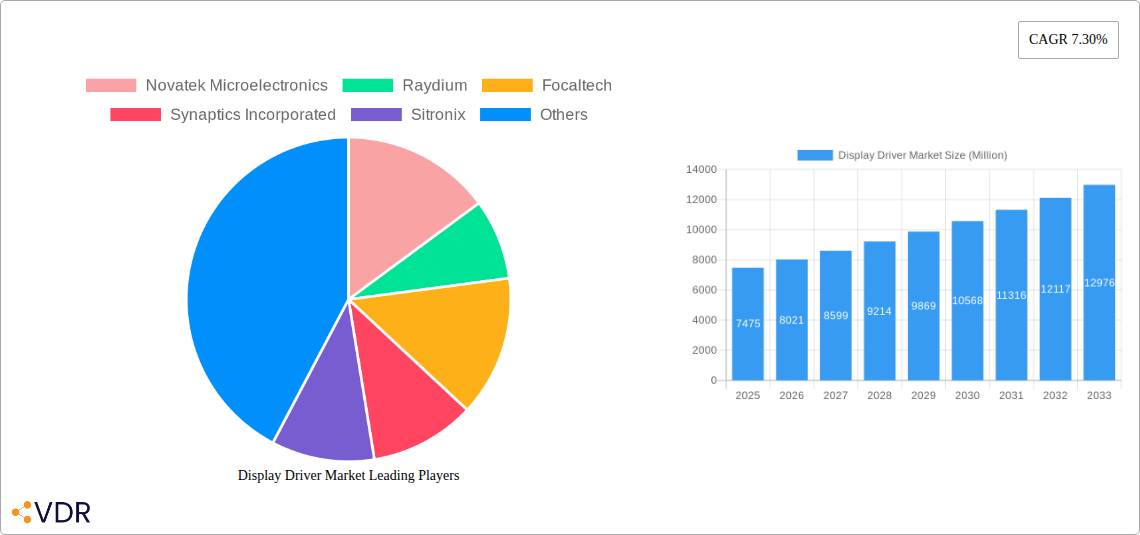
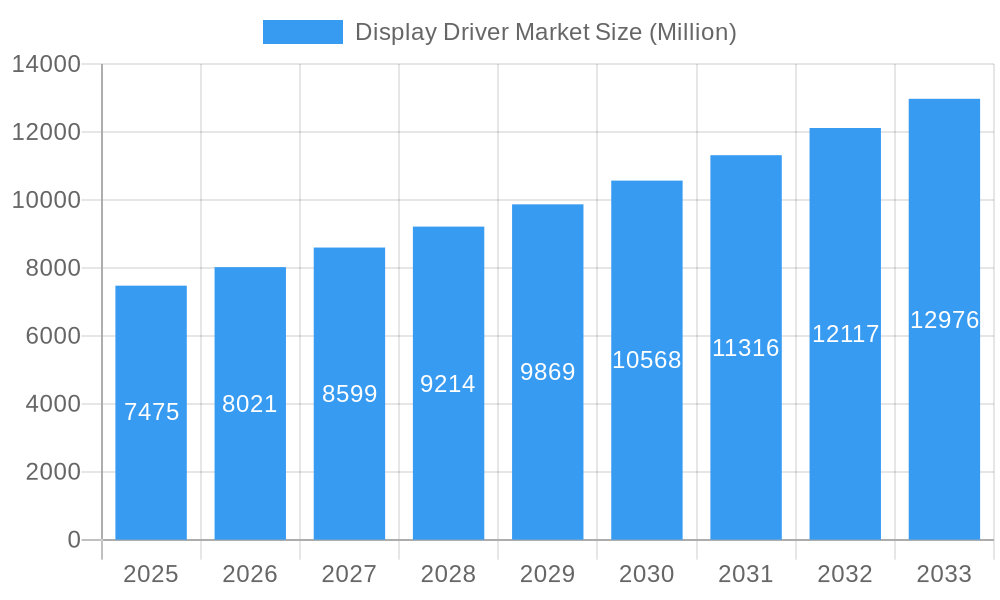
Display Driver Market Market Size (In Billion)
The market is segmented by form factor into Large DDICs and Small and Medium DDICs, serving diverse display sizes and complexities. Applications encompass LCDs for desktop monitors, notebook PCs, LCD TVs, tablets, and smartphones, as well as OLED displays for televisions and smartphones. Geographically, China is expected to lead the DDIC market, leveraging its robust manufacturing infrastructure and vast consumer electronics market. Taiwan and Korea are also pivotal regions, home to major foundries and display panel manufacturers. The Americas and other regions contribute to global demand, especially with the proliferation of automotive and specialized display applications. Leading industry participants, including Novatek Microelectronics, Raydium, Focaltech, Synaptics Incorporated, Himax, and Samsung Electronics Co Ltd, are actively pursuing innovation and portfolio expansion to secure market share amidst evolving industry demands.
Display Driver Market Company Market Share
Display Driver Market: Comprehensive Analysis & Future Outlook (2019-2033)
This comprehensive report offers an in-depth analysis of the global Display Driver Integrated Circuit (DDIC) market, forecasting its trajectory from 2019 to 2033, with a base and estimated year of 2025. We delve into the intricate dynamics, growth drivers, regional dominance, product landscape, and the competitive environment that shapes this critical semiconductor segment. The report meticulously examines market size evolution, technological advancements, and end-user trends across various form factors and applications, providing actionable insights for stakeholders.
Display Driver Market Market Dynamics & Structure
The Display Driver IC (DDIC) market is characterized by a moderate to high level of concentration, with a few key players holding significant market share. Technological innovation is the primary driver of growth, fueled by the relentless demand for higher resolution, faster refresh rates, and enhanced display functionalities across consumer electronics and automotive applications. Regulatory frameworks, particularly concerning energy efficiency and manufacturing standards, also play a role in shaping product development and market entry. Competitive product substitutes, such as alternative display technologies and integrated solutions, pose a continuous challenge, necessitating ongoing innovation. End-user demographics, particularly the growing demand for sophisticated mobile devices and advanced automotive infotainment systems, are central to market expansion. Mergers and acquisitions (M&A) trends are observed as companies seek to consolidate their market position, acquire new technologies, or expand their product portfolios. For instance, a recent acquisition valued at approximately $500 million consolidated expertise in high-performance DDICs for premium automotive displays. Innovation barriers include the significant R&D investment required for cutting-edge technologies like advanced OLED drivers and the lengthy qualification cycles for automotive components, often exceeding two years.
Display Driver Market Growth Trends & Insights
The global Display Driver IC market is poised for robust expansion, driven by escalating demand across a multitude of electronic devices and the burgeoning automotive sector. The market size evolution is projected to witness a significant Compound Annual Growth Rate (CAGR) of approximately 8.5% from 2025 to 2033, reaching an estimated market value of $15,000 million units by the end of the forecast period. This growth is underpinned by increasing adoption rates of high-definition displays in smartphones, tablets, laptops, and televisions. The proliferation of wearable devices and the growing popularity of foldable displays further contribute to this upward trend. Technological disruptions, such as advancements in OLED and micro-LED display technologies, are creating new market segments and driving innovation in DDIC design. These technologies offer superior contrast ratios, wider color gamuts, and enhanced power efficiency, demanding more sophisticated driver solutions. Consumer behavior shifts, including a growing preference for immersive entertainment experiences and advanced in-car digital interfaces, are accelerating the adoption of premium display technologies, consequently boosting the demand for high-performance DDICs. The market penetration of advanced display technologies, particularly in emerging economies, is expected to surge, creating substantial growth opportunities. For example, the adoption of OLED displays in mid-range smartphones is anticipated to increase by 20% within the next three years. The continuous innovation in display panel manufacturing also necessitates corresponding advancements in DDIC capabilities to fully leverage these improvements, ensuring seamless integration and optimal performance.
Dominant Regions, Countries, or Segments in Display Driver Market
The Display Driver IC market's dominance is significantly influenced by geographical manufacturing hubs and consumption centers, with Asia Pacific, particularly China and Taiwan, emerging as the leading region. These countries are not only major manufacturing centers for consumer electronics but also significant consumers of display technologies. China, with its vast domestic market for smartphones, televisions, and other electronic devices, represents a colossal demand driver. Taiwan, home to leading semiconductor foundries and panel manufacturers, plays a crucial role in the supply chain and technological innovation. The region's dominance is further solidified by strong government support for the semiconductor industry, robust R&D investments, and a highly skilled workforce.
Within the Form Factor segment, Large DDIC is anticipated to experience substantial growth, driven by the increasing demand for larger displays in televisions, monitors, and automotive infotainment systems. While Small and Medium DDICs continue to dominate in terms of unit volume due to the massive smartphone market, the value segment is increasingly being shaped by larger, more complex displays.
In terms of Application, the LCD segment, particularly Desktop Monitors and Notebook PCs, will continue to be a major contributor, fueled by the ongoing trend of remote work and an increased reliance on personal computing devices. However, the OLED segment, encompassing OLED TVs and OLED Smartphones, is exhibiting the highest growth potential. The superior visual quality, power efficiency, and design flexibility offered by OLED technology are driving its adoption in premium consumer electronics and increasingly in automotive applications. The LCD Smartphone segment, while mature, still represents a significant volume driver, especially in developing markets.
Key drivers of dominance in Asia Pacific include:
- Manufacturing Ecosystem: A well-established ecosystem of panel manufacturers, semiconductor foundries, and electronics assemblers.
- Consumer Demand: A massive and growing consumer base for electronic devices.
- Government Policies: Favorable policies and incentives for the semiconductor industry.
- Technological Advancements: Continuous innovation in display technologies, often originating from companies in Taiwan and South Korea.
- Supply Chain Integration: Seamless integration of upstream and downstream supply chain components.
The Automotive application, a sub-segment within the broader "Others" category for now, is rapidly emerging as a critical growth accelerator, with significant investments in advanced driver-assistance systems (ADAS) and in-car entertainment systems demanding sophisticated display solutions.
Display Driver Market Product Landscape
The Display Driver IC market is characterized by a continuous stream of product innovations focused on enhancing visual performance, reducing power consumption, and enabling new display form factors. Leading players are developing advanced solutions for high-resolution OLED and micro-LED displays, offering superior contrast, color accuracy, and faster response times. Product advancements include integrated functionalities such as power management units and timing controllers within a single chip, leading to smaller form factors and reduced system complexity. Performance metrics like ultra-low power consumption for mobile devices, high refresh rates for gaming monitors, and automotive-grade reliability for in-car displays are key selling propositions. Unique selling propositions often lie in proprietary technologies that enable seamless integration with flexible or foldable displays, or specialized drivers for specific automotive applications like head-up displays and digital cockpits.
Key Drivers, Barriers & Challenges in Display Driver Market
Key Drivers:
- Growing Demand for Advanced Displays: The increasing consumer preference for higher resolution, better color reproduction, and faster refresh rates in smartphones, TVs, monitors, and tablets.
- Automotive Sector Expansion: The burgeoning demand for sophisticated in-car infotainment systems, digital cockpits, and ADAS displays.
- Technological Advancements in Display Panels: Innovations in OLED, Micro-LED, and other emerging display technologies necessitate advanced DDIC solutions.
- Growth of Wearable Devices and Foldable Phones: These niche but growing markets require specialized, low-power, and flexible DDICs.
Barriers & Challenges:
- Supply Chain Disruptions and Geopolitical Tensions: Volatility in raw material availability and geopolitical factors can impact production and pricing. The global chip shortage experienced in previous years highlighted these vulnerabilities, leading to price increases of up to 30% for certain DDIC components.
- Intense Competition and Price Pressure: The highly competitive nature of the semiconductor industry, particularly in consumer electronics, leads to significant price pressure on DDIC manufacturers.
- High R&D Costs and Long Development Cycles: Developing cutting-edge DDIC technology requires substantial investment and lengthy qualification processes, especially for automotive applications.
- Evolving Technological Standards: The rapid pace of technological evolution requires constant adaptation and investment to remain competitive.
Emerging Opportunities in Display Driver Market
Emerging opportunities in the Display Driver IC market are significantly concentrated in the automotive sector, with the increasing adoption of advanced displays for central information displays, instrument clusters, and head-up displays. The development of specialized DDICs for augmented reality (AR) and virtual reality (VR) devices presents another promising avenue, requiring ultra-low latency and high-resolution capabilities. Furthermore, the expansion of smart home devices and the Internet of Things (IoT) ecosystem will drive demand for compact and energy-efficient DDICs for various embedded display applications. The growing interest in sustainable and energy-efficient displays also opens doors for DDICs optimized for lower power consumption.
Growth Accelerators in the Display Driver Market Industry
Several key catalysts are propelling long-term growth in the Display Driver IC market. Technological breakthroughs in process node advancements and new material integration are enabling the creation of more powerful and efficient DDICs. Strategic partnerships between semiconductor manufacturers, panel makers, and end-product developers are crucial for fostering innovation and accelerating product development cycles. Market expansion strategies, particularly targeting the rapidly growing automotive and industrial display segments in emerging economies, are key to unlocking new revenue streams. The increasing demand for customized display solutions tailored to specific application needs is also a significant growth accelerator, pushing companies to offer more specialized and integrated DDIC offerings.
Key Players Shaping the Display Driver Market Market
- Novatek Microelectronics
- Raydium
- Focaltech
- Synaptics Incorporated
- Sitronix
- Himax
- Samsung Electronics Co Ltd
- Magnachip Semiconductor
- Fitipower Integrated Technology Inc
- LX Semicon
- MediaTek
Notable Milestones in Display Driver Market Sector
- August 2022: LX Semicon, a South Korean chip fabless firm, has formed a research team dedicated to developing automobile display driver ICs. The team will build display driver ICs for central information display, cluster, head-up display, and other displays on automobiles.
- May 2022: Tesla improved the Model S and Model X with a new motorized swivel function for the center screen. The feature facilitates a better viewing experience along with more in-car entertainment. The company's two flagship vehicles got a new large horizontal center display better for watching videos and a backseat display powered by a gaming computer.
In-Depth Display Driver Market Market Outlook
The Display Driver IC market is set for a period of sustained growth, driven by the convergence of advanced display technologies and evolving consumer and industrial demands. Growth accelerators such as the increasing penetration of OLED and Micro-LED in consumer electronics and the rapid expansion of automotive display applications will continue to fuel market expansion. Strategic partnerships and investments in R&D for next-generation displays will be critical for market leaders to maintain their competitive edge. The outlook is highly positive, with significant opportunities arising from the integration of AI and advanced processing capabilities within DDICs to enable smarter and more interactive display experiences across all sectors.
Display Driver Market Segmentation
-
1. Form Factor
- 1.1. Large DDIC
- 1.2. Small and Medium DDIC
-
2. Application
-
2.1. LCD
- 2.1.1. Desktop Monitor
- 2.1.2. Notebook PC
- 2.1.3. LCD TV
- 2.1.4. Tablet
- 2.1.5. LCD Smartphone
- 2.1.6. Others
-
2.2. OLED
- 2.2.1. OLED TV
- 2.2.2. OLED Smartphone
-
2.1. LCD
-
3. Geography
- 3.1. China
- 3.2. Taiwan
- 3.3. Korea
- 3.4. Americas
- 3.5. Others
Display Driver Market Segmentation By Geography
- 1. China
- 2. Taiwan
- 3. Korea
- 4. Americas
- 5. Others
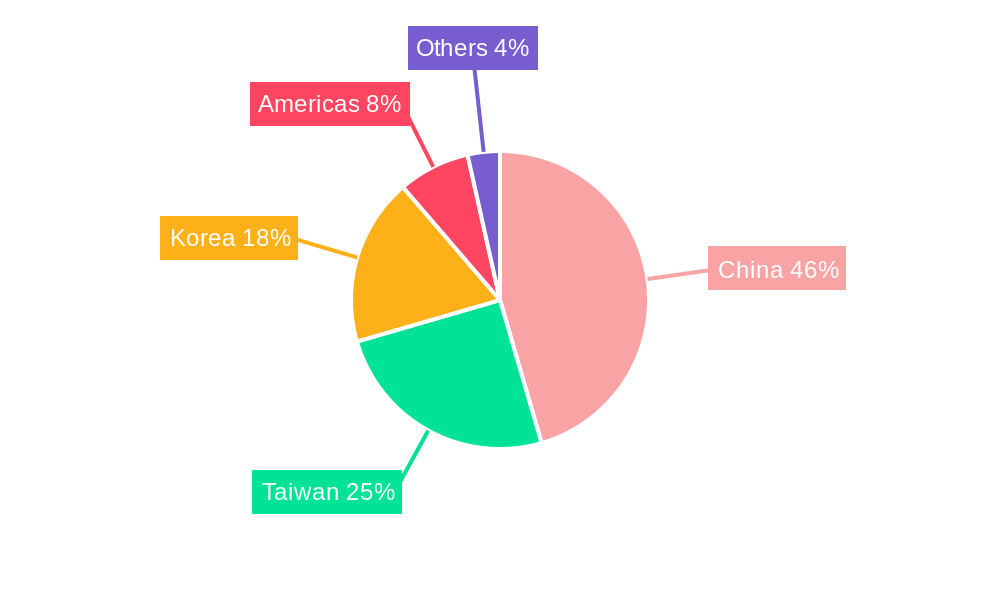
Display Driver Market Regional Market Share
Geographic Coverage of Display Driver Market
Display Driver Market REPORT HIGHLIGHTS
| Aspects | Details |
|---|---|
| Study Period | 2020-2034 |
| Base Year | 2025 |
| Estimated Year | 2026 |
| Forecast Period | 2026-2034 |
| Historical Period | 2020-2025 |
| Growth Rate | CAGR of 6.6% from 2020-2034 |
| Segmentation |
|
Table of Contents
- 1. Introduction
- 1.1. Research Scope
- 1.2. Market Segmentation
- 1.3. Research Objective
- 1.4. Definitions and Assumptions
- 2. Executive Summary
- 2.1. Market Snapshot
- 3. Market Dynamics
- 3.1. Market Drivers
- 3.2. Market Restrains
- 3.3. Market Trends
- 3.4. Market Opportunities
- 4. Market Factor Analysis
- 4.1. Porters Five Forces
- 4.1.1. Bargaining Power of Suppliers
- 4.1.2. Bargaining Power of Buyers
- 4.1.3. Threat of New Entrants
- 4.1.4. Threat of Substitutes
- 4.1.5. Competitive Rivalry
- 4.2. PESTEL analysis
- 4.3. BCG Analysis
- 4.3.1. Stars (High Growth, High Market Share)
- 4.3.2. Cash Cows (Low Growth, High Market Share)
- 4.3.3. Question Mark (High Growth, Low Market Share)
- 4.3.4. Dogs (Low Growth, Low Market Share)
- 4.4. Ansoff Matrix Analysis
- 4.5. Supply Chain Analysis
- 4.6. Regulatory Landscape
- 4.7. Current Market Potential and Opportunity Assessment (TAM–SAM–SOM Framework)
- 4.8. VDR Analyst Note
- 4.1. Porters Five Forces
- 5. Market Analysis, Insights and Forecast 2021-2033
- 5.1. Market Analysis, Insights and Forecast - by Form Factor
- 5.1.1. Large DDIC
- 5.1.2. Small and Medium DDIC
- 5.2. Market Analysis, Insights and Forecast - by Application
- 5.2.1. LCD
- 5.2.1.1. Desktop Monitor
- 5.2.1.2. Notebook PC
- 5.2.1.3. LCD TV
- 5.2.1.4. Tablet
- 5.2.1.5. LCD Smartphone
- 5.2.1.6. Others
- 5.2.2. OLED
- 5.2.2.1. OLED TV
- 5.2.2.2. OLED Smartphone
- 5.2.1. LCD
- 5.3. Market Analysis, Insights and Forecast - by Geography
- 5.3.1. China
- 5.3.2. Taiwan
- 5.3.3. Korea
- 5.3.4. Americas
- 5.3.5. Others
- 5.4. Market Analysis, Insights and Forecast - by Region
- 5.4.1. China
- 5.4.2. Taiwan
- 5.4.3. Korea
- 5.4.4. Americas
- 5.4.5. Others
- 5.1. Market Analysis, Insights and Forecast - by Form Factor
- 6. Global Display Driver Market Analysis, Insights and Forecast, 2021-2033
- 6.1. Market Analysis, Insights and Forecast - by Form Factor
- 6.1.1. Large DDIC
- 6.1.2. Small and Medium DDIC
- 6.2. Market Analysis, Insights and Forecast - by Application
- 6.2.1. LCD
- 6.2.1.1. Desktop Monitor
- 6.2.1.2. Notebook PC
- 6.2.1.3. LCD TV
- 6.2.1.4. Tablet
- 6.2.1.5. LCD Smartphone
- 6.2.1.6. Others
- 6.2.2. OLED
- 6.2.2.1. OLED TV
- 6.2.2.2. OLED Smartphone
- 6.2.1. LCD
- 6.3. Market Analysis, Insights and Forecast - by Geography
- 6.3.1. China
- 6.3.2. Taiwan
- 6.3.3. Korea
- 6.3.4. Americas
- 6.3.5. Others
- 6.1. Market Analysis, Insights and Forecast - by Form Factor
- 7. China Display Driver Market Analysis, Insights and Forecast, 2021-2033
- 7.1. Market Analysis, Insights and Forecast - by Form Factor
- 7.1.1. Large DDIC
- 7.1.2. Small and Medium DDIC
- 7.2. Market Analysis, Insights and Forecast - by Application
- 7.2.1. LCD
- 7.2.1.1. Desktop Monitor
- 7.2.1.2. Notebook PC
- 7.2.1.3. LCD TV
- 7.2.1.4. Tablet
- 7.2.1.5. LCD Smartphone
- 7.2.1.6. Others
- 7.2.2. OLED
- 7.2.2.1. OLED TV
- 7.2.2.2. OLED Smartphone
- 7.2.1. LCD
- 7.3. Market Analysis, Insights and Forecast - by Geography
- 7.3.1. China
- 7.3.2. Taiwan
- 7.3.3. Korea
- 7.3.4. Americas
- 7.3.5. Others
- 7.1. Market Analysis, Insights and Forecast - by Form Factor
- 8. Taiwan Display Driver Market Analysis, Insights and Forecast, 2021-2033
- 8.1. Market Analysis, Insights and Forecast - by Form Factor
- 8.1.1. Large DDIC
- 8.1.2. Small and Medium DDIC
- 8.2. Market Analysis, Insights and Forecast - by Application
- 8.2.1. LCD
- 8.2.1.1. Desktop Monitor
- 8.2.1.2. Notebook PC
- 8.2.1.3. LCD TV
- 8.2.1.4. Tablet
- 8.2.1.5. LCD Smartphone
- 8.2.1.6. Others
- 8.2.2. OLED
- 8.2.2.1. OLED TV
- 8.2.2.2. OLED Smartphone
- 8.2.1. LCD
- 8.3. Market Analysis, Insights and Forecast - by Geography
- 8.3.1. China
- 8.3.2. Taiwan
- 8.3.3. Korea
- 8.3.4. Americas
- 8.3.5. Others
- 8.1. Market Analysis, Insights and Forecast - by Form Factor
- 9. Korea Display Driver Market Analysis, Insights and Forecast, 2021-2033
- 9.1. Market Analysis, Insights and Forecast - by Form Factor
- 9.1.1. Large DDIC
- 9.1.2. Small and Medium DDIC
- 9.2. Market Analysis, Insights and Forecast - by Application
- 9.2.1. LCD
- 9.2.1.1. Desktop Monitor
- 9.2.1.2. Notebook PC
- 9.2.1.3. LCD TV
- 9.2.1.4. Tablet
- 9.2.1.5. LCD Smartphone
- 9.2.1.6. Others
- 9.2.2. OLED
- 9.2.2.1. OLED TV
- 9.2.2.2. OLED Smartphone
- 9.2.1. LCD
- 9.3. Market Analysis, Insights and Forecast - by Geography
- 9.3.1. China
- 9.3.2. Taiwan
- 9.3.3. Korea
- 9.3.4. Americas
- 9.3.5. Others
- 9.1. Market Analysis, Insights and Forecast - by Form Factor
- 10. Americas Display Driver Market Analysis, Insights and Forecast, 2021-2033
- 10.1. Market Analysis, Insights and Forecast - by Form Factor
- 10.1.1. Large DDIC
- 10.1.2. Small and Medium DDIC
- 10.2. Market Analysis, Insights and Forecast - by Application
- 10.2.1. LCD
- 10.2.1.1. Desktop Monitor
- 10.2.1.2. Notebook PC
- 10.2.1.3. LCD TV
- 10.2.1.4. Tablet
- 10.2.1.5. LCD Smartphone
- 10.2.1.6. Others
- 10.2.2. OLED
- 10.2.2.1. OLED TV
- 10.2.2.2. OLED Smartphone
- 10.2.1. LCD
- 10.3. Market Analysis, Insights and Forecast - by Geography
- 10.3.1. China
- 10.3.2. Taiwan
- 10.3.3. Korea
- 10.3.4. Americas
- 10.3.5. Others
- 10.1. Market Analysis, Insights and Forecast - by Form Factor
- 11. Others Display Driver Market Analysis, Insights and Forecast, 2021-2033
- 11.1. Market Analysis, Insights and Forecast - by Form Factor
- 11.1.1. Large DDIC
- 11.1.2. Small and Medium DDIC
- 11.2. Market Analysis, Insights and Forecast - by Application
- 11.2.1. LCD
- 11.2.1.1. Desktop Monitor
- 11.2.1.2. Notebook PC
- 11.2.1.3. LCD TV
- 11.2.1.4. Tablet
- 11.2.1.5. LCD Smartphone
- 11.2.1.6. Others
- 11.2.2. OLED
- 11.2.2.1. OLED TV
- 11.2.2.2. OLED Smartphone
- 11.2.1. LCD
- 11.3. Market Analysis, Insights and Forecast - by Geography
- 11.3.1. China
- 11.3.2. Taiwan
- 11.3.3. Korea
- 11.3.4. Americas
- 11.3.5. Others
- 11.1. Market Analysis, Insights and Forecast - by Form Factor
- 12. Competitive Analysis
- 12.1. Company Profiles
- 12.1.1 Novatek Microelectronics
- 12.1.1.1. Company Overview
- 12.1.1.2. Products
- 12.1.1.3. Company Financials
- 12.1.1.4. SWOT Analysis
- 12.1.2 Raydium
- 12.1.2.1. Company Overview
- 12.1.2.2. Products
- 12.1.2.3. Company Financials
- 12.1.2.4. SWOT Analysis
- 12.1.3 Focaltech
- 12.1.3.1. Company Overview
- 12.1.3.2. Products
- 12.1.3.3. Company Financials
- 12.1.3.4. SWOT Analysis
- 12.1.4 Synaptics Incorporated
- 12.1.4.1. Company Overview
- 12.1.4.2. Products
- 12.1.4.3. Company Financials
- 12.1.4.4. SWOT Analysis
- 12.1.5 Sitronix
- 12.1.5.1. Company Overview
- 12.1.5.2. Products
- 12.1.5.3. Company Financials
- 12.1.5.4. SWOT Analysis
- 12.1.6 Himax
- 12.1.6.1. Company Overview
- 12.1.6.2. Products
- 12.1.6.3. Company Financials
- 12.1.6.4. SWOT Analysis
- 12.1.7 Samsung Electronics Co Ltd
- 12.1.7.1. Company Overview
- 12.1.7.2. Products
- 12.1.7.3. Company Financials
- 12.1.7.4. SWOT Analysis
- 12.1.8 Magnachip Semiconductor
- 12.1.8.1. Company Overview
- 12.1.8.2. Products
- 12.1.8.3. Company Financials
- 12.1.8.4. SWOT Analysis
- 12.1.9 Fitipower Integrated Technology Inc
- 12.1.9.1. Company Overview
- 12.1.9.2. Products
- 12.1.9.3. Company Financials
- 12.1.9.4. SWOT Analysis
- 12.1.10 LX Semicon*List Not Exhaustive
- 12.1.10.1. Company Overview
- 12.1.10.2. Products
- 12.1.10.3. Company Financials
- 12.1.10.4. SWOT Analysis
- 12.1.11 MediaTek
- 12.1.11.1. Company Overview
- 12.1.11.2. Products
- 12.1.11.3. Company Financials
- 12.1.11.4. SWOT Analysis
- 12.1.1 Novatek Microelectronics
- 12.2. Market Entropy
- 12.2.1 Company's Key Areas Served
- 12.2.2 Recent Developments
- 12.3. Company Market Share Analysis 2025
- 12.3.1 Top 5 Companies Market Share Analysis
- 12.3.2 Top 3 Companies Market Share Analysis
- 12.4. List of Potential Customers
- 13. Research Methodology
List of Figures
- Figure 1: Global Display Driver Market Revenue Breakdown (million, %) by Region 2025 & 2033
- Figure 2: China Display Driver Market Revenue (million), by Form Factor 2025 & 2033
- Figure 3: China Display Driver Market Revenue Share (%), by Form Factor 2025 & 2033
- Figure 4: China Display Driver Market Revenue (million), by Application 2025 & 2033
- Figure 5: China Display Driver Market Revenue Share (%), by Application 2025 & 2033
- Figure 6: China Display Driver Market Revenue (million), by Geography 2025 & 2033
- Figure 7: China Display Driver Market Revenue Share (%), by Geography 2025 & 2033
- Figure 8: China Display Driver Market Revenue (million), by Country 2025 & 2033
- Figure 9: China Display Driver Market Revenue Share (%), by Country 2025 & 2033
- Figure 10: Taiwan Display Driver Market Revenue (million), by Form Factor 2025 & 2033
- Figure 11: Taiwan Display Driver Market Revenue Share (%), by Form Factor 2025 & 2033
- Figure 12: Taiwan Display Driver Market Revenue (million), by Application 2025 & 2033
- Figure 13: Taiwan Display Driver Market Revenue Share (%), by Application 2025 & 2033
- Figure 14: Taiwan Display Driver Market Revenue (million), by Geography 2025 & 2033
- Figure 15: Taiwan Display Driver Market Revenue Share (%), by Geography 2025 & 2033
- Figure 16: Taiwan Display Driver Market Revenue (million), by Country 2025 & 2033
- Figure 17: Taiwan Display Driver Market Revenue Share (%), by Country 2025 & 2033
- Figure 18: Korea Display Driver Market Revenue (million), by Form Factor 2025 & 2033
- Figure 19: Korea Display Driver Market Revenue Share (%), by Form Factor 2025 & 2033
- Figure 20: Korea Display Driver Market Revenue (million), by Application 2025 & 2033
- Figure 21: Korea Display Driver Market Revenue Share (%), by Application 2025 & 2033
- Figure 22: Korea Display Driver Market Revenue (million), by Geography 2025 & 2033
- Figure 23: Korea Display Driver Market Revenue Share (%), by Geography 2025 & 2033
- Figure 24: Korea Display Driver Market Revenue (million), by Country 2025 & 2033
- Figure 25: Korea Display Driver Market Revenue Share (%), by Country 2025 & 2033
- Figure 26: Americas Display Driver Market Revenue (million), by Form Factor 2025 & 2033
- Figure 27: Americas Display Driver Market Revenue Share (%), by Form Factor 2025 & 2033
- Figure 28: Americas Display Driver Market Revenue (million), by Application 2025 & 2033
- Figure 29: Americas Display Driver Market Revenue Share (%), by Application 2025 & 2033
- Figure 30: Americas Display Driver Market Revenue (million), by Geography 2025 & 2033
- Figure 31: Americas Display Driver Market Revenue Share (%), by Geography 2025 & 2033
- Figure 32: Americas Display Driver Market Revenue (million), by Country 2025 & 2033
- Figure 33: Americas Display Driver Market Revenue Share (%), by Country 2025 & 2033
- Figure 34: Others Display Driver Market Revenue (million), by Form Factor 2025 & 2033
- Figure 35: Others Display Driver Market Revenue Share (%), by Form Factor 2025 & 2033
- Figure 36: Others Display Driver Market Revenue (million), by Application 2025 & 2033
- Figure 37: Others Display Driver Market Revenue Share (%), by Application 2025 & 2033
- Figure 38: Others Display Driver Market Revenue (million), by Geography 2025 & 2033
- Figure 39: Others Display Driver Market Revenue Share (%), by Geography 2025 & 2033
- Figure 40: Others Display Driver Market Revenue (million), by Country 2025 & 2033
- Figure 41: Others Display Driver Market Revenue Share (%), by Country 2025 & 2033
List of Tables
- Table 1: Global Display Driver Market Revenue million Forecast, by Form Factor 2020 & 2033
- Table 2: Global Display Driver Market Revenue million Forecast, by Application 2020 & 2033
- Table 3: Global Display Driver Market Revenue million Forecast, by Geography 2020 & 2033
- Table 4: Global Display Driver Market Revenue million Forecast, by Region 2020 & 2033
- Table 5: Global Display Driver Market Revenue million Forecast, by Form Factor 2020 & 2033
- Table 6: Global Display Driver Market Revenue million Forecast, by Application 2020 & 2033
- Table 7: Global Display Driver Market Revenue million Forecast, by Geography 2020 & 2033
- Table 8: Global Display Driver Market Revenue million Forecast, by Country 2020 & 2033
- Table 9: Global Display Driver Market Revenue million Forecast, by Form Factor 2020 & 2033
- Table 10: Global Display Driver Market Revenue million Forecast, by Application 2020 & 2033
- Table 11: Global Display Driver Market Revenue million Forecast, by Geography 2020 & 2033
- Table 12: Global Display Driver Market Revenue million Forecast, by Country 2020 & 2033
- Table 13: Global Display Driver Market Revenue million Forecast, by Form Factor 2020 & 2033
- Table 14: Global Display Driver Market Revenue million Forecast, by Application 2020 & 2033
- Table 15: Global Display Driver Market Revenue million Forecast, by Geography 2020 & 2033
- Table 16: Global Display Driver Market Revenue million Forecast, by Country 2020 & 2033
- Table 17: Global Display Driver Market Revenue million Forecast, by Form Factor 2020 & 2033
- Table 18: Global Display Driver Market Revenue million Forecast, by Application 2020 & 2033
- Table 19: Global Display Driver Market Revenue million Forecast, by Geography 2020 & 2033
- Table 20: Global Display Driver Market Revenue million Forecast, by Country 2020 & 2033
- Table 21: Global Display Driver Market Revenue million Forecast, by Form Factor 2020 & 2033
- Table 22: Global Display Driver Market Revenue million Forecast, by Application 2020 & 2033
- Table 23: Global Display Driver Market Revenue million Forecast, by Geography 2020 & 2033
- Table 24: Global Display Driver Market Revenue million Forecast, by Country 2020 & 2033
Frequently Asked Questions
1. What is the projected Compound Annual Growth Rate (CAGR) of the Display Driver Market?
The projected CAGR is approximately 6.6%.
2. Which companies are prominent players in the Display Driver Market?
Key companies in the market include Novatek Microelectronics, Raydium, Focaltech, Synaptics Incorporated, Sitronix, Himax, Samsung Electronics Co Ltd, Magnachip Semiconductor, Fitipower Integrated Technology Inc, LX Semicon*List Not Exhaustive, MediaTek.
3. What are the main segments of the Display Driver Market?
The market segments include Form Factor, Application, Geography.
4. Can you provide details about the market size?
The market size is estimated to be USD 9467.18 million as of 2022.
5. What are some drivers contributing to market growth?
Rising Demand for LCD Panels for Mobile Devices. TVs. and PC Monitors; Increase Investment in Innovative Display for the Automotive Sector.
6. What are the notable trends driving market growth?
OLED Display Technology Drive the Market Growth.
7. Are there any restraints impacting market growth?
Vendor Lock-in is a Major Barrier to the Adoption of Pharmacy Management Systems.
8. Can you provide examples of recent developments in the market?
August 2022 - LX Semicon, a South Korean chip fabless firm, has formed a research team dedicated to developing automobile display driver ICs. The team will build display driver ICs for central information display, cluster, head-up display, and other displays on automobiles.
9. What pricing options are available for accessing the report?
Pricing options include single-user, multi-user, and enterprise licenses priced at USD 4750, USD 5250, and USD 8750 respectively.
10. Is the market size provided in terms of value or volume?
The market size is provided in terms of value, measured in million.
11. Are there any specific market keywords associated with the report?
Yes, the market keyword associated with the report is "Display Driver Market," which aids in identifying and referencing the specific market segment covered.
12. How do I determine which pricing option suits my needs best?
The pricing options vary based on user requirements and access needs. Individual users may opt for single-user licenses, while businesses requiring broader access may choose multi-user or enterprise licenses for cost-effective access to the report.
13. Are there any additional resources or data provided in the Display Driver Market report?
While the report offers comprehensive insights, it's advisable to review the specific contents or supplementary materials provided to ascertain if additional resources or data are available.
14. How can I stay updated on further developments or reports in the Display Driver Market?
To stay informed about further developments, trends, and reports in the Display Driver Market, consider subscribing to industry newsletters, following relevant companies and organizations, or regularly checking reputable industry news sources and publications.
Methodology
Step 1 - Identification of Relevant Samples Size from Population Database


Step 2 - Approaches for Defining Global Market Size (Value, Volume* & Price*)

Note*: In applicable scenarios
Step 3 - Data Sources
Primary Research
- Web Analytics
- Survey Reports
- Research Institute
- Latest Research Reports
- Opinion Leaders
Secondary Research
- Annual Reports
- White Paper
- Latest Press Release
- Industry Association
- Paid Database
- Investor Presentations

Step 4 - Data Triangulation
Involves using different sources of information in order to increase the validity of a study
These sources are likely to be stakeholders in a program - participants, other researchers, program staff, other community members, and so on.
Then we put all data in single framework & apply various statistical tools to find out the dynamic on the market.
During the analysis stage, feedback from the stakeholder groups would be compared to determine areas of agreement as well as areas of divergence