

Key Insights
The Dispersion Compensating Fiber (DCF) market is poised for significant expansion, projected to reach an estimated market size of $136 million, with a robust Compound Annual Growth Rate (CAGR) of 4.8% between 2019 and 2033. This steady growth is primarily fueled by the ever-increasing demand for higher bandwidth and faster data transmission speeds across telecommunications networks. The proliferation of fiber optic infrastructure, driven by the rollout of 5G technology and the growing adoption of cloud computing, necessitates efficient methods for managing signal degradation, particularly chromatic dispersion, which DCF effectively addresses. Furthermore, the expanding use of DCF in Data Center Interconnect (DCI) applications and the ongoing upgrades to existing optical networks are acting as substantial market drivers. The surge in video streaming, online gaming, and the Internet of Things (IoT) continues to place immense pressure on network capacity, making dispersion compensation a critical component for maintaining signal integrity and performance.
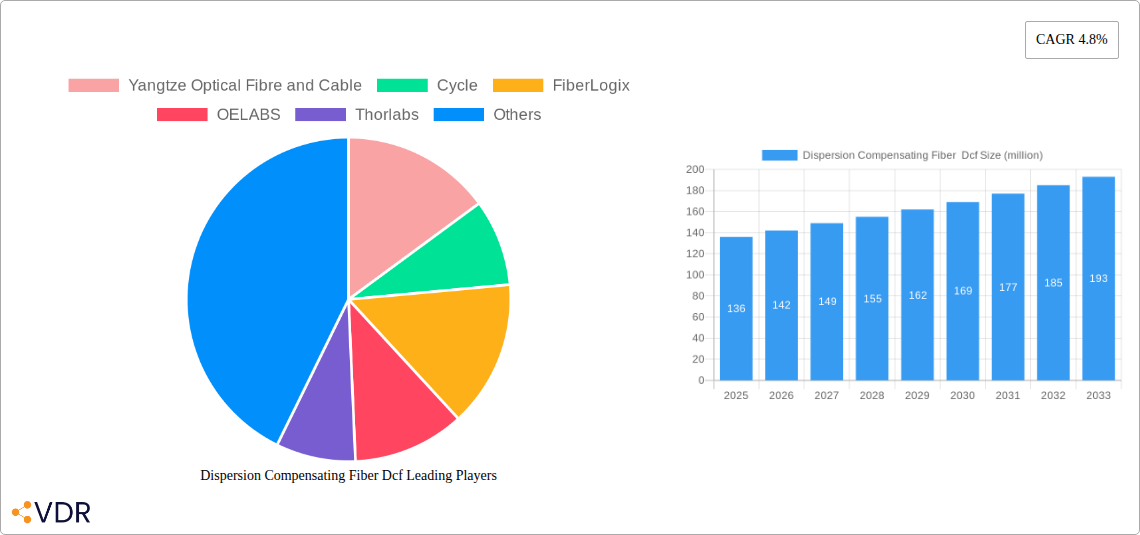
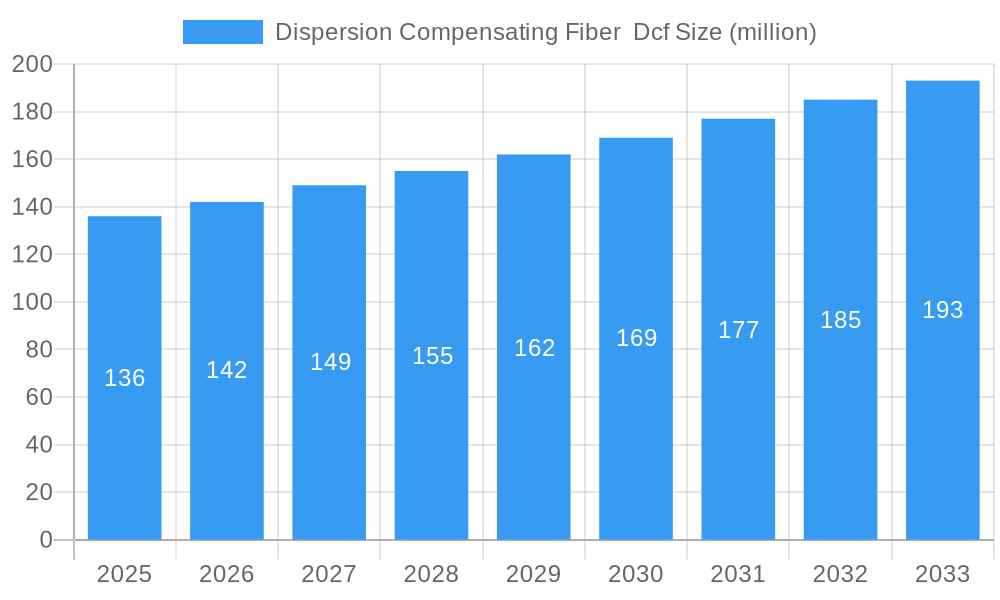
Dispersion Compensating Fiber Dcf Market Size (In Million)
The market landscape for DCF is characterized by diverse applications and evolving technological demands. DWDM (Dense Wavelength Division Multiplexing) networks represent a significant segment, leveraging DCF to maximize spectral efficiency and extend transmission distances for multiple data channels. SDH (Synchronous Digital Hierarchy) networks, while a more mature technology, continue to contribute to DCF demand for upgrades and maintenance. The CATV (Community Antenna Television) sector also utilizes DCF to ensure high-quality video signal delivery over long distances. On the type front, Single Mode Fiber remains the dominant category due to its widespread compatibility and cost-effectiveness. However, Polarization Maintaining Fiber is gaining traction in specialized applications requiring precise signal control. Geographically, the Asia Pacific region, particularly China, is expected to lead market growth due to its extensive fiber optic deployments and rapid technological advancements. North America and Europe also present substantial market opportunities, driven by ongoing network modernization and the increasing need for high-speed data services.
Dispersion Compensating Fiber Dcf Company Market Share
Dispersion Compensating Fiber Dcf Market Dynamics & Structure
The Dispersion Compensating Fiber (DCF) market is characterized by a moderate concentration of key players, with companies like Yangtze Optical Fibre and Cable, Cycle, FiberLogix, OELABS, Thorlabs, and others actively contributing to technological advancements. The primary driver for innovation is the increasing demand for high-speed data transmission, particularly in DWDM Networks and the ongoing evolution of SDH Networks. Regulatory frameworks are largely focused on ensuring product quality and interoperability, though regional variations can influence market access. Competitive product substitutes, such as electronic dispersion compensation, pose a challenge, but optical DCF remains preferred for its zero latency and superior performance in long-haul and high-bandwidth applications. End-user demographics are dominated by telecommunication operators, internet service providers, and research institutions. Mergers and acquisitions (M&A) are infrequent but strategic, aimed at consolidating market share and acquiring specialized technologies. The market is projected to see continued M&A activity as players seek to expand their portfolios and geographical reach.
- Market Concentration: Moderate, with a few leading players and several niche manufacturers.
- Technological Innovation Drivers: Demand for higher bandwidth, lower latency, and improved signal integrity in optical networks.
- Regulatory Frameworks: Primarily focused on product standards and international certifications.
- Competitive Product Substitutes: Electronic dispersion compensators, though optical DCF maintains a performance edge.
- End-User Demographics: Telecommunication operators, ISPs, data centers, and research organizations.
- M&A Trends: Strategic acquisitions to enhance product offerings and market presence.
Dispersion Compensating Fiber Dcf Growth Trends & Insights
The global Dispersion Compensating Fiber (DCF) market is experiencing robust growth, driven by the insatiable demand for higher data transmission speeds and the expansion of optical communication infrastructure worldwide. The market size is projected to reach approximately $1,200 million by 2025, with a compound annual growth rate (CAGR) of roughly 6.5% expected during the forecast period of 2025–2033. This growth is significantly fueled by the increasing deployment of Dense Wavelength Division Multiplexing (DWDM) networks, which are critical for expanding the capacity of existing fiber optic cables and enabling higher data rates over long distances. The continued upgrade and expansion of Synchronous Digital Hierarchy (SDH) networks, particularly in emerging economies, also contributes to the sustained demand for DCF.
Technological disruptions are playing a crucial role in shaping market trends. Innovations in DCF manufacturing are focusing on reducing insertion loss, improving polarization mode dispersion (PMD) compensation, and developing more compact and cost-effective solutions. The shift towards higher bit rates, such as 400 Gbps and beyond, necessitates advanced dispersion management techniques, further propelling the adoption of sophisticated DCF technologies. Consumer behavior shifts, particularly the explosion in video streaming, cloud computing, and the burgeoning Internet of Things (IoT), are indirectly driving the need for more efficient and higher-capacity telecommunication networks, thereby bolstering the DCF market.
The market penetration of DCF is increasing as network operators recognize its indispensable role in maintaining signal quality and minimizing data errors in high-speed optical systems. While electronic dispersion compensation methods exist, optical compensation using DCF is often preferred for its real-time performance and lack of latency, making it essential for critical applications like financial trading and telecommunications backbones. The overall market adoption rate is expected to remain strong, with a growing emphasis on specialized DCF types that cater to specific network requirements, such as those offering superior PMD compensation for ultra-high-speed transmissions.
Dominant Regions, Countries, or Segments in Dispersion Compensating Fiber Dcf
The global Dispersion Compensating Fiber (DCF) market's dominance is significantly influenced by regions with advanced telecommunication infrastructure and high data traffic demands. North America, particularly the United States, and Asia-Pacific, led by China, are the primary growth engines. In North America, robust investments in upgrading existing fiber networks and deploying new 5G infrastructure are driving substantial demand for DWDM networks, which heavily rely on DCF. The economic policies in the US have actively encouraged broadband expansion, creating a fertile ground for optical fiber technologies.
In the Asia-Pacific region, China's aggressive push for nationwide fiber optic deployment, coupled with its status as a global manufacturing hub for telecommunications equipment, makes it a critical market. Government initiatives to expand high-speed internet access and the rapid growth of data centers contribute to the significant market share for DCF. Furthermore, countries like South Korea and Japan are also major contributors due to their established technological prowess and continuous network enhancements.
The application segment of DWDM Networks is unequivocally the dominant driver of market growth. The increasing need for higher spectral efficiency and transmission capacity in telecommunication networks makes DCF an indispensable component for compensating the chromatic dispersion inherent in high-speed DWDM systems. The projected market size for DWDM applications is approximately $750 million by 2025, representing over 60% of the total DCF market. This dominance is further bolstered by the continued evolution of DWDM technology, with upgrades to 400 Gbps and beyond demanding more precise and effective dispersion management.
Within the Type segment, Single Mode Fiber (SMF)-based DCF holds the largest market share, estimated at around $950 million by 2025. This is primarily because SMF is the backbone of most modern optical communication networks, and the need for dispersion compensation is most pronounced in these high-bandwidth, long-haul applications. Polarization Maintaining Fiber (PMF)-based DCF, while crucial for specific applications like coherent communications and sensing, represents a smaller but growing niche market. The growth potential for PMF DCF is linked to advancements in specialized optical technologies and the increasing adoption of coherent detection schemes.
Dispersion Compensating Fiber Dcf Product Landscape
The Dispersion Compensating Fiber (DCF) product landscape is marked by continuous innovation focused on enhancing performance and reducing cost. Manufacturers are developing DCF with lower insertion loss and flatter dispersion profiles across a wider range of wavelengths, crucial for efficient DWDM network operation. Advanced manufacturing techniques are enabling the production of DCF with tighter tolerances, leading to improved signal integrity and reduced PMD. Emerging products include specialized DCF designs for ultra-high-speed transmission (400 Gbps and above) and compact DCF modules that simplify integration into existing network architectures. The unique selling propositions lie in superior chromatic dispersion compensation capabilities, minimal signal degradation, and reliability in demanding environments.
Key Drivers, Barriers & Challenges in Dispersion Compensating Fiber Dcf
The Dispersion Compensating Fiber (DCF) market is propelled by the escalating demand for high-speed data transmission, driven by cloud computing, 5G rollout, and the burgeoning IoT. Advancements in optical network technology, particularly DWDM, necessitate effective dispersion management, directly boosting DCF adoption. Furthermore, government initiatives to expand broadband infrastructure globally serve as significant growth accelerators.
Key barriers include the high cost of manufacturing specialized DCF and the ongoing development of alternative solutions like electronic dispersion compensation. Supply chain disruptions, though less prevalent now, can still pose challenges. Regulatory hurdles, primarily related to product standardization and interoperability, also require careful navigation by manufacturers. Competitive pressures from established and emerging players intensify the need for continuous innovation and cost optimization.
Emerging Opportunities in Dispersion Compensating Fiber Dcf
Emerging opportunities for Dispersion Compensating Fiber (DCF) lie in the expanding data center interconnect (DCI) market, where high-speed, low-latency communication between data centers is paramount. The development of coherent optical communication technologies, which are highly sensitive to dispersion, presents a growing demand for advanced DCF with superior PMD compensation. Furthermore, the rollout of next-generation telecommunication networks beyond 5G, such as 6G, will require even more sophisticated dispersion management solutions, opening new avenues for innovation. Untapped markets in developing regions with rapidly growing internet penetration also offer significant growth potential.
Growth Accelerators in the Dispersion Compensating Fiber Dcf Industry
Several factors are accelerating growth in the Dispersion Compensating Fiber (DCF) industry. Technological breakthroughs in material science and fiber fabrication are leading to DCF with enhanced performance characteristics, such as reduced attenuation and improved stability. Strategic partnerships between DCF manufacturers and network equipment vendors are crucial for integrating DCF solutions seamlessly into next-generation network architectures. Market expansion strategies, including the penetration of emerging economies and the development of customized DCF solutions for specific applications like submarine cables, are also contributing to sustained growth. The increasing investment in research and development by key players ensures a pipeline of innovative products.
Key Players Shaping the Dispersion Compensating Fiber Dcf Market
- Yangtze Optical Fibre and Cable
- Cycle
- FiberLogix
- OELABS
- Thorlabs
Notable Milestones in Dispersion Compensating Fiber Dcf Sector
- 2019: Introduction of ultra-low PMD DCF for 400Gbps DWDM systems.
- 2020: Development of cost-effective manufacturing processes for high-performance DCF.
- 2021: Increased adoption of DCF in data center interconnect applications.
- 2022: Advancements in DCF design for improved thermal stability and reliability.
- 2023: Strategic collaborations for the development of next-generation dispersion compensation technologies.
- 2024: Growing demand for specialized DCF to support coherent optical communication systems.
In-Depth Dispersion Compensating Fiber Dcf Market Outlook
The Dispersion Compensating Fiber (DCF) market is poised for sustained and robust growth, driven by the unyielding demand for higher bandwidth and faster data transmission rates across telecommunication networks. Continued technological advancements in fiber optics, coupled with significant global investments in digital infrastructure, including 5G and beyond, will serve as primary growth accelerators. Strategic partnerships and the expansion into emerging markets are expected to further bolster market penetration. The future outlook indicates a market increasingly focused on specialized, high-performance DCF solutions tailored for advanced optical networking applications, ensuring its critical role in the evolution of global communication.
Dispersion Compensating Fiber Dcf Segmentation
-
1. Application
- 1.1. DWDM Networks
- 1.2. SDH Network
- 1.3. CATV
- 1.4. Others
-
2. Type
- 2.1. Single Mode Fiber
- 2.2. Polarization Maintaining Fiber
- 2.3. Others
Dispersion Compensating Fiber Dcf Segmentation By Geography
-
1. North America
- 1.1. United States
- 1.2. Canada
- 1.3. Mexico
-
2. South America
- 2.1. Brazil
- 2.2. Argentina
- 2.3. Rest of South America
-
3. Europe
- 3.1. United Kingdom
- 3.2. Germany
- 3.3. France
- 3.4. Italy
- 3.5. Spain
- 3.6. Russia
- 3.7. Benelux
- 3.8. Nordics
- 3.9. Rest of Europe
-
4. Middle East & Africa
- 4.1. Turkey
- 4.2. Israel
- 4.3. GCC
- 4.4. North Africa
- 4.5. South Africa
- 4.6. Rest of Middle East & Africa
-
5. Asia Pacific
- 5.1. China
- 5.2. India
- 5.3. Japan
- 5.4. South Korea
- 5.5. ASEAN
- 5.6. Oceania
- 5.7. Rest of Asia Pacific
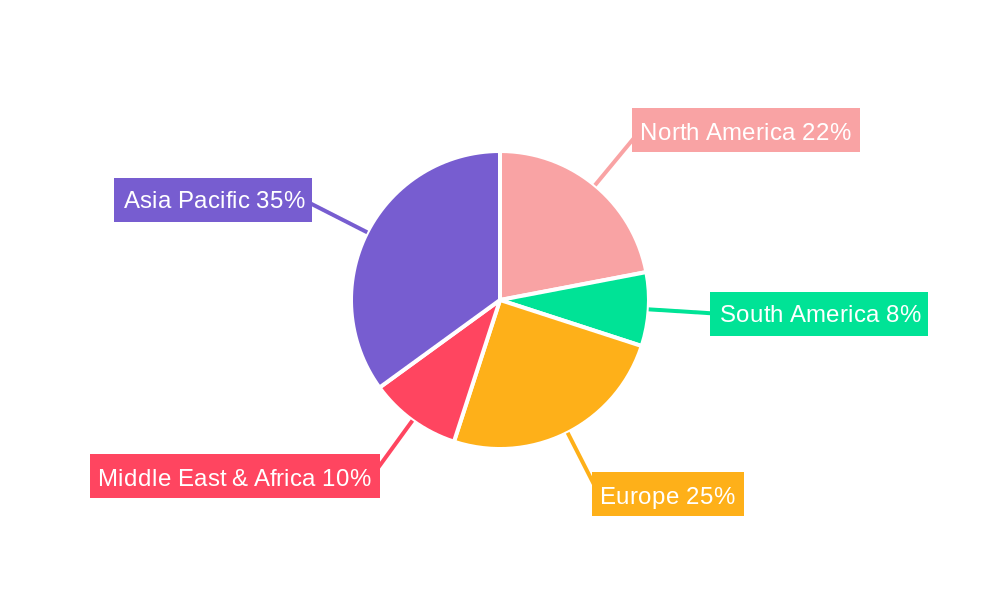
Dispersion Compensating Fiber Dcf Regional Market Share
Geographic Coverage of Dispersion Compensating Fiber Dcf
Dispersion Compensating Fiber Dcf REPORT HIGHLIGHTS
| Aspects | Details |
|---|---|
| Study Period | 2020-2034 |
| Base Year | 2025 |
| Estimated Year | 2026 |
| Forecast Period | 2026-2034 |
| Historical Period | 2020-2025 |
| Growth Rate | CAGR of 4.8% from 2020-2034 |
| Segmentation |
|
Table of Contents
- 1. Introduction
- 1.1. Research Scope
- 1.2. Market Segmentation
- 1.3. Research Methodology
- 1.4. Definitions and Assumptions
- 2. Executive Summary
- 2.1. Introduction
- 3. Market Dynamics
- 3.1. Introduction
- 3.2. Market Drivers
- 3.3. Market Restrains
- 3.4. Market Trends
- 4. Market Factor Analysis
- 4.1. Porters Five Forces
- 4.2. Supply/Value Chain
- 4.3. PESTEL analysis
- 4.4. Market Entropy
- 4.5. Patent/Trademark Analysis
- 5. Global Dispersion Compensating Fiber Dcf Analysis, Insights and Forecast, 2020-2032
- 5.1. Market Analysis, Insights and Forecast - by Application
- 5.1.1. DWDM Networks
- 5.1.2. SDH Network
- 5.1.3. CATV
- 5.1.4. Others
- 5.2. Market Analysis, Insights and Forecast - by Type
- 5.2.1. Single Mode Fiber
- 5.2.2. Polarization Maintaining Fiber
- 5.2.3. Others
- 5.3. Market Analysis, Insights and Forecast - by Region
- 5.3.1. North America
- 5.3.2. South America
- 5.3.3. Europe
- 5.3.4. Middle East & Africa
- 5.3.5. Asia Pacific
- 5.1. Market Analysis, Insights and Forecast - by Application
- 6. North America Dispersion Compensating Fiber Dcf Analysis, Insights and Forecast, 2020-2032
- 6.1. Market Analysis, Insights and Forecast - by Application
- 6.1.1. DWDM Networks
- 6.1.2. SDH Network
- 6.1.3. CATV
- 6.1.4. Others
- 6.2. Market Analysis, Insights and Forecast - by Type
- 6.2.1. Single Mode Fiber
- 6.2.2. Polarization Maintaining Fiber
- 6.2.3. Others
- 6.1. Market Analysis, Insights and Forecast - by Application
- 7. South America Dispersion Compensating Fiber Dcf Analysis, Insights and Forecast, 2020-2032
- 7.1. Market Analysis, Insights and Forecast - by Application
- 7.1.1. DWDM Networks
- 7.1.2. SDH Network
- 7.1.3. CATV
- 7.1.4. Others
- 7.2. Market Analysis, Insights and Forecast - by Type
- 7.2.1. Single Mode Fiber
- 7.2.2. Polarization Maintaining Fiber
- 7.2.3. Others
- 7.1. Market Analysis, Insights and Forecast - by Application
- 8. Europe Dispersion Compensating Fiber Dcf Analysis, Insights and Forecast, 2020-2032
- 8.1. Market Analysis, Insights and Forecast - by Application
- 8.1.1. DWDM Networks
- 8.1.2. SDH Network
- 8.1.3. CATV
- 8.1.4. Others
- 8.2. Market Analysis, Insights and Forecast - by Type
- 8.2.1. Single Mode Fiber
- 8.2.2. Polarization Maintaining Fiber
- 8.2.3. Others
- 8.1. Market Analysis, Insights and Forecast - by Application
- 9. Middle East & Africa Dispersion Compensating Fiber Dcf Analysis, Insights and Forecast, 2020-2032
- 9.1. Market Analysis, Insights and Forecast - by Application
- 9.1.1. DWDM Networks
- 9.1.2. SDH Network
- 9.1.3. CATV
- 9.1.4. Others
- 9.2. Market Analysis, Insights and Forecast - by Type
- 9.2.1. Single Mode Fiber
- 9.2.2. Polarization Maintaining Fiber
- 9.2.3. Others
- 9.1. Market Analysis, Insights and Forecast - by Application
- 10. Asia Pacific Dispersion Compensating Fiber Dcf Analysis, Insights and Forecast, 2020-2032
- 10.1. Market Analysis, Insights and Forecast - by Application
- 10.1.1. DWDM Networks
- 10.1.2. SDH Network
- 10.1.3. CATV
- 10.1.4. Others
- 10.2. Market Analysis, Insights and Forecast - by Type
- 10.2.1. Single Mode Fiber
- 10.2.2. Polarization Maintaining Fiber
- 10.2.3. Others
- 10.1. Market Analysis, Insights and Forecast - by Application
- 11. Competitive Analysis
- 11.1. Global Market Share Analysis 2025
- 11.2. Company Profiles
- 11.2.1 Yangtze Optical Fibre and Cable
- 11.2.1.1. Overview
- 11.2.1.2. Products
- 11.2.1.3. SWOT Analysis
- 11.2.1.4. Recent Developments
- 11.2.1.5. Financials (Based on Availability)
- 11.2.2 Cycle
- 11.2.2.1. Overview
- 11.2.2.2. Products
- 11.2.2.3. SWOT Analysis
- 11.2.2.4. Recent Developments
- 11.2.2.5. Financials (Based on Availability)
- 11.2.3 FiberLogix
- 11.2.3.1. Overview
- 11.2.3.2. Products
- 11.2.3.3. SWOT Analysis
- 11.2.3.4. Recent Developments
- 11.2.3.5. Financials (Based on Availability)
- 11.2.4 OELABS
- 11.2.4.1. Overview
- 11.2.4.2. Products
- 11.2.4.3. SWOT Analysis
- 11.2.4.4. Recent Developments
- 11.2.4.5. Financials (Based on Availability)
- 11.2.5 Thorlabs
- 11.2.5.1. Overview
- 11.2.5.2. Products
- 11.2.5.3. SWOT Analysis
- 11.2.5.4. Recent Developments
- 11.2.5.5. Financials (Based on Availability)
- 11.2.1 Yangtze Optical Fibre and Cable
List of Figures
- Figure 1: Global Dispersion Compensating Fiber Dcf Revenue Breakdown (million, %) by Region 2025 & 2033
- Figure 2: Global Dispersion Compensating Fiber Dcf Volume Breakdown (K, %) by Region 2025 & 2033
- Figure 3: North America Dispersion Compensating Fiber Dcf Revenue (million), by Application 2025 & 2033
- Figure 4: North America Dispersion Compensating Fiber Dcf Volume (K), by Application 2025 & 2033
- Figure 5: North America Dispersion Compensating Fiber Dcf Revenue Share (%), by Application 2025 & 2033
- Figure 6: North America Dispersion Compensating Fiber Dcf Volume Share (%), by Application 2025 & 2033
- Figure 7: North America Dispersion Compensating Fiber Dcf Revenue (million), by Type 2025 & 2033
- Figure 8: North America Dispersion Compensating Fiber Dcf Volume (K), by Type 2025 & 2033
- Figure 9: North America Dispersion Compensating Fiber Dcf Revenue Share (%), by Type 2025 & 2033
- Figure 10: North America Dispersion Compensating Fiber Dcf Volume Share (%), by Type 2025 & 2033
- Figure 11: North America Dispersion Compensating Fiber Dcf Revenue (million), by Country 2025 & 2033
- Figure 12: North America Dispersion Compensating Fiber Dcf Volume (K), by Country 2025 & 2033
- Figure 13: North America Dispersion Compensating Fiber Dcf Revenue Share (%), by Country 2025 & 2033
- Figure 14: North America Dispersion Compensating Fiber Dcf Volume Share (%), by Country 2025 & 2033
- Figure 15: South America Dispersion Compensating Fiber Dcf Revenue (million), by Application 2025 & 2033
- Figure 16: South America Dispersion Compensating Fiber Dcf Volume (K), by Application 2025 & 2033
- Figure 17: South America Dispersion Compensating Fiber Dcf Revenue Share (%), by Application 2025 & 2033
- Figure 18: South America Dispersion Compensating Fiber Dcf Volume Share (%), by Application 2025 & 2033
- Figure 19: South America Dispersion Compensating Fiber Dcf Revenue (million), by Type 2025 & 2033
- Figure 20: South America Dispersion Compensating Fiber Dcf Volume (K), by Type 2025 & 2033
- Figure 21: South America Dispersion Compensating Fiber Dcf Revenue Share (%), by Type 2025 & 2033
- Figure 22: South America Dispersion Compensating Fiber Dcf Volume Share (%), by Type 2025 & 2033
- Figure 23: South America Dispersion Compensating Fiber Dcf Revenue (million), by Country 2025 & 2033
- Figure 24: South America Dispersion Compensating Fiber Dcf Volume (K), by Country 2025 & 2033
- Figure 25: South America Dispersion Compensating Fiber Dcf Revenue Share (%), by Country 2025 & 2033
- Figure 26: South America Dispersion Compensating Fiber Dcf Volume Share (%), by Country 2025 & 2033
- Figure 27: Europe Dispersion Compensating Fiber Dcf Revenue (million), by Application 2025 & 2033
- Figure 28: Europe Dispersion Compensating Fiber Dcf Volume (K), by Application 2025 & 2033
- Figure 29: Europe Dispersion Compensating Fiber Dcf Revenue Share (%), by Application 2025 & 2033
- Figure 30: Europe Dispersion Compensating Fiber Dcf Volume Share (%), by Application 2025 & 2033
- Figure 31: Europe Dispersion Compensating Fiber Dcf Revenue (million), by Type 2025 & 2033
- Figure 32: Europe Dispersion Compensating Fiber Dcf Volume (K), by Type 2025 & 2033
- Figure 33: Europe Dispersion Compensating Fiber Dcf Revenue Share (%), by Type 2025 & 2033
- Figure 34: Europe Dispersion Compensating Fiber Dcf Volume Share (%), by Type 2025 & 2033
- Figure 35: Europe Dispersion Compensating Fiber Dcf Revenue (million), by Country 2025 & 2033
- Figure 36: Europe Dispersion Compensating Fiber Dcf Volume (K), by Country 2025 & 2033
- Figure 37: Europe Dispersion Compensating Fiber Dcf Revenue Share (%), by Country 2025 & 2033
- Figure 38: Europe Dispersion Compensating Fiber Dcf Volume Share (%), by Country 2025 & 2033
- Figure 39: Middle East & Africa Dispersion Compensating Fiber Dcf Revenue (million), by Application 2025 & 2033
- Figure 40: Middle East & Africa Dispersion Compensating Fiber Dcf Volume (K), by Application 2025 & 2033
- Figure 41: Middle East & Africa Dispersion Compensating Fiber Dcf Revenue Share (%), by Application 2025 & 2033
- Figure 42: Middle East & Africa Dispersion Compensating Fiber Dcf Volume Share (%), by Application 2025 & 2033
- Figure 43: Middle East & Africa Dispersion Compensating Fiber Dcf Revenue (million), by Type 2025 & 2033
- Figure 44: Middle East & Africa Dispersion Compensating Fiber Dcf Volume (K), by Type 2025 & 2033
- Figure 45: Middle East & Africa Dispersion Compensating Fiber Dcf Revenue Share (%), by Type 2025 & 2033
- Figure 46: Middle East & Africa Dispersion Compensating Fiber Dcf Volume Share (%), by Type 2025 & 2033
- Figure 47: Middle East & Africa Dispersion Compensating Fiber Dcf Revenue (million), by Country 2025 & 2033
- Figure 48: Middle East & Africa Dispersion Compensating Fiber Dcf Volume (K), by Country 2025 & 2033
- Figure 49: Middle East & Africa Dispersion Compensating Fiber Dcf Revenue Share (%), by Country 2025 & 2033
- Figure 50: Middle East & Africa Dispersion Compensating Fiber Dcf Volume Share (%), by Country 2025 & 2033
- Figure 51: Asia Pacific Dispersion Compensating Fiber Dcf Revenue (million), by Application 2025 & 2033
- Figure 52: Asia Pacific Dispersion Compensating Fiber Dcf Volume (K), by Application 2025 & 2033
- Figure 53: Asia Pacific Dispersion Compensating Fiber Dcf Revenue Share (%), by Application 2025 & 2033
- Figure 54: Asia Pacific Dispersion Compensating Fiber Dcf Volume Share (%), by Application 2025 & 2033
- Figure 55: Asia Pacific Dispersion Compensating Fiber Dcf Revenue (million), by Type 2025 & 2033
- Figure 56: Asia Pacific Dispersion Compensating Fiber Dcf Volume (K), by Type 2025 & 2033
- Figure 57: Asia Pacific Dispersion Compensating Fiber Dcf Revenue Share (%), by Type 2025 & 2033
- Figure 58: Asia Pacific Dispersion Compensating Fiber Dcf Volume Share (%), by Type 2025 & 2033
- Figure 59: Asia Pacific Dispersion Compensating Fiber Dcf Revenue (million), by Country 2025 & 2033
- Figure 60: Asia Pacific Dispersion Compensating Fiber Dcf Volume (K), by Country 2025 & 2033
- Figure 61: Asia Pacific Dispersion Compensating Fiber Dcf Revenue Share (%), by Country 2025 & 2033
- Figure 62: Asia Pacific Dispersion Compensating Fiber Dcf Volume Share (%), by Country 2025 & 2033
List of Tables
- Table 1: Global Dispersion Compensating Fiber Dcf Revenue million Forecast, by Application 2020 & 2033
- Table 2: Global Dispersion Compensating Fiber Dcf Volume K Forecast, by Application 2020 & 2033
- Table 3: Global Dispersion Compensating Fiber Dcf Revenue million Forecast, by Type 2020 & 2033
- Table 4: Global Dispersion Compensating Fiber Dcf Volume K Forecast, by Type 2020 & 2033
- Table 5: Global Dispersion Compensating Fiber Dcf Revenue million Forecast, by Region 2020 & 2033
- Table 6: Global Dispersion Compensating Fiber Dcf Volume K Forecast, by Region 2020 & 2033
- Table 7: Global Dispersion Compensating Fiber Dcf Revenue million Forecast, by Application 2020 & 2033
- Table 8: Global Dispersion Compensating Fiber Dcf Volume K Forecast, by Application 2020 & 2033
- Table 9: Global Dispersion Compensating Fiber Dcf Revenue million Forecast, by Type 2020 & 2033
- Table 10: Global Dispersion Compensating Fiber Dcf Volume K Forecast, by Type 2020 & 2033
- Table 11: Global Dispersion Compensating Fiber Dcf Revenue million Forecast, by Country 2020 & 2033
- Table 12: Global Dispersion Compensating Fiber Dcf Volume K Forecast, by Country 2020 & 2033
- Table 13: United States Dispersion Compensating Fiber Dcf Revenue (million) Forecast, by Application 2020 & 2033
- Table 14: United States Dispersion Compensating Fiber Dcf Volume (K) Forecast, by Application 2020 & 2033
- Table 15: Canada Dispersion Compensating Fiber Dcf Revenue (million) Forecast, by Application 2020 & 2033
- Table 16: Canada Dispersion Compensating Fiber Dcf Volume (K) Forecast, by Application 2020 & 2033
- Table 17: Mexico Dispersion Compensating Fiber Dcf Revenue (million) Forecast, by Application 2020 & 2033
- Table 18: Mexico Dispersion Compensating Fiber Dcf Volume (K) Forecast, by Application 2020 & 2033
- Table 19: Global Dispersion Compensating Fiber Dcf Revenue million Forecast, by Application 2020 & 2033
- Table 20: Global Dispersion Compensating Fiber Dcf Volume K Forecast, by Application 2020 & 2033
- Table 21: Global Dispersion Compensating Fiber Dcf Revenue million Forecast, by Type 2020 & 2033
- Table 22: Global Dispersion Compensating Fiber Dcf Volume K Forecast, by Type 2020 & 2033
- Table 23: Global Dispersion Compensating Fiber Dcf Revenue million Forecast, by Country 2020 & 2033
- Table 24: Global Dispersion Compensating Fiber Dcf Volume K Forecast, by Country 2020 & 2033
- Table 25: Brazil Dispersion Compensating Fiber Dcf Revenue (million) Forecast, by Application 2020 & 2033
- Table 26: Brazil Dispersion Compensating Fiber Dcf Volume (K) Forecast, by Application 2020 & 2033
- Table 27: Argentina Dispersion Compensating Fiber Dcf Revenue (million) Forecast, by Application 2020 & 2033
- Table 28: Argentina Dispersion Compensating Fiber Dcf Volume (K) Forecast, by Application 2020 & 2033
- Table 29: Rest of South America Dispersion Compensating Fiber Dcf Revenue (million) Forecast, by Application 2020 & 2033
- Table 30: Rest of South America Dispersion Compensating Fiber Dcf Volume (K) Forecast, by Application 2020 & 2033
- Table 31: Global Dispersion Compensating Fiber Dcf Revenue million Forecast, by Application 2020 & 2033
- Table 32: Global Dispersion Compensating Fiber Dcf Volume K Forecast, by Application 2020 & 2033
- Table 33: Global Dispersion Compensating Fiber Dcf Revenue million Forecast, by Type 2020 & 2033
- Table 34: Global Dispersion Compensating Fiber Dcf Volume K Forecast, by Type 2020 & 2033
- Table 35: Global Dispersion Compensating Fiber Dcf Revenue million Forecast, by Country 2020 & 2033
- Table 36: Global Dispersion Compensating Fiber Dcf Volume K Forecast, by Country 2020 & 2033
- Table 37: United Kingdom Dispersion Compensating Fiber Dcf Revenue (million) Forecast, by Application 2020 & 2033
- Table 38: United Kingdom Dispersion Compensating Fiber Dcf Volume (K) Forecast, by Application 2020 & 2033
- Table 39: Germany Dispersion Compensating Fiber Dcf Revenue (million) Forecast, by Application 2020 & 2033
- Table 40: Germany Dispersion Compensating Fiber Dcf Volume (K) Forecast, by Application 2020 & 2033
- Table 41: France Dispersion Compensating Fiber Dcf Revenue (million) Forecast, by Application 2020 & 2033
- Table 42: France Dispersion Compensating Fiber Dcf Volume (K) Forecast, by Application 2020 & 2033
- Table 43: Italy Dispersion Compensating Fiber Dcf Revenue (million) Forecast, by Application 2020 & 2033
- Table 44: Italy Dispersion Compensating Fiber Dcf Volume (K) Forecast, by Application 2020 & 2033
- Table 45: Spain Dispersion Compensating Fiber Dcf Revenue (million) Forecast, by Application 2020 & 2033
- Table 46: Spain Dispersion Compensating Fiber Dcf Volume (K) Forecast, by Application 2020 & 2033
- Table 47: Russia Dispersion Compensating Fiber Dcf Revenue (million) Forecast, by Application 2020 & 2033
- Table 48: Russia Dispersion Compensating Fiber Dcf Volume (K) Forecast, by Application 2020 & 2033
- Table 49: Benelux Dispersion Compensating Fiber Dcf Revenue (million) Forecast, by Application 2020 & 2033
- Table 50: Benelux Dispersion Compensating Fiber Dcf Volume (K) Forecast, by Application 2020 & 2033
- Table 51: Nordics Dispersion Compensating Fiber Dcf Revenue (million) Forecast, by Application 2020 & 2033
- Table 52: Nordics Dispersion Compensating Fiber Dcf Volume (K) Forecast, by Application 2020 & 2033
- Table 53: Rest of Europe Dispersion Compensating Fiber Dcf Revenue (million) Forecast, by Application 2020 & 2033
- Table 54: Rest of Europe Dispersion Compensating Fiber Dcf Volume (K) Forecast, by Application 2020 & 2033
- Table 55: Global Dispersion Compensating Fiber Dcf Revenue million Forecast, by Application 2020 & 2033
- Table 56: Global Dispersion Compensating Fiber Dcf Volume K Forecast, by Application 2020 & 2033
- Table 57: Global Dispersion Compensating Fiber Dcf Revenue million Forecast, by Type 2020 & 2033
- Table 58: Global Dispersion Compensating Fiber Dcf Volume K Forecast, by Type 2020 & 2033
- Table 59: Global Dispersion Compensating Fiber Dcf Revenue million Forecast, by Country 2020 & 2033
- Table 60: Global Dispersion Compensating Fiber Dcf Volume K Forecast, by Country 2020 & 2033
- Table 61: Turkey Dispersion Compensating Fiber Dcf Revenue (million) Forecast, by Application 2020 & 2033
- Table 62: Turkey Dispersion Compensating Fiber Dcf Volume (K) Forecast, by Application 2020 & 2033
- Table 63: Israel Dispersion Compensating Fiber Dcf Revenue (million) Forecast, by Application 2020 & 2033
- Table 64: Israel Dispersion Compensating Fiber Dcf Volume (K) Forecast, by Application 2020 & 2033
- Table 65: GCC Dispersion Compensating Fiber Dcf Revenue (million) Forecast, by Application 2020 & 2033
- Table 66: GCC Dispersion Compensating Fiber Dcf Volume (K) Forecast, by Application 2020 & 2033
- Table 67: North Africa Dispersion Compensating Fiber Dcf Revenue (million) Forecast, by Application 2020 & 2033
- Table 68: North Africa Dispersion Compensating Fiber Dcf Volume (K) Forecast, by Application 2020 & 2033
- Table 69: South Africa Dispersion Compensating Fiber Dcf Revenue (million) Forecast, by Application 2020 & 2033
- Table 70: South Africa Dispersion Compensating Fiber Dcf Volume (K) Forecast, by Application 2020 & 2033
- Table 71: Rest of Middle East & Africa Dispersion Compensating Fiber Dcf Revenue (million) Forecast, by Application 2020 & 2033
- Table 72: Rest of Middle East & Africa Dispersion Compensating Fiber Dcf Volume (K) Forecast, by Application 2020 & 2033
- Table 73: Global Dispersion Compensating Fiber Dcf Revenue million Forecast, by Application 2020 & 2033
- Table 74: Global Dispersion Compensating Fiber Dcf Volume K Forecast, by Application 2020 & 2033
- Table 75: Global Dispersion Compensating Fiber Dcf Revenue million Forecast, by Type 2020 & 2033
- Table 76: Global Dispersion Compensating Fiber Dcf Volume K Forecast, by Type 2020 & 2033
- Table 77: Global Dispersion Compensating Fiber Dcf Revenue million Forecast, by Country 2020 & 2033
- Table 78: Global Dispersion Compensating Fiber Dcf Volume K Forecast, by Country 2020 & 2033
- Table 79: China Dispersion Compensating Fiber Dcf Revenue (million) Forecast, by Application 2020 & 2033
- Table 80: China Dispersion Compensating Fiber Dcf Volume (K) Forecast, by Application 2020 & 2033
- Table 81: India Dispersion Compensating Fiber Dcf Revenue (million) Forecast, by Application 2020 & 2033
- Table 82: India Dispersion Compensating Fiber Dcf Volume (K) Forecast, by Application 2020 & 2033
- Table 83: Japan Dispersion Compensating Fiber Dcf Revenue (million) Forecast, by Application 2020 & 2033
- Table 84: Japan Dispersion Compensating Fiber Dcf Volume (K) Forecast, by Application 2020 & 2033
- Table 85: South Korea Dispersion Compensating Fiber Dcf Revenue (million) Forecast, by Application 2020 & 2033
- Table 86: South Korea Dispersion Compensating Fiber Dcf Volume (K) Forecast, by Application 2020 & 2033
- Table 87: ASEAN Dispersion Compensating Fiber Dcf Revenue (million) Forecast, by Application 2020 & 2033
- Table 88: ASEAN Dispersion Compensating Fiber Dcf Volume (K) Forecast, by Application 2020 & 2033
- Table 89: Oceania Dispersion Compensating Fiber Dcf Revenue (million) Forecast, by Application 2020 & 2033
- Table 90: Oceania Dispersion Compensating Fiber Dcf Volume (K) Forecast, by Application 2020 & 2033
- Table 91: Rest of Asia Pacific Dispersion Compensating Fiber Dcf Revenue (million) Forecast, by Application 2020 & 2033
- Table 92: Rest of Asia Pacific Dispersion Compensating Fiber Dcf Volume (K) Forecast, by Application 2020 & 2033
Frequently Asked Questions
1. What is the projected Compound Annual Growth Rate (CAGR) of the Dispersion Compensating Fiber Dcf?
The projected CAGR is approximately 4.8%.
2. Which companies are prominent players in the Dispersion Compensating Fiber Dcf?
Key companies in the market include Yangtze Optical Fibre and Cable, Cycle, FiberLogix, OELABS, Thorlabs.
3. What are the main segments of the Dispersion Compensating Fiber Dcf?
The market segments include Application, Type.
4. Can you provide details about the market size?
The market size is estimated to be USD 136 million as of 2022.
5. What are some drivers contributing to market growth?
N/A
6. What are the notable trends driving market growth?
N/A
7. Are there any restraints impacting market growth?
N/A
8. Can you provide examples of recent developments in the market?
N/A
9. What pricing options are available for accessing the report?
Pricing options include single-user, multi-user, and enterprise licenses priced at USD 3950.00, USD 5925.00, and USD 7900.00 respectively.
10. Is the market size provided in terms of value or volume?
The market size is provided in terms of value, measured in million and volume, measured in K.
11. Are there any specific market keywords associated with the report?
Yes, the market keyword associated with the report is "Dispersion Compensating Fiber Dcf," which aids in identifying and referencing the specific market segment covered.
12. How do I determine which pricing option suits my needs best?
The pricing options vary based on user requirements and access needs. Individual users may opt for single-user licenses, while businesses requiring broader access may choose multi-user or enterprise licenses for cost-effective access to the report.
13. Are there any additional resources or data provided in the Dispersion Compensating Fiber Dcf report?
While the report offers comprehensive insights, it's advisable to review the specific contents or supplementary materials provided to ascertain if additional resources or data are available.
14. How can I stay updated on further developments or reports in the Dispersion Compensating Fiber Dcf?
To stay informed about further developments, trends, and reports in the Dispersion Compensating Fiber Dcf, consider subscribing to industry newsletters, following relevant companies and organizations, or regularly checking reputable industry news sources and publications.
Methodology
Step 1 - Identification of Relevant Samples Size from Population Database


Step 2 - Approaches for Defining Global Market Size (Value, Volume* & Price*)

Note*: In applicable scenarios
Step 3 - Data Sources
Primary Research
- Web Analytics
- Survey Reports
- Research Institute
- Latest Research Reports
- Opinion Leaders
Secondary Research
- Annual Reports
- White Paper
- Latest Press Release
- Industry Association
- Paid Database
- Investor Presentations

Step 4 - Data Triangulation
Involves using different sources of information in order to increase the validity of a study
These sources are likely to be stakeholders in a program - participants, other researchers, program staff, other community members, and so on.
Then we put all data in single framework & apply various statistical tools to find out the dynamic on the market.
During the analysis stage, feedback from the stakeholder groups would be compared to determine areas of agreement as well as areas of divergence