
Key Insights
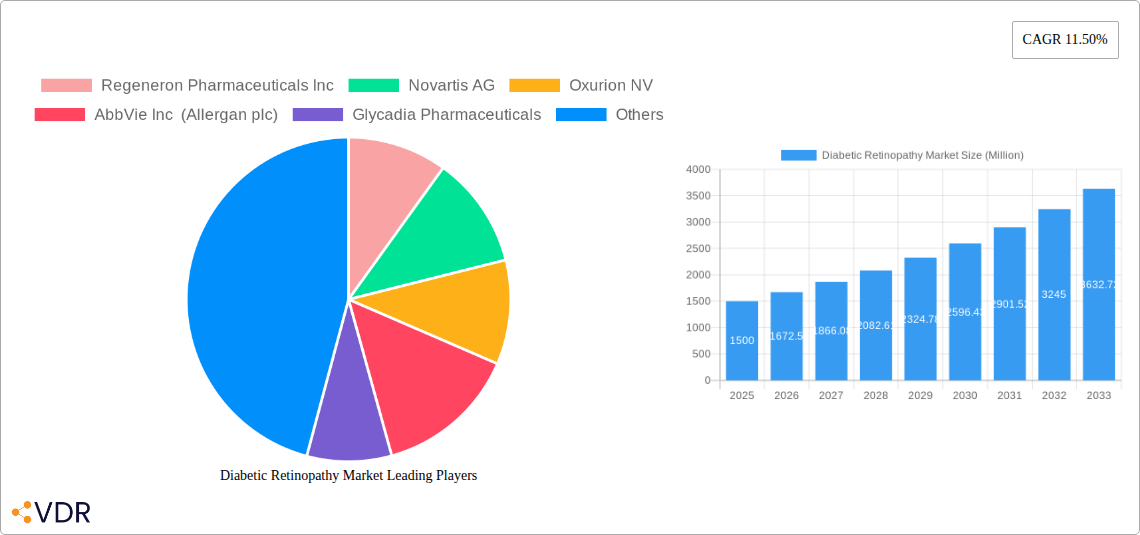
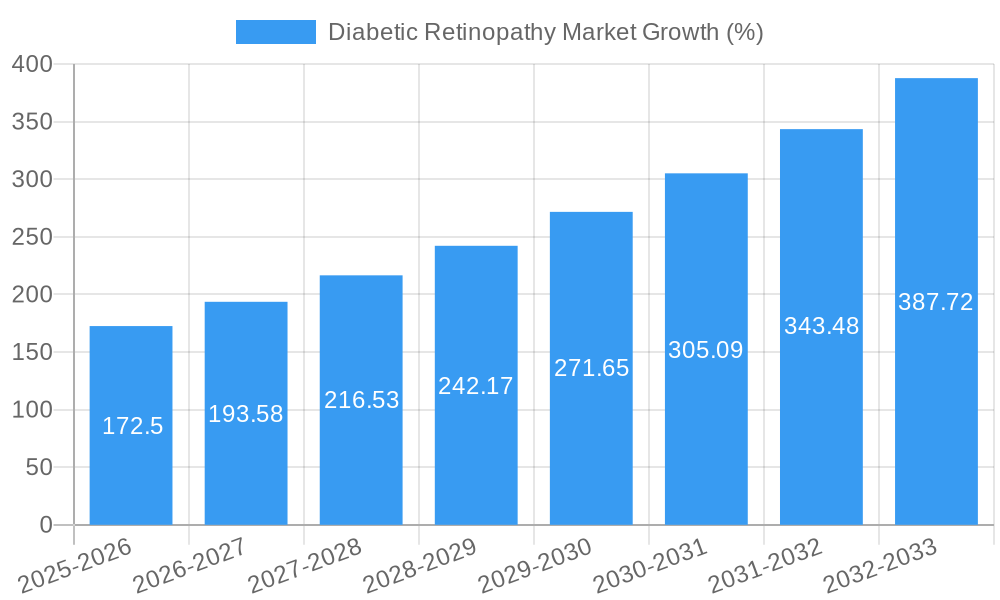
The global diabetic retinopathy market, valued at approximately $XX million in 2025, is projected to experience robust growth, exhibiting a compound annual growth rate (CAGR) of 11.50% from 2025 to 2033. This significant expansion is fueled by several key factors. The rising prevalence of diabetes worldwide, particularly in developing nations, forms the primary driver. Aging populations in many countries further contribute to the increased incidence of diabetic retinopathy, a leading cause of blindness. Advancements in treatment modalities, including the development of more effective anti-VEGF drugs, improved intraocular steroid injections, refined laser surgery techniques, and minimally invasive vitrectomy procedures, are also stimulating market growth. Increased awareness campaigns and early detection programs are playing a crucial role in improving patient outcomes and driving market demand. However, the high cost of treatment, particularly for advanced therapies like anti-VEGF injections, remains a significant restraint, potentially limiting access for some patients. The market is segmented by treatment approach (anti-VEGF drugs, intraocular steroid injections, laser surgery, vitrectomy) and type of diabetic retinopathy (proliferative and non-proliferative). The anti-VEGF segment currently dominates due to its efficacy in managing both types of retinopathy, but other treatment approaches are expected to witness growth owing to technological advancements and improved accessibility. Geographically, North America and Europe currently hold significant market shares, driven by established healthcare infrastructure and high per capita healthcare expenditure. However, rapidly growing economies in Asia-Pacific, particularly China and India, are anticipated to witness substantial market expansion over the forecast period, presenting significant opportunities for market players. Key players such as Regeneron Pharmaceuticals Inc, Novartis AG, and others are actively involved in research and development, focusing on innovative treatment options and improved drug delivery systems to enhance market competitiveness.
The competitive landscape is characterized by a mix of established pharmaceutical companies and emerging biotech firms. Strategic partnerships, mergers and acquisitions, and the introduction of novel therapies are shaping the market dynamics. The ongoing research focusing on gene therapy and other novel approaches for diabetic retinopathy treatment promises to further fuel market growth in the coming years. While challenges like affordability and access remain, the overall outlook for the diabetic retinopathy market is highly optimistic, driven by the escalating prevalence of diabetes, technological innovations, and expanding awareness. The market's future success hinges on addressing accessibility challenges and continuing to innovate treatment options, thereby improving the quality of life for millions affected by this debilitating disease.
Diabetic Retinopathy Market: A Comprehensive Report (2019-2033)
This comprehensive report provides an in-depth analysis of the Diabetic Retinopathy Market, encompassing market dynamics, growth trends, regional dominance, product landscape, key players, and future outlook. The study period covers 2019-2033, with 2025 as the base and estimated year. The report segments the market by Type (Proliferative Diabetic Retinopathy, Non-proliferative Retinopathy) and Management Approach (Anti-VEGF Drug, Intraocular Steroid Injection, Laser Surgery, Vitrectomy), offering a granular understanding of this critical ophthalmology sector. The total market value is projected to reach xx Million by 2033.
Diabetic Retinopathy Market Dynamics & Structure
The Diabetic Retinopathy market is characterized by a moderately concentrated landscape, with key players like Regeneron Pharmaceuticals Inc, Novartis AG, and AbbVie Inc (Allergan plc) holding significant market share. Technological innovation, particularly in anti-VEGF therapies and minimally invasive surgical techniques, is a major driver. Stringent regulatory frameworks, including FDA approvals, influence market entry and product adoption. The market also faces competition from alternative treatments and management approaches. The increasing prevalence of diabetes globally is a major growth catalyst, while factors like affordability and access to advanced treatments remain challenges. M&A activity in the sector has been moderate in recent years, with xx deals recorded between 2019 and 2024, contributing to consolidation and innovation.
- Market Concentration: Moderately concentrated, with top 5 players holding xx% market share in 2024.
- Technological Innovation: Driven by advancements in anti-VEGF drugs, gene therapy, and minimally invasive surgical techniques.
- Regulatory Landscape: Stringent FDA approvals and international regulatory guidelines influence market dynamics.
- Competitive Landscape: Intense competition among established players and emerging biotech companies.
- M&A Activity: xx deals between 2019-2024, leading to market consolidation and technological integration.
- End-user Demographics: Primarily driven by the aging population and increasing prevalence of diabetes.
Diabetic Retinopathy Market Growth Trends & Insights
The Diabetic Retinopathy market experienced robust growth during the historical period (2019-2024), driven by rising diabetes prevalence and advancements in treatment options. The market size reached xx Million in 2024 and is projected to exhibit a CAGR of xx% from 2025 to 2033, reaching xx Million. Increased adoption of advanced diagnostic techniques and minimally invasive procedures is significantly contributing to growth. Technological disruptions, such as the development of novel therapeutic agents and improved surgical tools, further fuel market expansion. Patient preference for less invasive procedures and improved patient outcomes are also shaping market trends. Market penetration of advanced therapies remains relatively low, offering substantial growth opportunities.
Dominant Regions, Countries, or Segments in Diabetic Retinopathy Market
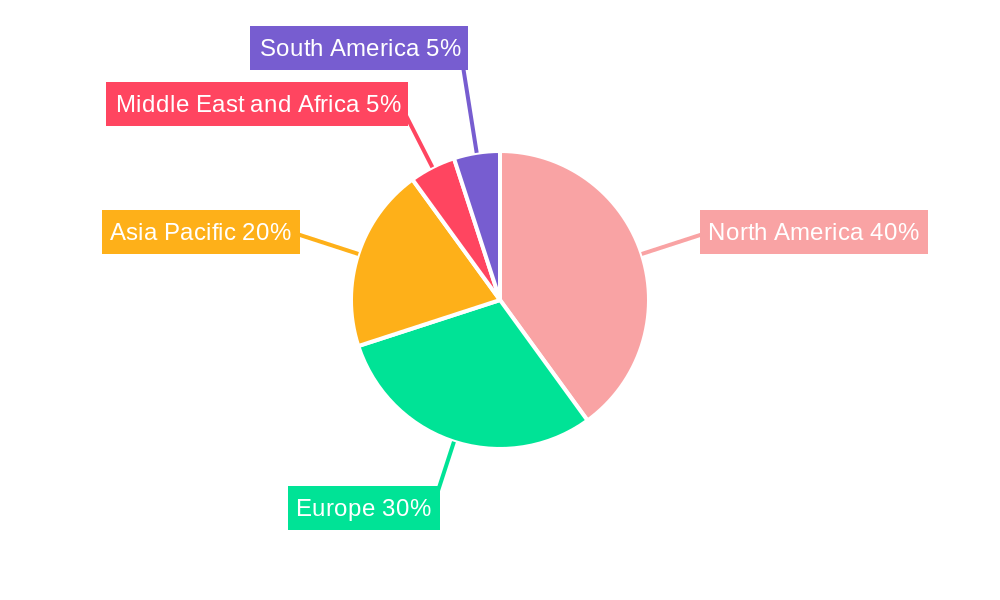
North America currently dominates the Diabetic Retinopathy market, driven by high diabetes prevalence, advanced healthcare infrastructure, and greater accessibility to advanced treatments. Within this region, the United States is the leading market. The Anti-VEGF drug segment holds the largest market share due to its effectiveness and wide adoption. Proliferative Diabetic Retinopathy is a significant segment experiencing rapid growth, driven by the severity of the condition and high treatment requirements.
- Key Drivers:
- High prevalence of diabetes in North America.
- Advanced healthcare infrastructure and access to specialized care.
- High adoption rate of Anti-VEGF drugs.
- Growing awareness and early diagnosis of diabetic retinopathy.
- Dominant Segments:
- Region: North America (US)
- Type: Proliferative Diabetic Retinopathy
- Management Approach: Anti-VEGF Drug
Diabetic Retinopathy Market Product Landscape
The Diabetic Retinopathy market offers a diverse range of products, including anti-VEGF drugs, intraocular steroid injections, laser therapy devices, and vitrectomy systems. Recent innovations focus on improved drug delivery mechanisms, minimally invasive surgical techniques, and enhanced diagnostic tools for early detection. The unique selling propositions of these products often include efficacy, safety, convenience, and reduced recovery time. Ongoing technological advancements are continually improving the effectiveness and safety of these treatments.
Key Drivers, Barriers & Challenges in Diabetic Retinopathy Market
Key Drivers: Rising prevalence of diabetes, technological advancements (e.g., improved anti-VEGF drugs and minimally invasive surgical approaches), increased healthcare spending, and growing awareness of diabetic retinopathy.
Challenges: High treatment costs limiting accessibility, especially in developing countries; potential side effects associated with certain treatments; and the need for skilled healthcare professionals for diagnosis and treatment. The complex supply chain for specialized devices and medications can also pose challenges. Regulatory hurdles and reimbursement policies further impact market penetration.
Emerging Opportunities in Diabetic Retinopathy Market
Untapped markets in emerging economies, particularly in Asia and Africa, present substantial growth opportunities. The development of novel therapeutic approaches, including gene therapy and personalized medicine, offers exciting prospects. Telemedicine and remote patient monitoring hold significant potential for expanding access to care and improving patient outcomes.
Growth Accelerators in the Diabetic Retinopathy Market Industry
Technological breakthroughs in drug delivery systems, minimally invasive surgical procedures, and advanced imaging techniques are significantly accelerating market growth. Strategic partnerships between pharmaceutical companies, medical device manufacturers, and healthcare providers are fostering innovation and market expansion. Initiatives focused on diabetes prevention and early detection of diabetic retinopathy are also contributing to market growth.
Key Players Shaping the Diabetic Retinopathy Market Market
- Regeneron Pharmaceuticals Inc
- Novartis AG
- Oxurion NV
- AbbVie Inc (Allergan plc)
- Glycadia Pharmaceuticals
- Alimera Sciences
- BCN Peptides
- F Hoffmann-La Roche Ltd (Genentech)
- Ocuphire Pharma
Notable Milestones in Diabetic Retinopathy Market Sector
- June 2022: Regeneron Pharmaceuticals, Inc. announced FDA acceptance of EYLEA sBLA for a 16-week 2 mg dosing regimen for diabetic retinopathy.
- February 2022: REGENXBIO Inc. announced positive interim data from the Phase II ALTITUDE trial of RGX-314 for diabetic retinopathy.
In-Depth Diabetic Retinopathy Market Market Outlook
The Diabetic Retinopathy market is poised for continued growth, driven by technological advancements, expanding treatment access, and rising diabetes prevalence. Strategic partnerships, market expansion into untapped regions, and the development of innovative therapies will be crucial for future success. The market presents significant opportunities for companies developing and commercializing advanced diagnostic tools, novel therapeutics, and minimally invasive treatment modalities.
Diabetic Retinopathy Market Segmentation
-
1. Type
- 1.1. Proliferative Diabetic Retinopathy
- 1.2. Non-proliferative Retinopathy
-
2. Management Approach
- 2.1. Anti-VEGF Drug
- 2.2. Intraocular Steroid Injection
- 2.3. Laser Surgery
- 2.4. Vitrectomy
Diabetic Retinopathy Market Segmentation By Geography
-
1. North America
- 1.1. United States
- 1.2. Canada
- 1.3. Mexico
-
2. Europe
- 2.1. Germany
- 2.2. United Kingdom
- 2.3. France
- 2.4. Italy
- 2.5. Spain
- 2.6. Rest of Europe
-
3. Asia Pacific
- 3.1. China
- 3.2. Japan
- 3.3. India
- 3.4. Australia
- 3.5. South Korea
- 3.6. Rest of Asia Pacific
-
4. Middle East and Africa
- 4.1. GCC
- 4.2. South Africa
- 4.3. Rest of Middle East and Africa
-
5. South America
- 5.1. Brazil
- 5.2. Argentina
- 5.3. Rest of South America
Diabetic Retinopathy Market REPORT HIGHLIGHTS
| Aspects | Details |
|---|---|
| Study Period | 2019-2033 |
| Base Year | 2024 |
| Estimated Year | 2025 |
| Forecast Period | 2025-2033 |
| Historical Period | 2019-2024 |
| Growth Rate | CAGR of 11.50% from 2019-2033 |
| Segmentation |
|
Table of Contents
- 1. Introduction
- 1.1. Research Scope
- 1.2. Market Segmentation
- 1.3. Research Methodology
- 1.4. Definitions and Assumptions
- 2. Executive Summary
- 2.1. Introduction
- 3. Market Dynamics
- 3.1. Introduction
- 3.2. Market Drivers
- 3.2.1. Rising Prevalence of Diabetes and Blindness Due to The Same; Growing Geriatric Population Base; Increasing Technological Advancements in Diabetic Retinopathy Surgical Instruments
- 3.3. Market Restrains
- 3.3.1. Lack of Skilled Ophthalmologists; Extended Approval Time for Drugs
- 3.4. Market Trends
- 3.4.1. Proliferative diabetic retinopathy is Expected to Hold Significant Market Share in the Type Segment
- 4. Market Factor Analysis
- 4.1. Porters Five Forces
- 4.2. Supply/Value Chain
- 4.3. PESTEL analysis
- 4.4. Market Entropy
- 4.5. Patent/Trademark Analysis
- 5. Global Diabetic Retinopathy Market Analysis, Insights and Forecast, 2019-2031
- 5.1. Market Analysis, Insights and Forecast - by Type
- 5.1.1. Proliferative Diabetic Retinopathy
- 5.1.2. Non-proliferative Retinopathy
- 5.2. Market Analysis, Insights and Forecast - by Management Approach
- 5.2.1. Anti-VEGF Drug
- 5.2.2. Intraocular Steroid Injection
- 5.2.3. Laser Surgery
- 5.2.4. Vitrectomy
- 5.3. Market Analysis, Insights and Forecast - by Region
- 5.3.1. North America
- 5.3.2. Europe
- 5.3.3. Asia Pacific
- 5.3.4. Middle East and Africa
- 5.3.5. South America
- 5.1. Market Analysis, Insights and Forecast - by Type
- 6. North America Diabetic Retinopathy Market Analysis, Insights and Forecast, 2019-2031
- 6.1. Market Analysis, Insights and Forecast - by Type
- 6.1.1. Proliferative Diabetic Retinopathy
- 6.1.2. Non-proliferative Retinopathy
- 6.2. Market Analysis, Insights and Forecast - by Management Approach
- 6.2.1. Anti-VEGF Drug
- 6.2.2. Intraocular Steroid Injection
- 6.2.3. Laser Surgery
- 6.2.4. Vitrectomy
- 6.1. Market Analysis, Insights and Forecast - by Type
- 7. Europe Diabetic Retinopathy Market Analysis, Insights and Forecast, 2019-2031
- 7.1. Market Analysis, Insights and Forecast - by Type
- 7.1.1. Proliferative Diabetic Retinopathy
- 7.1.2. Non-proliferative Retinopathy
- 7.2. Market Analysis, Insights and Forecast - by Management Approach
- 7.2.1. Anti-VEGF Drug
- 7.2.2. Intraocular Steroid Injection
- 7.2.3. Laser Surgery
- 7.2.4. Vitrectomy
- 7.1. Market Analysis, Insights and Forecast - by Type
- 8. Asia Pacific Diabetic Retinopathy Market Analysis, Insights and Forecast, 2019-2031
- 8.1. Market Analysis, Insights and Forecast - by Type
- 8.1.1. Proliferative Diabetic Retinopathy
- 8.1.2. Non-proliferative Retinopathy
- 8.2. Market Analysis, Insights and Forecast - by Management Approach
- 8.2.1. Anti-VEGF Drug
- 8.2.2. Intraocular Steroid Injection
- 8.2.3. Laser Surgery
- 8.2.4. Vitrectomy
- 8.1. Market Analysis, Insights and Forecast - by Type
- 9. Middle East and Africa Diabetic Retinopathy Market Analysis, Insights and Forecast, 2019-2031
- 9.1. Market Analysis, Insights and Forecast - by Type
- 9.1.1. Proliferative Diabetic Retinopathy
- 9.1.2. Non-proliferative Retinopathy
- 9.2. Market Analysis, Insights and Forecast - by Management Approach
- 9.2.1. Anti-VEGF Drug
- 9.2.2. Intraocular Steroid Injection
- 9.2.3. Laser Surgery
- 9.2.4. Vitrectomy
- 9.1. Market Analysis, Insights and Forecast - by Type
- 10. South America Diabetic Retinopathy Market Analysis, Insights and Forecast, 2019-2031
- 10.1. Market Analysis, Insights and Forecast - by Type
- 10.1.1. Proliferative Diabetic Retinopathy
- 10.1.2. Non-proliferative Retinopathy
- 10.2. Market Analysis, Insights and Forecast - by Management Approach
- 10.2.1. Anti-VEGF Drug
- 10.2.2. Intraocular Steroid Injection
- 10.2.3. Laser Surgery
- 10.2.4. Vitrectomy
- 10.1. Market Analysis, Insights and Forecast - by Type
- 11. North America Diabetic Retinopathy Market Analysis, Insights and Forecast, 2019-2031
- 11.1. Market Analysis, Insights and Forecast - By Country/Sub-region
- 11.1.1 United States
- 11.1.2 Canada
- 11.1.3 Mexico
- 12. Europe Diabetic Retinopathy Market Analysis, Insights and Forecast, 2019-2031
- 12.1. Market Analysis, Insights and Forecast - By Country/Sub-region
- 12.1.1 Germany
- 12.1.2 United Kingdom
- 12.1.3 France
- 12.1.4 Italy
- 12.1.5 Spain
- 12.1.6 Rest of Europe
- 13. Asia Pacific Diabetic Retinopathy Market Analysis, Insights and Forecast, 2019-2031
- 13.1. Market Analysis, Insights and Forecast - By Country/Sub-region
- 13.1.1 China
- 13.1.2 Japan
- 13.1.3 India
- 13.1.4 Australia
- 13.1.5 South Korea
- 13.1.6 Rest of Asia Pacific
- 14. Middle East and Africa Diabetic Retinopathy Market Analysis, Insights and Forecast, 2019-2031
- 14.1. Market Analysis, Insights and Forecast - By Country/Sub-region
- 14.1.1 GCC
- 14.1.2 South Africa
- 14.1.3 Rest of Middle East and Africa
- 15. South America Diabetic Retinopathy Market Analysis, Insights and Forecast, 2019-2031
- 15.1. Market Analysis, Insights and Forecast - By Country/Sub-region
- 15.1.1 Brazil
- 15.1.2 Argentina
- 15.1.3 Rest of South America
- 16. Competitive Analysis
- 16.1. Global Market Share Analysis 2024
- 16.2. Company Profiles
- 16.2.1 Regeneron Pharmaceuticals Inc
- 16.2.1.1. Overview
- 16.2.1.2. Products
- 16.2.1.3. SWOT Analysis
- 16.2.1.4. Recent Developments
- 16.2.1.5. Financials (Based on Availability)
- 16.2.2 Novartis AG
- 16.2.2.1. Overview
- 16.2.2.2. Products
- 16.2.2.3. SWOT Analysis
- 16.2.2.4. Recent Developments
- 16.2.2.5. Financials (Based on Availability)
- 16.2.3 Oxurion NV
- 16.2.3.1. Overview
- 16.2.3.2. Products
- 16.2.3.3. SWOT Analysis
- 16.2.3.4. Recent Developments
- 16.2.3.5. Financials (Based on Availability)
- 16.2.4 AbbVie Inc (Allergan plc)
- 16.2.4.1. Overview
- 16.2.4.2. Products
- 16.2.4.3. SWOT Analysis
- 16.2.4.4. Recent Developments
- 16.2.4.5. Financials (Based on Availability)
- 16.2.5 Glycadia Pharmaceuticals
- 16.2.5.1. Overview
- 16.2.5.2. Products
- 16.2.5.3. SWOT Analysis
- 16.2.5.4. Recent Developments
- 16.2.5.5. Financials (Based on Availability)
- 16.2.6 Alimera Sciences
- 16.2.6.1. Overview
- 16.2.6.2. Products
- 16.2.6.3. SWOT Analysis
- 16.2.6.4. Recent Developments
- 16.2.6.5. Financials (Based on Availability)
- 16.2.7 BCN Peptides
- 16.2.7.1. Overview
- 16.2.7.2. Products
- 16.2.7.3. SWOT Analysis
- 16.2.7.4. Recent Developments
- 16.2.7.5. Financials (Based on Availability)
- 16.2.8 F Hoffmann-La Roche Ltd (Genentech)
- 16.2.8.1. Overview
- 16.2.8.2. Products
- 16.2.8.3. SWOT Analysis
- 16.2.8.4. Recent Developments
- 16.2.8.5. Financials (Based on Availability)
- 16.2.9 Ocuphire Pharma
- 16.2.9.1. Overview
- 16.2.9.2. Products
- 16.2.9.3. SWOT Analysis
- 16.2.9.4. Recent Developments
- 16.2.9.5. Financials (Based on Availability)
- 16.2.1 Regeneron Pharmaceuticals Inc
List of Figures
- Figure 1: Global Diabetic Retinopathy Market Revenue Breakdown (Million, %) by Region 2024 & 2032
- Figure 2: Global Diabetic Retinopathy Market Volume Breakdown (K Unit, %) by Region 2024 & 2032
- Figure 3: North America Diabetic Retinopathy Market Revenue (Million), by Country 2024 & 2032
- Figure 4: North America Diabetic Retinopathy Market Volume (K Unit), by Country 2024 & 2032
- Figure 5: North America Diabetic Retinopathy Market Revenue Share (%), by Country 2024 & 2032
- Figure 6: North America Diabetic Retinopathy Market Volume Share (%), by Country 2024 & 2032
- Figure 7: Europe Diabetic Retinopathy Market Revenue (Million), by Country 2024 & 2032
- Figure 8: Europe Diabetic Retinopathy Market Volume (K Unit), by Country 2024 & 2032
- Figure 9: Europe Diabetic Retinopathy Market Revenue Share (%), by Country 2024 & 2032
- Figure 10: Europe Diabetic Retinopathy Market Volume Share (%), by Country 2024 & 2032
- Figure 11: Asia Pacific Diabetic Retinopathy Market Revenue (Million), by Country 2024 & 2032
- Figure 12: Asia Pacific Diabetic Retinopathy Market Volume (K Unit), by Country 2024 & 2032
- Figure 13: Asia Pacific Diabetic Retinopathy Market Revenue Share (%), by Country 2024 & 2032
- Figure 14: Asia Pacific Diabetic Retinopathy Market Volume Share (%), by Country 2024 & 2032
- Figure 15: Middle East and Africa Diabetic Retinopathy Market Revenue (Million), by Country 2024 & 2032
- Figure 16: Middle East and Africa Diabetic Retinopathy Market Volume (K Unit), by Country 2024 & 2032
- Figure 17: Middle East and Africa Diabetic Retinopathy Market Revenue Share (%), by Country 2024 & 2032
- Figure 18: Middle East and Africa Diabetic Retinopathy Market Volume Share (%), by Country 2024 & 2032
- Figure 19: South America Diabetic Retinopathy Market Revenue (Million), by Country 2024 & 2032
- Figure 20: South America Diabetic Retinopathy Market Volume (K Unit), by Country 2024 & 2032
- Figure 21: South America Diabetic Retinopathy Market Revenue Share (%), by Country 2024 & 2032
- Figure 22: South America Diabetic Retinopathy Market Volume Share (%), by Country 2024 & 2032
- Figure 23: North America Diabetic Retinopathy Market Revenue (Million), by Type 2024 & 2032
- Figure 24: North America Diabetic Retinopathy Market Volume (K Unit), by Type 2024 & 2032
- Figure 25: North America Diabetic Retinopathy Market Revenue Share (%), by Type 2024 & 2032
- Figure 26: North America Diabetic Retinopathy Market Volume Share (%), by Type 2024 & 2032
- Figure 27: North America Diabetic Retinopathy Market Revenue (Million), by Management Approach 2024 & 2032
- Figure 28: North America Diabetic Retinopathy Market Volume (K Unit), by Management Approach 2024 & 2032
- Figure 29: North America Diabetic Retinopathy Market Revenue Share (%), by Management Approach 2024 & 2032
- Figure 30: North America Diabetic Retinopathy Market Volume Share (%), by Management Approach 2024 & 2032
- Figure 31: North America Diabetic Retinopathy Market Revenue (Million), by Country 2024 & 2032
- Figure 32: North America Diabetic Retinopathy Market Volume (K Unit), by Country 2024 & 2032
- Figure 33: North America Diabetic Retinopathy Market Revenue Share (%), by Country 2024 & 2032
- Figure 34: North America Diabetic Retinopathy Market Volume Share (%), by Country 2024 & 2032
- Figure 35: Europe Diabetic Retinopathy Market Revenue (Million), by Type 2024 & 2032
- Figure 36: Europe Diabetic Retinopathy Market Volume (K Unit), by Type 2024 & 2032
- Figure 37: Europe Diabetic Retinopathy Market Revenue Share (%), by Type 2024 & 2032
- Figure 38: Europe Diabetic Retinopathy Market Volume Share (%), by Type 2024 & 2032
- Figure 39: Europe Diabetic Retinopathy Market Revenue (Million), by Management Approach 2024 & 2032
- Figure 40: Europe Diabetic Retinopathy Market Volume (K Unit), by Management Approach 2024 & 2032
- Figure 41: Europe Diabetic Retinopathy Market Revenue Share (%), by Management Approach 2024 & 2032
- Figure 42: Europe Diabetic Retinopathy Market Volume Share (%), by Management Approach 2024 & 2032
- Figure 43: Europe Diabetic Retinopathy Market Revenue (Million), by Country 2024 & 2032
- Figure 44: Europe Diabetic Retinopathy Market Volume (K Unit), by Country 2024 & 2032
- Figure 45: Europe Diabetic Retinopathy Market Revenue Share (%), by Country 2024 & 2032
- Figure 46: Europe Diabetic Retinopathy Market Volume Share (%), by Country 2024 & 2032
- Figure 47: Asia Pacific Diabetic Retinopathy Market Revenue (Million), by Type 2024 & 2032
- Figure 48: Asia Pacific Diabetic Retinopathy Market Volume (K Unit), by Type 2024 & 2032
- Figure 49: Asia Pacific Diabetic Retinopathy Market Revenue Share (%), by Type 2024 & 2032
- Figure 50: Asia Pacific Diabetic Retinopathy Market Volume Share (%), by Type 2024 & 2032
- Figure 51: Asia Pacific Diabetic Retinopathy Market Revenue (Million), by Management Approach 2024 & 2032
- Figure 52: Asia Pacific Diabetic Retinopathy Market Volume (K Unit), by Management Approach 2024 & 2032
- Figure 53: Asia Pacific Diabetic Retinopathy Market Revenue Share (%), by Management Approach 2024 & 2032
- Figure 54: Asia Pacific Diabetic Retinopathy Market Volume Share (%), by Management Approach 2024 & 2032
- Figure 55: Asia Pacific Diabetic Retinopathy Market Revenue (Million), by Country 2024 & 2032
- Figure 56: Asia Pacific Diabetic Retinopathy Market Volume (K Unit), by Country 2024 & 2032
- Figure 57: Asia Pacific Diabetic Retinopathy Market Revenue Share (%), by Country 2024 & 2032
- Figure 58: Asia Pacific Diabetic Retinopathy Market Volume Share (%), by Country 2024 & 2032
- Figure 59: Middle East and Africa Diabetic Retinopathy Market Revenue (Million), by Type 2024 & 2032
- Figure 60: Middle East and Africa Diabetic Retinopathy Market Volume (K Unit), by Type 2024 & 2032
- Figure 61: Middle East and Africa Diabetic Retinopathy Market Revenue Share (%), by Type 2024 & 2032
- Figure 62: Middle East and Africa Diabetic Retinopathy Market Volume Share (%), by Type 2024 & 2032
- Figure 63: Middle East and Africa Diabetic Retinopathy Market Revenue (Million), by Management Approach 2024 & 2032
- Figure 64: Middle East and Africa Diabetic Retinopathy Market Volume (K Unit), by Management Approach 2024 & 2032
- Figure 65: Middle East and Africa Diabetic Retinopathy Market Revenue Share (%), by Management Approach 2024 & 2032
- Figure 66: Middle East and Africa Diabetic Retinopathy Market Volume Share (%), by Management Approach 2024 & 2032
- Figure 67: Middle East and Africa Diabetic Retinopathy Market Revenue (Million), by Country 2024 & 2032
- Figure 68: Middle East and Africa Diabetic Retinopathy Market Volume (K Unit), by Country 2024 & 2032
- Figure 69: Middle East and Africa Diabetic Retinopathy Market Revenue Share (%), by Country 2024 & 2032
- Figure 70: Middle East and Africa Diabetic Retinopathy Market Volume Share (%), by Country 2024 & 2032
- Figure 71: South America Diabetic Retinopathy Market Revenue (Million), by Type 2024 & 2032
- Figure 72: South America Diabetic Retinopathy Market Volume (K Unit), by Type 2024 & 2032
- Figure 73: South America Diabetic Retinopathy Market Revenue Share (%), by Type 2024 & 2032
- Figure 74: South America Diabetic Retinopathy Market Volume Share (%), by Type 2024 & 2032
- Figure 75: South America Diabetic Retinopathy Market Revenue (Million), by Management Approach 2024 & 2032
- Figure 76: South America Diabetic Retinopathy Market Volume (K Unit), by Management Approach 2024 & 2032
- Figure 77: South America Diabetic Retinopathy Market Revenue Share (%), by Management Approach 2024 & 2032
- Figure 78: South America Diabetic Retinopathy Market Volume Share (%), by Management Approach 2024 & 2032
- Figure 79: South America Diabetic Retinopathy Market Revenue (Million), by Country 2024 & 2032
- Figure 80: South America Diabetic Retinopathy Market Volume (K Unit), by Country 2024 & 2032
- Figure 81: South America Diabetic Retinopathy Market Revenue Share (%), by Country 2024 & 2032
- Figure 82: South America Diabetic Retinopathy Market Volume Share (%), by Country 2024 & 2032
List of Tables
- Table 1: Global Diabetic Retinopathy Market Revenue Million Forecast, by Region 2019 & 2032
- Table 2: Global Diabetic Retinopathy Market Volume K Unit Forecast, by Region 2019 & 2032
- Table 3: Global Diabetic Retinopathy Market Revenue Million Forecast, by Type 2019 & 2032
- Table 4: Global Diabetic Retinopathy Market Volume K Unit Forecast, by Type 2019 & 2032
- Table 5: Global Diabetic Retinopathy Market Revenue Million Forecast, by Management Approach 2019 & 2032
- Table 6: Global Diabetic Retinopathy Market Volume K Unit Forecast, by Management Approach 2019 & 2032
- Table 7: Global Diabetic Retinopathy Market Revenue Million Forecast, by Region 2019 & 2032
- Table 8: Global Diabetic Retinopathy Market Volume K Unit Forecast, by Region 2019 & 2032
- Table 9: Global Diabetic Retinopathy Market Revenue Million Forecast, by Country 2019 & 2032
- Table 10: Global Diabetic Retinopathy Market Volume K Unit Forecast, by Country 2019 & 2032
- Table 11: United States Diabetic Retinopathy Market Revenue (Million) Forecast, by Application 2019 & 2032
- Table 12: United States Diabetic Retinopathy Market Volume (K Unit) Forecast, by Application 2019 & 2032
- Table 13: Canada Diabetic Retinopathy Market Revenue (Million) Forecast, by Application 2019 & 2032
- Table 14: Canada Diabetic Retinopathy Market Volume (K Unit) Forecast, by Application 2019 & 2032
- Table 15: Mexico Diabetic Retinopathy Market Revenue (Million) Forecast, by Application 2019 & 2032
- Table 16: Mexico Diabetic Retinopathy Market Volume (K Unit) Forecast, by Application 2019 & 2032
- Table 17: Global Diabetic Retinopathy Market Revenue Million Forecast, by Country 2019 & 2032
- Table 18: Global Diabetic Retinopathy Market Volume K Unit Forecast, by Country 2019 & 2032
- Table 19: Germany Diabetic Retinopathy Market Revenue (Million) Forecast, by Application 2019 & 2032
- Table 20: Germany Diabetic Retinopathy Market Volume (K Unit) Forecast, by Application 2019 & 2032
- Table 21: United Kingdom Diabetic Retinopathy Market Revenue (Million) Forecast, by Application 2019 & 2032
- Table 22: United Kingdom Diabetic Retinopathy Market Volume (K Unit) Forecast, by Application 2019 & 2032
- Table 23: France Diabetic Retinopathy Market Revenue (Million) Forecast, by Application 2019 & 2032
- Table 24: France Diabetic Retinopathy Market Volume (K Unit) Forecast, by Application 2019 & 2032
- Table 25: Italy Diabetic Retinopathy Market Revenue (Million) Forecast, by Application 2019 & 2032
- Table 26: Italy Diabetic Retinopathy Market Volume (K Unit) Forecast, by Application 2019 & 2032
- Table 27: Spain Diabetic Retinopathy Market Revenue (Million) Forecast, by Application 2019 & 2032
- Table 28: Spain Diabetic Retinopathy Market Volume (K Unit) Forecast, by Application 2019 & 2032
- Table 29: Rest of Europe Diabetic Retinopathy Market Revenue (Million) Forecast, by Application 2019 & 2032
- Table 30: Rest of Europe Diabetic Retinopathy Market Volume (K Unit) Forecast, by Application 2019 & 2032
- Table 31: Global Diabetic Retinopathy Market Revenue Million Forecast, by Country 2019 & 2032
- Table 32: Global Diabetic Retinopathy Market Volume K Unit Forecast, by Country 2019 & 2032
- Table 33: China Diabetic Retinopathy Market Revenue (Million) Forecast, by Application 2019 & 2032
- Table 34: China Diabetic Retinopathy Market Volume (K Unit) Forecast, by Application 2019 & 2032
- Table 35: Japan Diabetic Retinopathy Market Revenue (Million) Forecast, by Application 2019 & 2032
- Table 36: Japan Diabetic Retinopathy Market Volume (K Unit) Forecast, by Application 2019 & 2032
- Table 37: India Diabetic Retinopathy Market Revenue (Million) Forecast, by Application 2019 & 2032
- Table 38: India Diabetic Retinopathy Market Volume (K Unit) Forecast, by Application 2019 & 2032
- Table 39: Australia Diabetic Retinopathy Market Revenue (Million) Forecast, by Application 2019 & 2032
- Table 40: Australia Diabetic Retinopathy Market Volume (K Unit) Forecast, by Application 2019 & 2032
- Table 41: South Korea Diabetic Retinopathy Market Revenue (Million) Forecast, by Application 2019 & 2032
- Table 42: South Korea Diabetic Retinopathy Market Volume (K Unit) Forecast, by Application 2019 & 2032
- Table 43: Rest of Asia Pacific Diabetic Retinopathy Market Revenue (Million) Forecast, by Application 2019 & 2032
- Table 44: Rest of Asia Pacific Diabetic Retinopathy Market Volume (K Unit) Forecast, by Application 2019 & 2032
- Table 45: Global Diabetic Retinopathy Market Revenue Million Forecast, by Country 2019 & 2032
- Table 46: Global Diabetic Retinopathy Market Volume K Unit Forecast, by Country 2019 & 2032
- Table 47: GCC Diabetic Retinopathy Market Revenue (Million) Forecast, by Application 2019 & 2032
- Table 48: GCC Diabetic Retinopathy Market Volume (K Unit) Forecast, by Application 2019 & 2032
- Table 49: South Africa Diabetic Retinopathy Market Revenue (Million) Forecast, by Application 2019 & 2032
- Table 50: South Africa Diabetic Retinopathy Market Volume (K Unit) Forecast, by Application 2019 & 2032
- Table 51: Rest of Middle East and Africa Diabetic Retinopathy Market Revenue (Million) Forecast, by Application 2019 & 2032
- Table 52: Rest of Middle East and Africa Diabetic Retinopathy Market Volume (K Unit) Forecast, by Application 2019 & 2032
- Table 53: Global Diabetic Retinopathy Market Revenue Million Forecast, by Country 2019 & 2032
- Table 54: Global Diabetic Retinopathy Market Volume K Unit Forecast, by Country 2019 & 2032
- Table 55: Brazil Diabetic Retinopathy Market Revenue (Million) Forecast, by Application 2019 & 2032
- Table 56: Brazil Diabetic Retinopathy Market Volume (K Unit) Forecast, by Application 2019 & 2032
- Table 57: Argentina Diabetic Retinopathy Market Revenue (Million) Forecast, by Application 2019 & 2032
- Table 58: Argentina Diabetic Retinopathy Market Volume (K Unit) Forecast, by Application 2019 & 2032
- Table 59: Rest of South America Diabetic Retinopathy Market Revenue (Million) Forecast, by Application 2019 & 2032
- Table 60: Rest of South America Diabetic Retinopathy Market Volume (K Unit) Forecast, by Application 2019 & 2032
- Table 61: Global Diabetic Retinopathy Market Revenue Million Forecast, by Type 2019 & 2032
- Table 62: Global Diabetic Retinopathy Market Volume K Unit Forecast, by Type 2019 & 2032
- Table 63: Global Diabetic Retinopathy Market Revenue Million Forecast, by Management Approach 2019 & 2032
- Table 64: Global Diabetic Retinopathy Market Volume K Unit Forecast, by Management Approach 2019 & 2032
- Table 65: Global Diabetic Retinopathy Market Revenue Million Forecast, by Country 2019 & 2032
- Table 66: Global Diabetic Retinopathy Market Volume K Unit Forecast, by Country 2019 & 2032
- Table 67: United States Diabetic Retinopathy Market Revenue (Million) Forecast, by Application 2019 & 2032
- Table 68: United States Diabetic Retinopathy Market Volume (K Unit) Forecast, by Application 2019 & 2032
- Table 69: Canada Diabetic Retinopathy Market Revenue (Million) Forecast, by Application 2019 & 2032
- Table 70: Canada Diabetic Retinopathy Market Volume (K Unit) Forecast, by Application 2019 & 2032
- Table 71: Mexico Diabetic Retinopathy Market Revenue (Million) Forecast, by Application 2019 & 2032
- Table 72: Mexico Diabetic Retinopathy Market Volume (K Unit) Forecast, by Application 2019 & 2032
- Table 73: Global Diabetic Retinopathy Market Revenue Million Forecast, by Type 2019 & 2032
- Table 74: Global Diabetic Retinopathy Market Volume K Unit Forecast, by Type 2019 & 2032
- Table 75: Global Diabetic Retinopathy Market Revenue Million Forecast, by Management Approach 2019 & 2032
- Table 76: Global Diabetic Retinopathy Market Volume K Unit Forecast, by Management Approach 2019 & 2032
- Table 77: Global Diabetic Retinopathy Market Revenue Million Forecast, by Country 2019 & 2032
- Table 78: Global Diabetic Retinopathy Market Volume K Unit Forecast, by Country 2019 & 2032
- Table 79: Germany Diabetic Retinopathy Market Revenue (Million) Forecast, by Application 2019 & 2032
- Table 80: Germany Diabetic Retinopathy Market Volume (K Unit) Forecast, by Application 2019 & 2032
- Table 81: United Kingdom Diabetic Retinopathy Market Revenue (Million) Forecast, by Application 2019 & 2032
- Table 82: United Kingdom Diabetic Retinopathy Market Volume (K Unit) Forecast, by Application 2019 & 2032
- Table 83: France Diabetic Retinopathy Market Revenue (Million) Forecast, by Application 2019 & 2032
- Table 84: France Diabetic Retinopathy Market Volume (K Unit) Forecast, by Application 2019 & 2032
- Table 85: Italy Diabetic Retinopathy Market Revenue (Million) Forecast, by Application 2019 & 2032
- Table 86: Italy Diabetic Retinopathy Market Volume (K Unit) Forecast, by Application 2019 & 2032
- Table 87: Spain Diabetic Retinopathy Market Revenue (Million) Forecast, by Application 2019 & 2032
- Table 88: Spain Diabetic Retinopathy Market Volume (K Unit) Forecast, by Application 2019 & 2032
- Table 89: Rest of Europe Diabetic Retinopathy Market Revenue (Million) Forecast, by Application 2019 & 2032
- Table 90: Rest of Europe Diabetic Retinopathy Market Volume (K Unit) Forecast, by Application 2019 & 2032
- Table 91: Global Diabetic Retinopathy Market Revenue Million Forecast, by Type 2019 & 2032
- Table 92: Global Diabetic Retinopathy Market Volume K Unit Forecast, by Type 2019 & 2032
- Table 93: Global Diabetic Retinopathy Market Revenue Million Forecast, by Management Approach 2019 & 2032
- Table 94: Global Diabetic Retinopathy Market Volume K Unit Forecast, by Management Approach 2019 & 2032
- Table 95: Global Diabetic Retinopathy Market Revenue Million Forecast, by Country 2019 & 2032
- Table 96: Global Diabetic Retinopathy Market Volume K Unit Forecast, by Country 2019 & 2032
- Table 97: China Diabetic Retinopathy Market Revenue (Million) Forecast, by Application 2019 & 2032
- Table 98: China Diabetic Retinopathy Market Volume (K Unit) Forecast, by Application 2019 & 2032
- Table 99: Japan Diabetic Retinopathy Market Revenue (Million) Forecast, by Application 2019 & 2032
- Table 100: Japan Diabetic Retinopathy Market Volume (K Unit) Forecast, by Application 2019 & 2032
- Table 101: India Diabetic Retinopathy Market Revenue (Million) Forecast, by Application 2019 & 2032
- Table 102: India Diabetic Retinopathy Market Volume (K Unit) Forecast, by Application 2019 & 2032
- Table 103: Australia Diabetic Retinopathy Market Revenue (Million) Forecast, by Application 2019 & 2032
- Table 104: Australia Diabetic Retinopathy Market Volume (K Unit) Forecast, by Application 2019 & 2032
- Table 105: South Korea Diabetic Retinopathy Market Revenue (Million) Forecast, by Application 2019 & 2032
- Table 106: South Korea Diabetic Retinopathy Market Volume (K Unit) Forecast, by Application 2019 & 2032
- Table 107: Rest of Asia Pacific Diabetic Retinopathy Market Revenue (Million) Forecast, by Application 2019 & 2032
- Table 108: Rest of Asia Pacific Diabetic Retinopathy Market Volume (K Unit) Forecast, by Application 2019 & 2032
- Table 109: Global Diabetic Retinopathy Market Revenue Million Forecast, by Type 2019 & 2032
- Table 110: Global Diabetic Retinopathy Market Volume K Unit Forecast, by Type 2019 & 2032
- Table 111: Global Diabetic Retinopathy Market Revenue Million Forecast, by Management Approach 2019 & 2032
- Table 112: Global Diabetic Retinopathy Market Volume K Unit Forecast, by Management Approach 2019 & 2032
- Table 113: Global Diabetic Retinopathy Market Revenue Million Forecast, by Country 2019 & 2032
- Table 114: Global Diabetic Retinopathy Market Volume K Unit Forecast, by Country 2019 & 2032
- Table 115: GCC Diabetic Retinopathy Market Revenue (Million) Forecast, by Application 2019 & 2032
- Table 116: GCC Diabetic Retinopathy Market Volume (K Unit) Forecast, by Application 2019 & 2032
- Table 117: South Africa Diabetic Retinopathy Market Revenue (Million) Forecast, by Application 2019 & 2032
- Table 118: South Africa Diabetic Retinopathy Market Volume (K Unit) Forecast, by Application 2019 & 2032
- Table 119: Rest of Middle East and Africa Diabetic Retinopathy Market Revenue (Million) Forecast, by Application 2019 & 2032
- Table 120: Rest of Middle East and Africa Diabetic Retinopathy Market Volume (K Unit) Forecast, by Application 2019 & 2032
- Table 121: Global Diabetic Retinopathy Market Revenue Million Forecast, by Type 2019 & 2032
- Table 122: Global Diabetic Retinopathy Market Volume K Unit Forecast, by Type 2019 & 2032
- Table 123: Global Diabetic Retinopathy Market Revenue Million Forecast, by Management Approach 2019 & 2032
- Table 124: Global Diabetic Retinopathy Market Volume K Unit Forecast, by Management Approach 2019 & 2032
- Table 125: Global Diabetic Retinopathy Market Revenue Million Forecast, by Country 2019 & 2032
- Table 126: Global Diabetic Retinopathy Market Volume K Unit Forecast, by Country 2019 & 2032
- Table 127: Brazil Diabetic Retinopathy Market Revenue (Million) Forecast, by Application 2019 & 2032
- Table 128: Brazil Diabetic Retinopathy Market Volume (K Unit) Forecast, by Application 2019 & 2032
- Table 129: Argentina Diabetic Retinopathy Market Revenue (Million) Forecast, by Application 2019 & 2032
- Table 130: Argentina Diabetic Retinopathy Market Volume (K Unit) Forecast, by Application 2019 & 2032
- Table 131: Rest of South America Diabetic Retinopathy Market Revenue (Million) Forecast, by Application 2019 & 2032
- Table 132: Rest of South America Diabetic Retinopathy Market Volume (K Unit) Forecast, by Application 2019 & 2032
Frequently Asked Questions
1. What is the projected Compound Annual Growth Rate (CAGR) of the Diabetic Retinopathy Market?
The projected CAGR is approximately 11.50%.
2. Which companies are prominent players in the Diabetic Retinopathy Market?
Key companies in the market include Regeneron Pharmaceuticals Inc, Novartis AG, Oxurion NV , AbbVie Inc (Allergan plc), Glycadia Pharmaceuticals, Alimera Sciences, BCN Peptides, F Hoffmann-La Roche Ltd (Genentech), Ocuphire Pharma.
3. What are the main segments of the Diabetic Retinopathy Market?
The market segments include Type, Management Approach.
4. Can you provide details about the market size?
The market size is estimated to be USD XX Million as of 2022.
5. What are some drivers contributing to market growth?
Rising Prevalence of Diabetes and Blindness Due to The Same; Growing Geriatric Population Base; Increasing Technological Advancements in Diabetic Retinopathy Surgical Instruments.
6. What are the notable trends driving market growth?
Proliferative diabetic retinopathy is Expected to Hold Significant Market Share in the Type Segment.
7. Are there any restraints impacting market growth?
Lack of Skilled Ophthalmologists; Extended Approval Time for Drugs.
8. Can you provide examples of recent developments in the market?
In June 2022, Regeneron Pharmaceuticals, Inc. announced that the United States Food and Drug Administration (FDA) accepted for review the EYLEA (aflibercept) Injection supplemental Biologics License Application (sBLA) for every 16-week 2 mg dosing regimen (after initial monthly doses) in patients with diabetic retinopathy (DR).
9. What pricing options are available for accessing the report?
Pricing options include single-user, multi-user, and enterprise licenses priced at USD 4750, USD 5250, and USD 8750 respectively.
10. Is the market size provided in terms of value or volume?
The market size is provided in terms of value, measured in Million and volume, measured in K Unit.
11. Are there any specific market keywords associated with the report?
Yes, the market keyword associated with the report is "Diabetic Retinopathy Market," which aids in identifying and referencing the specific market segment covered.
12. How do I determine which pricing option suits my needs best?
The pricing options vary based on user requirements and access needs. Individual users may opt for single-user licenses, while businesses requiring broader access may choose multi-user or enterprise licenses for cost-effective access to the report.
13. Are there any additional resources or data provided in the Diabetic Retinopathy Market report?
While the report offers comprehensive insights, it's advisable to review the specific contents or supplementary materials provided to ascertain if additional resources or data are available.
14. How can I stay updated on further developments or reports in the Diabetic Retinopathy Market?
To stay informed about further developments, trends, and reports in the Diabetic Retinopathy Market, consider subscribing to industry newsletters, following relevant companies and organizations, or regularly checking reputable industry news sources and publications.
Methodology
Step 1 - Identification of Relevant Samples Size from Population Database


Step 2 - Approaches for Defining Global Market Size (Value, Volume* & Price*)

Note*: In applicable scenarios
Step 3 - Data Sources
Primary Research
- Web Analytics
- Survey Reports
- Research Institute
- Latest Research Reports
- Opinion Leaders
Secondary Research
- Annual Reports
- White Paper
- Latest Press Release
- Industry Association
- Paid Database
- Investor Presentations

Step 4 - Data Triangulation
Involves using different sources of information in order to increase the validity of a study
These sources are likely to be stakeholders in a program - participants, other researchers, program staff, other community members, and so on.
Then we put all data in single framework & apply various statistical tools to find out the dynamic on the market.
During the analysis stage, feedback from the stakeholder groups would be compared to determine areas of agreement as well as areas of divergence


