

Key Insights
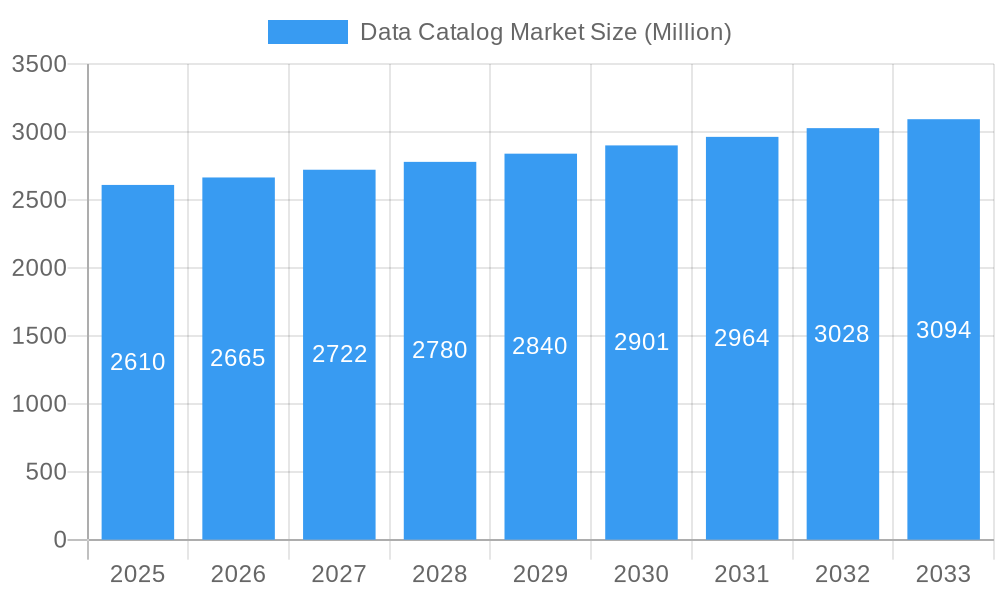
The Data Catalog market, valued at $2.61 billion in 2025, is projected to experience steady growth, driven by the increasing need for data governance, improved data quality, and accelerated digital transformation initiatives across various industries. The Compound Annual Growth Rate (CAGR) of 2.50% over the forecast period (2025-2033) indicates a consistent, albeit moderate, expansion. Key drivers include the rising volume and velocity of data generated by businesses, coupled with stricter data regulations like GDPR and CCPA, demanding robust data management solutions. The cloud deployment mode is expected to dominate the market due to its scalability, cost-effectiveness, and accessibility. BFSI (Banking, Financial Services, and Insurance), Retail & E-commerce, and Healthcare sectors are leading adopters, leveraging data catalogs to enhance operational efficiency, improve decision-making, and comply with regulatory requirements. While the market faces certain restraints, such as the initial investment costs associated with implementation and integration complexities, the long-term benefits of enhanced data discoverability, accessibility, and understanding outweigh these challenges. The competitive landscape is characterized by a mix of established players like IBM, Informatica, and Microsoft, as well as emerging innovative companies like Tamr and Collibra, constantly vying for market share through product enhancements and strategic partnerships. The market's geographical distribution is expected to be broad, with North America maintaining a significant share due to its advanced technological infrastructure and high adoption rate. However, regions like Asia Pacific are poised for significant growth, driven by increasing digitalization and expanding data volumes.
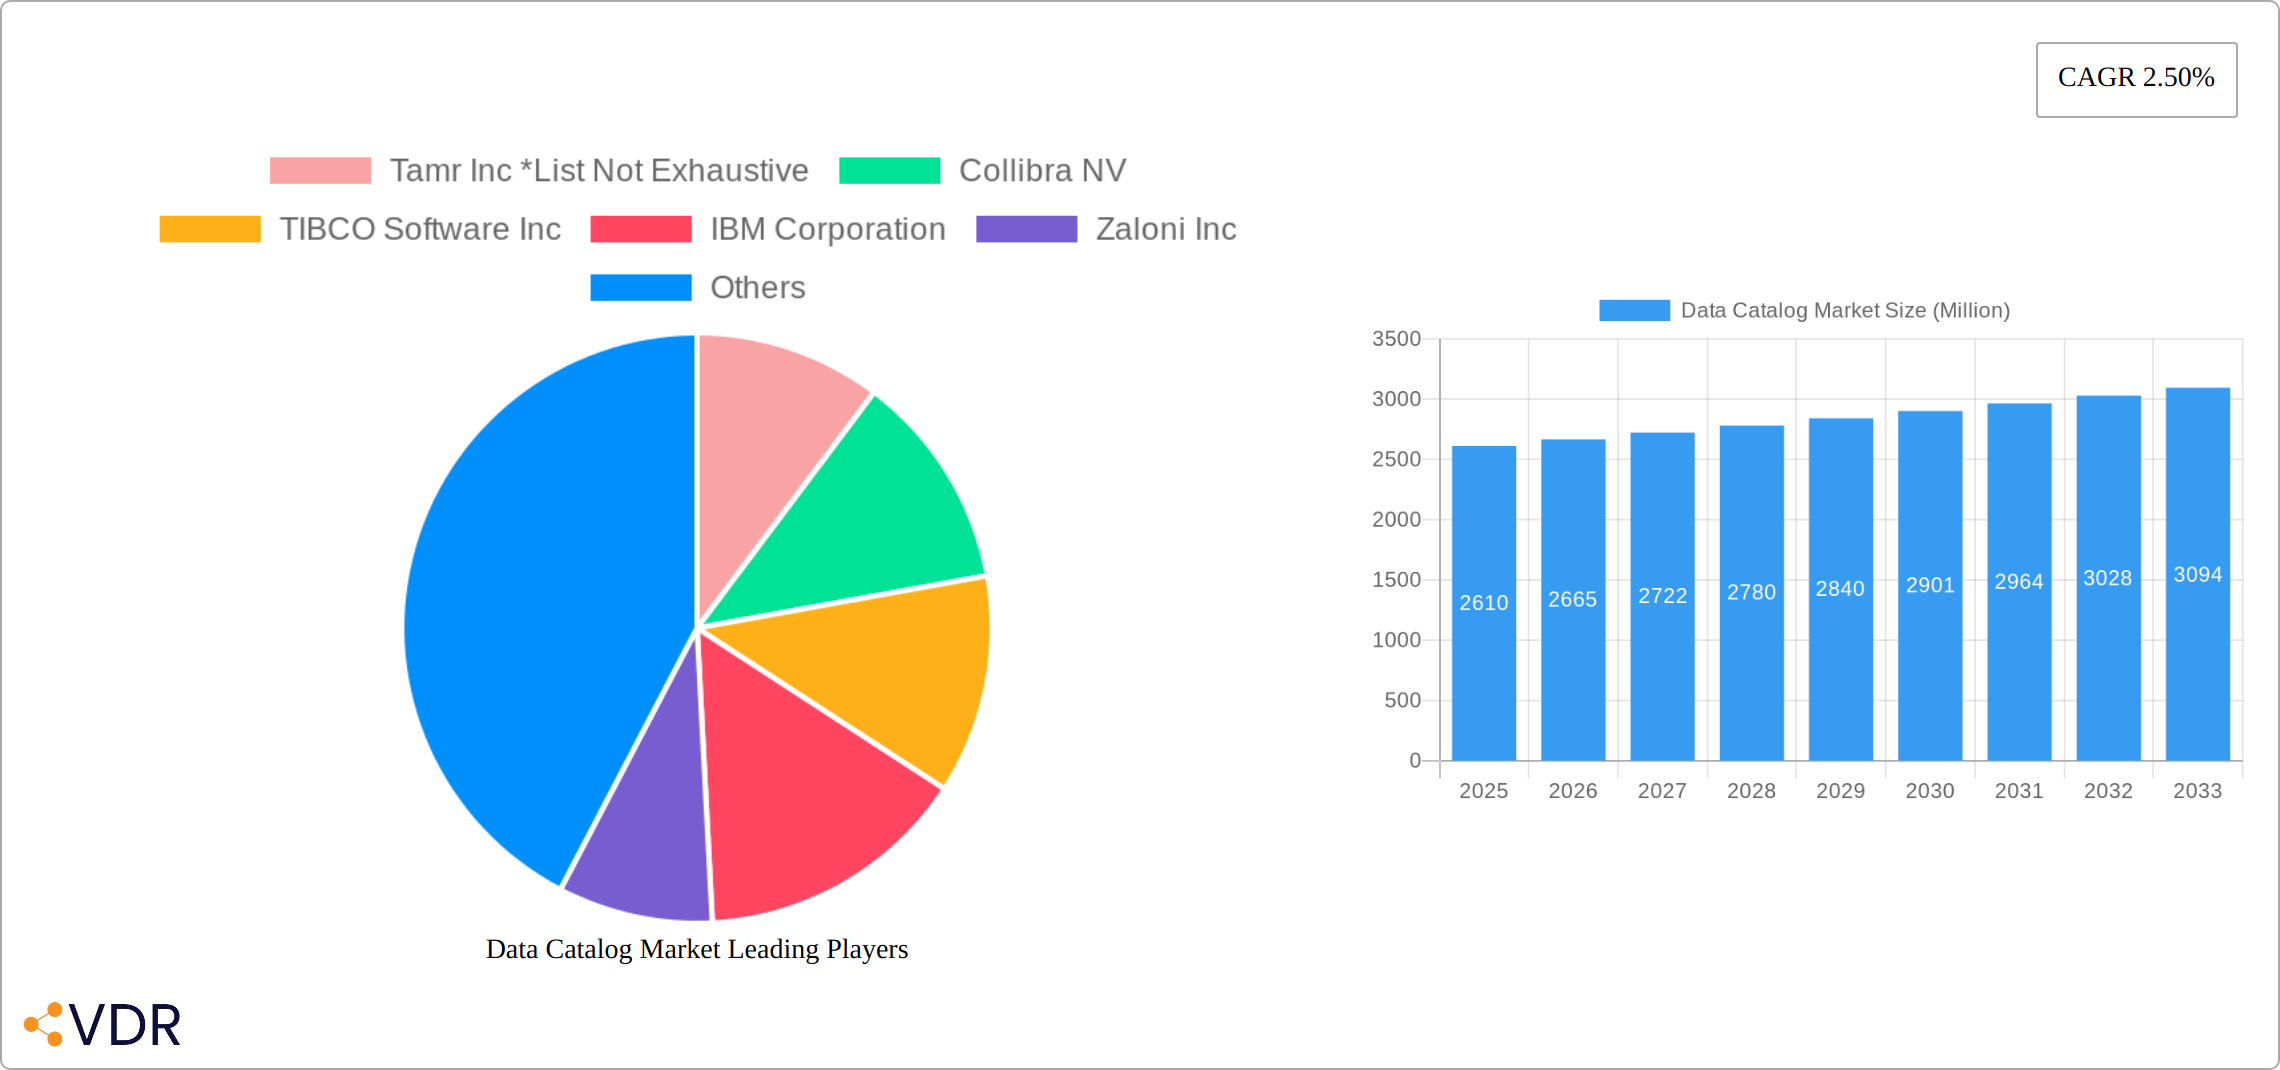
Data Catalog Market Market Size (In Billion)
The continued growth of the Data Catalog market hinges on the ability of vendors to address the evolving needs of businesses seeking streamlined data management. This includes focusing on improved user interfaces, enhanced data lineage tracking capabilities, and seamless integration with existing data ecosystems. Furthermore, the market will likely witness increased adoption of AI and machine learning capabilities within data catalog solutions to automate data discovery, classification, and metadata management, further enhancing efficiency and reducing manual intervention. The emergence of innovative business models, such as data-as-a-service (DaaS), could also play a significant role in shaping the market's future trajectory. Finally, sustained investments in research and development focused on improving the scalability, security, and overall user experience of data catalog platforms are vital for maintaining market momentum and driving further expansion.
Data Catalog Market Company Market Share
Data Catalog Market: A Comprehensive Report (2019-2033)
This in-depth report provides a comprehensive analysis of the Data Catalog Market, encompassing market dynamics, growth trends, regional segmentation, product landscape, key players, and future outlook. The study period covers 2019-2033, with 2025 as the base and estimated year. The report utilizes a robust methodology to forecast market values in millions of units, providing crucial insights for industry professionals, investors, and stakeholders.
Data Catalog Market Dynamics & Structure
The Data Catalog market is experiencing significant growth driven by the increasing volume and complexity of data generated by businesses across diverse sectors. Market concentration is moderate, with several key players vying for market share, leading to intense competition. Technological innovation, particularly in areas like AI and ML-powered data discovery, is a major driver. Regulatory frameworks like GDPR are influencing data governance strategies, fostering the adoption of data catalogs. While cloud-based solutions dominate, on-premise deployments persist, catering to specific security and compliance needs. The market witnesses considerable M&A activity, as larger players consolidate their position.
- Market Concentration: Moderately concentrated, with top 5 players holding approximately xx% market share in 2024.
- Technological Innovation: AI/ML-driven data discovery, automated metadata management, and integration with data lakes/warehouses are key innovation drivers.
- Regulatory Landscape: GDPR, CCPA, and other data privacy regulations drive demand for robust data governance solutions including data catalogs.
- Competitive Substitutes: Limited direct substitutes, but alternative data management tools offer overlapping functionalities.
- M&A Trends: A notable increase in M&A activity in the recent years, with xx deals recorded in 2024 (estimated).
- End-User Demographics: Large enterprises and government organizations are the primary adopters of Data Catalog solutions.
Data Catalog Market Growth Trends & Insights
The Data Catalog market is experiencing a period of significant growth, projected to expand substantially from 2025 to 2033. This expansion is fueled by several key factors: the exponential growth of data across all sectors, the accelerating digital transformation impacting various industries, and the increasing demand for robust data governance strategies. By 2033, the market is anticipated to reach xx million, exhibiting a Compound Annual Growth Rate (CAGR) of xx% throughout the forecast period. Adoption is rapidly increasing across numerous sectors, with the BFSI, healthcare, and retail industries demonstrating particularly strong growth. Technological advancements, particularly the proliferation of cloud computing and the integration of Artificial Intelligence (AI), are acting as powerful catalysts for market expansion. Furthermore, the prevailing trend of data-driven decision-making is solidifying the need for sophisticated data management solutions, further bolstering market demand. Market penetration, currently estimated at xx% in 2025, is projected to reach xx% by 2033. The widespread adoption of cloud-based solutions and the seamless integration of data catalogs within comprehensive data management platforms are significantly contributing to this market expansion.
Dominant Regions, Countries, or Segments in Data Catalog Market
North America currently holds the largest market share, followed by Europe. However, the Asia-Pacific region exhibits the highest growth potential, driven by rapid digital transformation and rising data volumes.
By Component:
- Solutions: Holds the larger market share, driven by the increasing demand for sophisticated data management tools.
- Services: The services segment is expected to witness significant growth, driven by the need for professional implementation, support, and maintenance services.
By Deployment Mode:
- Cloud: Dominates the market due to its scalability, cost-effectiveness, and ease of deployment.
- On-Premise: Maintains a significant share, particularly in industries with stringent data security and regulatory compliance requirements.
By End-user Industry:
- BFSI (Banking, Financial Services, and Insurance): A leading segment due to strict regulatory compliance and the need for efficient risk management.
- Retail & E-commerce: High growth potential due to the vast amounts of customer data generated and the need for personalized experiences.
- Healthcare: Growing adoption driven by the increasing importance of data analytics in improving patient care and research.
- Manufacturing: Adoption is increasing as manufacturers leverage data for process optimization and predictive maintenance.
Data Catalog Market Product Landscape
Data catalog products are evolving from simple metadata repositories to sophisticated platforms incorporating AI/ML for automated data discovery, classification, and enrichment. These platforms offer features like data lineage tracking, data quality monitoring, and seamless integration with various data sources. Key selling propositions include enhanced data discoverability, improved data governance, reduced data management costs, and accelerated data-driven decision-making. Technological advancements such as semantic search and natural language processing are further enhancing user experience and efficiency.
Key Drivers, Barriers & Challenges in Data Catalog Market
Key Drivers:
- Exponential data growth: The ever-increasing volume and velocity of data necessitates efficient and scalable data management solutions like data catalogs to ensure data discoverability and usability.
- Rising need for data governance: Stringent data privacy regulations (e.g., GDPR, CCPA) and the critical importance of data security are driving the demand for robust data catalogs to ensure compliance and mitigate risks.
- Increasing adoption of cloud computing: Cloud-based data catalogs offer unparalleled scalability, flexibility, and cost-effectiveness, making them attractive to organizations of all sizes.
- Improved Data Quality and Accuracy: Data catalogs contribute to improved data quality by providing a single source of truth and facilitating data lineage tracking.
- Enhanced Data Discoverability and Accessibility: Data catalogs empower users to quickly locate and understand data assets, reducing time spent searching for relevant information.
Key Challenges:
- High initial investment costs: Implementing and maintaining data catalog solutions can require significant upfront investment in software, hardware, and skilled personnel.
- Data integration complexities: Integrating data catalogs with diverse and disparate data sources can be technically challenging and time-consuming, requiring expertise in data integration techniques.
- Lack of skilled professionals: A shortage of professionals with the necessary expertise to implement, manage, and maintain data catalogs poses a significant hurdle to market growth.
- Data Catalog Complexity and Usability: Some data catalogs can be complex to use, requiring extensive training and potentially hindering user adoption.
- Maintaining Data Catalog Accuracy and Currency: Keeping the metadata within the data catalog up-to-date and accurate requires ongoing effort and resources.
Emerging Opportunities in Data Catalog Market
- Growth in the Internet of Things (IoT): The explosive growth of IoT devices generates massive volumes of data, creating significant demand for advanced data catalog solutions capable of handling this scale and complexity.
- Expansion into untapped markets: Emerging economies with rapidly developing digital infrastructures present considerable opportunities for data catalog vendors.
- Development of innovative applications: Integration with advanced analytics tools, AI/ML platforms, and other data management tools will generate new applications and functionalities, driving further growth.
- Artificial Intelligence (AI) and Machine Learning (ML) Integration: AI and ML can automate metadata tagging and classification, enhancing the efficiency and accuracy of data catalogs.
- Serverless Computing and Data Catalogs: The synergy between serverless computing and data catalogs provides opportunities for flexible, cost-effective, and scalable data management solutions.
Growth Accelerators in the Data Catalog Market Industry
The Data Catalog market is poised for sustained expansion, propelled by continuous technological innovations, strategic alliances between data management vendors and cloud providers, and the expansion into new geographic regions and industry verticals. The ever-increasing focus on data-driven decision-making across all sectors is a major driver of market growth, as organizations recognize the critical role of data catalogs in unlocking the value of their data assets.
Key Players Shaping the Data Catalog Market Market
- Tamr Inc
- Collibra NV
- TIBCO Software Inc
- IBM Corporation
- Zaloni Inc
- Informatica Inc
- Altair Engineering Inc
- Microsoft Corporation
- Amazon Web Services Inc
- Alation Inc
- Alteryx Inc
- Oracle Corporation
- Hitachi Vantara LLC
- SAP SE
Notable Milestones in Data Catalog Market Sector
- November 2022: Amazon EMR customers can now use AWS Glue Data Catalog from their streaming and batch SQL workflows on Flink.
- September 2022: Syniti updated its Syniti Knowledge Platform with new data quality and catalog capabilities.
- August 2022: Oracle Cloud Infrastructure collaborated with Anaconda to integrate its repository into OCI Machine Learning and Artificial Intelligence services.
In-Depth Data Catalog Market Market Outlook
The Data Catalog market is poised for sustained growth, driven by the ongoing digital transformation, increasing data volumes, and the growing need for effective data governance. Strategic partnerships, technological innovations, and expansion into new markets will further contribute to market expansion. The future holds significant opportunities for vendors offering advanced, AI-powered solutions that address the complexities of data management in a rapidly evolving digital landscape. The market is expected to continue its robust growth trajectory, presenting lucrative opportunities for both established players and new entrants.
Data Catalog Market Segmentation
-
1. Component
- 1.1. Solutions
- 1.2. Services
-
2. Deployment Mode
- 2.1. Cloud
- 2.2. On-Premise
-
3. End-user Industry
- 3.1. BFSI
- 3.2. Retail & E-commerce
- 3.3. Healthcare
- 3.4. Manufacturing
- 3.5. Other End-user Industries
Data Catalog Market Segmentation By Geography
- 1. North America
- 2. Europe
- 3. Asia Pacific
- 4. Latin America
- 5. Middle East and Africa
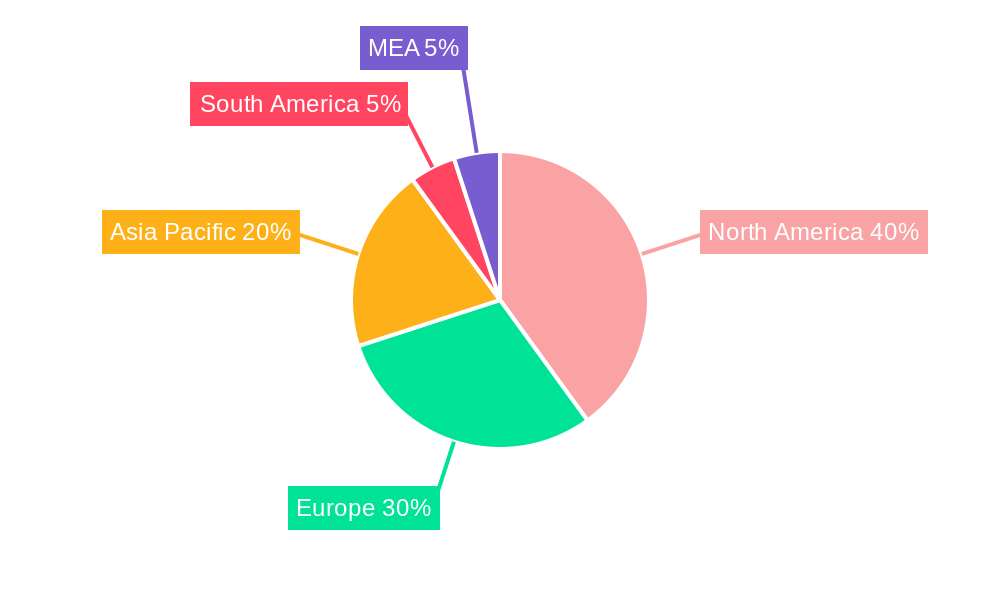
Data Catalog Market Regional Market Share
Geographic Coverage of Data Catalog Market
Data Catalog Market REPORT HIGHLIGHTS
| Aspects | Details |
|---|---|
| Study Period | 2020-2034 |
| Base Year | 2025 |
| Estimated Year | 2026 |
| Forecast Period | 2026-2034 |
| Historical Period | 2020-2025 |
| Growth Rate | CAGR of 2.50% from 2020-2034 |
| Segmentation |
|
Table of Contents
- 1. Introduction
- 1.1. Research Scope
- 1.2. Market Segmentation
- 1.3. Research Methodology
- 1.4. Definitions and Assumptions
- 2. Executive Summary
- 2.1. Introduction
- 3. Market Dynamics
- 3.1. Introduction
- 3.2. Market Drivers
- 3.2.1. Growing adoption of Cloud Based Solutions; Solutions Segment is Expected to Hold a Larger Market Size
- 3.3. Market Restrains
- 3.3.1. Lack of Standardization and Security Concerns
- 3.4. Market Trends
- 3.4.1. Solutions Segment is Expected to Hold a Larger Market Size
- 4. Market Factor Analysis
- 4.1. Porters Five Forces
- 4.2. Supply/Value Chain
- 4.3. PESTEL analysis
- 4.4. Market Entropy
- 4.5. Patent/Trademark Analysis
- 5. Global Data Catalog Market Analysis, Insights and Forecast, 2020-2032
- 5.1. Market Analysis, Insights and Forecast - by Component
- 5.1.1. Solutions
- 5.1.2. Services
- 5.2. Market Analysis, Insights and Forecast - by Deployment Mode
- 5.2.1. Cloud
- 5.2.2. On-Premise
- 5.3. Market Analysis, Insights and Forecast - by End-user Industry
- 5.3.1. BFSI
- 5.3.2. Retail & E-commerce
- 5.3.3. Healthcare
- 5.3.4. Manufacturing
- 5.3.5. Other End-user Industries
- 5.4. Market Analysis, Insights and Forecast - by Region
- 5.4.1. North America
- 5.4.2. Europe
- 5.4.3. Asia Pacific
- 5.4.4. Latin America
- 5.4.5. Middle East and Africa
- 5.1. Market Analysis, Insights and Forecast - by Component
- 6. North America Data Catalog Market Analysis, Insights and Forecast, 2020-2032
- 6.1. Market Analysis, Insights and Forecast - by Component
- 6.1.1. Solutions
- 6.1.2. Services
- 6.2. Market Analysis, Insights and Forecast - by Deployment Mode
- 6.2.1. Cloud
- 6.2.2. On-Premise
- 6.3. Market Analysis, Insights and Forecast - by End-user Industry
- 6.3.1. BFSI
- 6.3.2. Retail & E-commerce
- 6.3.3. Healthcare
- 6.3.4. Manufacturing
- 6.3.5. Other End-user Industries
- 6.1. Market Analysis, Insights and Forecast - by Component
- 7. Europe Data Catalog Market Analysis, Insights and Forecast, 2020-2032
- 7.1. Market Analysis, Insights and Forecast - by Component
- 7.1.1. Solutions
- 7.1.2. Services
- 7.2. Market Analysis, Insights and Forecast - by Deployment Mode
- 7.2.1. Cloud
- 7.2.2. On-Premise
- 7.3. Market Analysis, Insights and Forecast - by End-user Industry
- 7.3.1. BFSI
- 7.3.2. Retail & E-commerce
- 7.3.3. Healthcare
- 7.3.4. Manufacturing
- 7.3.5. Other End-user Industries
- 7.1. Market Analysis, Insights and Forecast - by Component
- 8. Asia Pacific Data Catalog Market Analysis, Insights and Forecast, 2020-2032
- 8.1. Market Analysis, Insights and Forecast - by Component
- 8.1.1. Solutions
- 8.1.2. Services
- 8.2. Market Analysis, Insights and Forecast - by Deployment Mode
- 8.2.1. Cloud
- 8.2.2. On-Premise
- 8.3. Market Analysis, Insights and Forecast - by End-user Industry
- 8.3.1. BFSI
- 8.3.2. Retail & E-commerce
- 8.3.3. Healthcare
- 8.3.4. Manufacturing
- 8.3.5. Other End-user Industries
- 8.1. Market Analysis, Insights and Forecast - by Component
- 9. Latin America Data Catalog Market Analysis, Insights and Forecast, 2020-2032
- 9.1. Market Analysis, Insights and Forecast - by Component
- 9.1.1. Solutions
- 9.1.2. Services
- 9.2. Market Analysis, Insights and Forecast - by Deployment Mode
- 9.2.1. Cloud
- 9.2.2. On-Premise
- 9.3. Market Analysis, Insights and Forecast - by End-user Industry
- 9.3.1. BFSI
- 9.3.2. Retail & E-commerce
- 9.3.3. Healthcare
- 9.3.4. Manufacturing
- 9.3.5. Other End-user Industries
- 9.1. Market Analysis, Insights and Forecast - by Component
- 10. Middle East and Africa Data Catalog Market Analysis, Insights and Forecast, 2020-2032
- 10.1. Market Analysis, Insights and Forecast - by Component
- 10.1.1. Solutions
- 10.1.2. Services
- 10.2. Market Analysis, Insights and Forecast - by Deployment Mode
- 10.2.1. Cloud
- 10.2.2. On-Premise
- 10.3. Market Analysis, Insights and Forecast - by End-user Industry
- 10.3.1. BFSI
- 10.3.2. Retail & E-commerce
- 10.3.3. Healthcare
- 10.3.4. Manufacturing
- 10.3.5. Other End-user Industries
- 10.1. Market Analysis, Insights and Forecast - by Component
- 11. Competitive Analysis
- 11.1. Global Market Share Analysis 2025
- 11.2. Company Profiles
- 11.2.1 Tamr Inc *List Not Exhaustive
- 11.2.1.1. Overview
- 11.2.1.2. Products
- 11.2.1.3. SWOT Analysis
- 11.2.1.4. Recent Developments
- 11.2.1.5. Financials (Based on Availability)
- 11.2.2 Collibra NV
- 11.2.2.1. Overview
- 11.2.2.2. Products
- 11.2.2.3. SWOT Analysis
- 11.2.2.4. Recent Developments
- 11.2.2.5. Financials (Based on Availability)
- 11.2.3 TIBCO Software Inc
- 11.2.3.1. Overview
- 11.2.3.2. Products
- 11.2.3.3. SWOT Analysis
- 11.2.3.4. Recent Developments
- 11.2.3.5. Financials (Based on Availability)
- 11.2.4 IBM Corporation
- 11.2.4.1. Overview
- 11.2.4.2. Products
- 11.2.4.3. SWOT Analysis
- 11.2.4.4. Recent Developments
- 11.2.4.5. Financials (Based on Availability)
- 11.2.5 Zaloni Inc
- 11.2.5.1. Overview
- 11.2.5.2. Products
- 11.2.5.3. SWOT Analysis
- 11.2.5.4. Recent Developments
- 11.2.5.5. Financials (Based on Availability)
- 11.2.6 Informatica Inc
- 11.2.6.1. Overview
- 11.2.6.2. Products
- 11.2.6.3. SWOT Analysis
- 11.2.6.4. Recent Developments
- 11.2.6.5. Financials (Based on Availability)
- 11.2.7 Altair Enginnering Inc
- 11.2.7.1. Overview
- 11.2.7.2. Products
- 11.2.7.3. SWOT Analysis
- 11.2.7.4. Recent Developments
- 11.2.7.5. Financials (Based on Availability)
- 11.2.8 Microsoft Corporation
- 11.2.8.1. Overview
- 11.2.8.2. Products
- 11.2.8.3. SWOT Analysis
- 11.2.8.4. Recent Developments
- 11.2.8.5. Financials (Based on Availability)
- 11.2.9 Amazon Web Services Inc
- 11.2.9.1. Overview
- 11.2.9.2. Products
- 11.2.9.3. SWOT Analysis
- 11.2.9.4. Recent Developments
- 11.2.9.5. Financials (Based on Availability)
- 11.2.10 Alation Inc
- 11.2.10.1. Overview
- 11.2.10.2. Products
- 11.2.10.3. SWOT Analysis
- 11.2.10.4. Recent Developments
- 11.2.10.5. Financials (Based on Availability)
- 11.2.11 Alteryx Inc
- 11.2.11.1. Overview
- 11.2.11.2. Products
- 11.2.11.3. SWOT Analysis
- 11.2.11.4. Recent Developments
- 11.2.11.5. Financials (Based on Availability)
- 11.2.12 Oracle Corporation
- 11.2.12.1. Overview
- 11.2.12.2. Products
- 11.2.12.3. SWOT Analysis
- 11.2.12.4. Recent Developments
- 11.2.12.5. Financials (Based on Availability)
- 11.2.13 Hitachi Vantara LLC
- 11.2.13.1. Overview
- 11.2.13.2. Products
- 11.2.13.3. SWOT Analysis
- 11.2.13.4. Recent Developments
- 11.2.13.5. Financials (Based on Availability)
- 11.2.14 SAP SE
- 11.2.14.1. Overview
- 11.2.14.2. Products
- 11.2.14.3. SWOT Analysis
- 11.2.14.4. Recent Developments
- 11.2.14.5. Financials (Based on Availability)
- 11.2.1 Tamr Inc *List Not Exhaustive
List of Figures
- Figure 1: Global Data Catalog Market Revenue Breakdown (Million, %) by Region 2025 & 2033
- Figure 2: North America Data Catalog Market Revenue (Million), by Component 2025 & 2033
- Figure 3: North America Data Catalog Market Revenue Share (%), by Component 2025 & 2033
- Figure 4: North America Data Catalog Market Revenue (Million), by Deployment Mode 2025 & 2033
- Figure 5: North America Data Catalog Market Revenue Share (%), by Deployment Mode 2025 & 2033
- Figure 6: North America Data Catalog Market Revenue (Million), by End-user Industry 2025 & 2033
- Figure 7: North America Data Catalog Market Revenue Share (%), by End-user Industry 2025 & 2033
- Figure 8: North America Data Catalog Market Revenue (Million), by Country 2025 & 2033
- Figure 9: North America Data Catalog Market Revenue Share (%), by Country 2025 & 2033
- Figure 10: Europe Data Catalog Market Revenue (Million), by Component 2025 & 2033
- Figure 11: Europe Data Catalog Market Revenue Share (%), by Component 2025 & 2033
- Figure 12: Europe Data Catalog Market Revenue (Million), by Deployment Mode 2025 & 2033
- Figure 13: Europe Data Catalog Market Revenue Share (%), by Deployment Mode 2025 & 2033
- Figure 14: Europe Data Catalog Market Revenue (Million), by End-user Industry 2025 & 2033
- Figure 15: Europe Data Catalog Market Revenue Share (%), by End-user Industry 2025 & 2033
- Figure 16: Europe Data Catalog Market Revenue (Million), by Country 2025 & 2033
- Figure 17: Europe Data Catalog Market Revenue Share (%), by Country 2025 & 2033
- Figure 18: Asia Pacific Data Catalog Market Revenue (Million), by Component 2025 & 2033
- Figure 19: Asia Pacific Data Catalog Market Revenue Share (%), by Component 2025 & 2033
- Figure 20: Asia Pacific Data Catalog Market Revenue (Million), by Deployment Mode 2025 & 2033
- Figure 21: Asia Pacific Data Catalog Market Revenue Share (%), by Deployment Mode 2025 & 2033
- Figure 22: Asia Pacific Data Catalog Market Revenue (Million), by End-user Industry 2025 & 2033
- Figure 23: Asia Pacific Data Catalog Market Revenue Share (%), by End-user Industry 2025 & 2033
- Figure 24: Asia Pacific Data Catalog Market Revenue (Million), by Country 2025 & 2033
- Figure 25: Asia Pacific Data Catalog Market Revenue Share (%), by Country 2025 & 2033
- Figure 26: Latin America Data Catalog Market Revenue (Million), by Component 2025 & 2033
- Figure 27: Latin America Data Catalog Market Revenue Share (%), by Component 2025 & 2033
- Figure 28: Latin America Data Catalog Market Revenue (Million), by Deployment Mode 2025 & 2033
- Figure 29: Latin America Data Catalog Market Revenue Share (%), by Deployment Mode 2025 & 2033
- Figure 30: Latin America Data Catalog Market Revenue (Million), by End-user Industry 2025 & 2033
- Figure 31: Latin America Data Catalog Market Revenue Share (%), by End-user Industry 2025 & 2033
- Figure 32: Latin America Data Catalog Market Revenue (Million), by Country 2025 & 2033
- Figure 33: Latin America Data Catalog Market Revenue Share (%), by Country 2025 & 2033
- Figure 34: Middle East and Africa Data Catalog Market Revenue (Million), by Component 2025 & 2033
- Figure 35: Middle East and Africa Data Catalog Market Revenue Share (%), by Component 2025 & 2033
- Figure 36: Middle East and Africa Data Catalog Market Revenue (Million), by Deployment Mode 2025 & 2033
- Figure 37: Middle East and Africa Data Catalog Market Revenue Share (%), by Deployment Mode 2025 & 2033
- Figure 38: Middle East and Africa Data Catalog Market Revenue (Million), by End-user Industry 2025 & 2033
- Figure 39: Middle East and Africa Data Catalog Market Revenue Share (%), by End-user Industry 2025 & 2033
- Figure 40: Middle East and Africa Data Catalog Market Revenue (Million), by Country 2025 & 2033
- Figure 41: Middle East and Africa Data Catalog Market Revenue Share (%), by Country 2025 & 2033
List of Tables
- Table 1: Global Data Catalog Market Revenue Million Forecast, by Component 2020 & 2033
- Table 2: Global Data Catalog Market Revenue Million Forecast, by Deployment Mode 2020 & 2033
- Table 3: Global Data Catalog Market Revenue Million Forecast, by End-user Industry 2020 & 2033
- Table 4: Global Data Catalog Market Revenue Million Forecast, by Region 2020 & 2033
- Table 5: Global Data Catalog Market Revenue Million Forecast, by Component 2020 & 2033
- Table 6: Global Data Catalog Market Revenue Million Forecast, by Deployment Mode 2020 & 2033
- Table 7: Global Data Catalog Market Revenue Million Forecast, by End-user Industry 2020 & 2033
- Table 8: Global Data Catalog Market Revenue Million Forecast, by Country 2020 & 2033
- Table 9: Global Data Catalog Market Revenue Million Forecast, by Component 2020 & 2033
- Table 10: Global Data Catalog Market Revenue Million Forecast, by Deployment Mode 2020 & 2033
- Table 11: Global Data Catalog Market Revenue Million Forecast, by End-user Industry 2020 & 2033
- Table 12: Global Data Catalog Market Revenue Million Forecast, by Country 2020 & 2033
- Table 13: Global Data Catalog Market Revenue Million Forecast, by Component 2020 & 2033
- Table 14: Global Data Catalog Market Revenue Million Forecast, by Deployment Mode 2020 & 2033
- Table 15: Global Data Catalog Market Revenue Million Forecast, by End-user Industry 2020 & 2033
- Table 16: Global Data Catalog Market Revenue Million Forecast, by Country 2020 & 2033
- Table 17: Global Data Catalog Market Revenue Million Forecast, by Component 2020 & 2033
- Table 18: Global Data Catalog Market Revenue Million Forecast, by Deployment Mode 2020 & 2033
- Table 19: Global Data Catalog Market Revenue Million Forecast, by End-user Industry 2020 & 2033
- Table 20: Global Data Catalog Market Revenue Million Forecast, by Country 2020 & 2033
- Table 21: Global Data Catalog Market Revenue Million Forecast, by Component 2020 & 2033
- Table 22: Global Data Catalog Market Revenue Million Forecast, by Deployment Mode 2020 & 2033
- Table 23: Global Data Catalog Market Revenue Million Forecast, by End-user Industry 2020 & 2033
- Table 24: Global Data Catalog Market Revenue Million Forecast, by Country 2020 & 2033
Frequently Asked Questions
1. What is the projected Compound Annual Growth Rate (CAGR) of the Data Catalog Market?
The projected CAGR is approximately 2.50%.
2. Which companies are prominent players in the Data Catalog Market?
Key companies in the market include Tamr Inc *List Not Exhaustive, Collibra NV, TIBCO Software Inc, IBM Corporation, Zaloni Inc, Informatica Inc, Altair Enginnering Inc, Microsoft Corporation, Amazon Web Services Inc, Alation Inc, Alteryx Inc, Oracle Corporation, Hitachi Vantara LLC, SAP SE.
3. What are the main segments of the Data Catalog Market?
The market segments include Component, Deployment Mode, End-user Industry.
4. Can you provide details about the market size?
The market size is estimated to be USD 2.61 Million as of 2022.
5. What are some drivers contributing to market growth?
Growing adoption of Cloud Based Solutions; Solutions Segment is Expected to Hold a Larger Market Size.
6. What are the notable trends driving market growth?
Solutions Segment is Expected to Hold a Larger Market Size.
7. Are there any restraints impacting market growth?
Lack of Standardization and Security Concerns.
8. Can you provide examples of recent developments in the market?
November 2022 - Amazon EMR customers can now use AWS Glue Data Catalog from their streaming and batch SQL workflows on Flink. The AWS Glue Data Catalog is an Apache Hive metastore-compatible catalog. With this release, Companies can directly run Flink SQL queries against the tables stored in the Data Catalog.
9. What pricing options are available for accessing the report?
Pricing options include single-user, multi-user, and enterprise licenses priced at USD 4750, USD 5250, and USD 8750 respectively.
10. Is the market size provided in terms of value or volume?
The market size is provided in terms of value, measured in Million.
11. Are there any specific market keywords associated with the report?
Yes, the market keyword associated with the report is "Data Catalog Market," which aids in identifying and referencing the specific market segment covered.
12. How do I determine which pricing option suits my needs best?
The pricing options vary based on user requirements and access needs. Individual users may opt for single-user licenses, while businesses requiring broader access may choose multi-user or enterprise licenses for cost-effective access to the report.
13. Are there any additional resources or data provided in the Data Catalog Market report?
While the report offers comprehensive insights, it's advisable to review the specific contents or supplementary materials provided to ascertain if additional resources or data are available.
14. How can I stay updated on further developments or reports in the Data Catalog Market?
To stay informed about further developments, trends, and reports in the Data Catalog Market, consider subscribing to industry newsletters, following relevant companies and organizations, or regularly checking reputable industry news sources and publications.
Methodology
Step 1 - Identification of Relevant Samples Size from Population Database


Step 2 - Approaches for Defining Global Market Size (Value, Volume* & Price*)

Note*: In applicable scenarios
Step 3 - Data Sources
Primary Research
- Web Analytics
- Survey Reports
- Research Institute
- Latest Research Reports
- Opinion Leaders
Secondary Research
- Annual Reports
- White Paper
- Latest Press Release
- Industry Association
- Paid Database
- Investor Presentations

Step 4 - Data Triangulation
Involves using different sources of information in order to increase the validity of a study
These sources are likely to be stakeholders in a program - participants, other researchers, program staff, other community members, and so on.
Then we put all data in single framework & apply various statistical tools to find out the dynamic on the market.
During the analysis stage, feedback from the stakeholder groups would be compared to determine areas of agreement as well as areas of divergence