

Key Insights
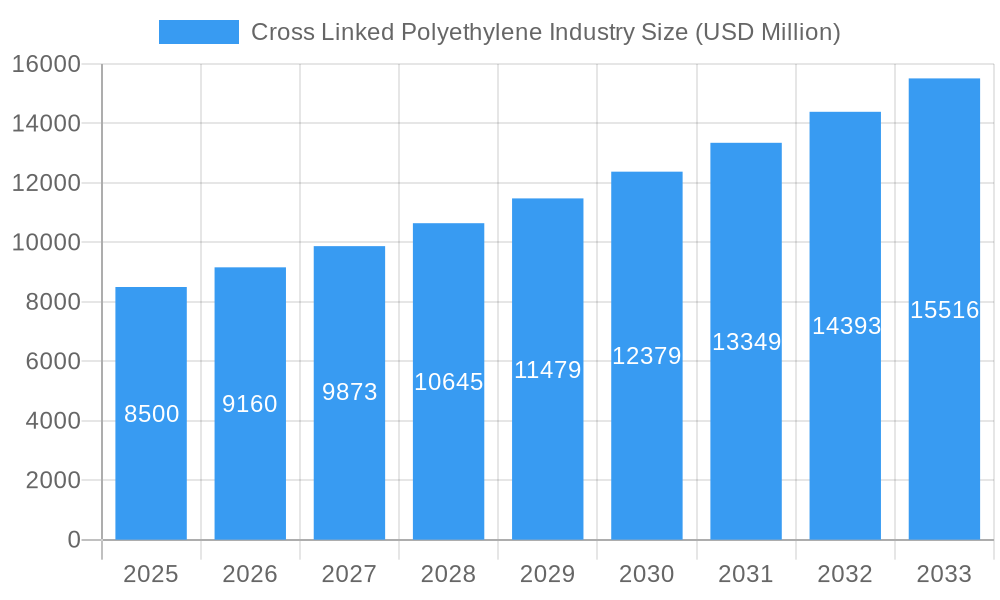
The global Cross Linked Polyethylene (XLPE) market is poised for robust expansion, projected to reach a substantial USD 8.5 billion in 2025. This growth is driven by an impressive Compound Annual Growth Rate (CAGR) of 7.7%, indicating a dynamic and expanding industry. Key growth enablers include the escalating demand from the building and construction sector, fueled by infrastructure development and urbanization initiatives worldwide. Furthermore, the burgeoning electrical and electronics industry, with its increasing reliance on high-performance insulation materials for cables and wires, is a significant contributor. The automotive sector's adoption of XLPE for lightweighting and enhanced electrical system reliability also plays a crucial role. Emerging economies, particularly in the Asia Pacific region, are expected to lead this growth trajectory due to rapid industrialization and a growing middle class, translating to increased consumption of XLPE-based products.
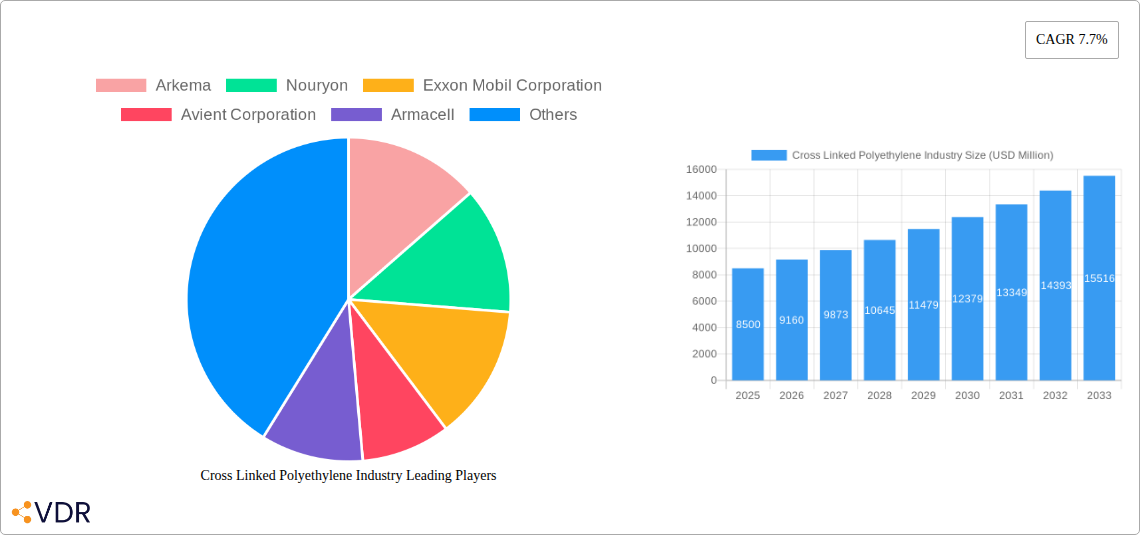
Cross Linked Polyethylene Industry Market Size (In Billion)
The market's upward momentum is further bolstered by technological advancements leading to improved XLPE formulations and manufacturing processes, offering enhanced durability, thermal resistance, and electrical properties. While the market exhibits strong growth potential, certain factors may influence its trajectory. Restraints such as fluctuating raw material prices, particularly for polyethylene, and stringent environmental regulations pertaining to plastic production and disposal, could pose challenges. However, ongoing innovation in recycling technologies and the development of bio-based XLPE alternatives are expected to mitigate some of these concerns. The competitive landscape features prominent players like Arkema, Nouryon, Exxon Mobil Corporation, and Dow, among others, all vying for market share through product innovation and strategic partnerships, ensuring a vibrant and evolving market.
Cross Linked Polyethylene Industry Company Market Share
This in-depth report provides a definitive analysis of the global Cross Linked Polyethylene (XLPE/PEX) industry, offering critical insights into market dynamics, growth trajectories, and future opportunities. Covering the period from 2019 to 2033, with a base year of 2025, this research is indispensable for stakeholders seeking to understand market segmentation, technological advancements, and the competitive landscape.
Cross Linked Polyethylene Industry Market Dynamics & Structure
The cross-linked polyethylene market is characterized by moderate to high concentration, with key players investing heavily in research and development to enhance product performance and sustainability. Technological innovation is a primary driver, particularly in developing novel cross-linking methods and improving recyclability. Regulatory frameworks, especially concerning environmental impact and material safety in applications like drinking water pipes, are increasingly influential. Competitive product substitutes, such as PVC and metal piping systems, pose ongoing challenges, necessitating continuous product differentiation and cost-competitiveness. End-user demographics are shifting towards a greater demand for durable, reliable, and environmentally friendly materials across various sectors. Mergers and acquisitions (M&A) activity plays a role in market consolidation and strategic expansion.
- Market Concentration: Dominated by a few key global manufacturers with significant market share, yet with emerging regional players.
- Technological Innovation Drivers: Focus on enhanced thermal resistance, chemical inertness, improved mechanical strength, and sustainable manufacturing processes.
- Regulatory Frameworks: Stringent regulations on materials used in potable water systems and increasing emphasis on recyclability and reduced environmental footprint.
- Competitive Product Substitutes: Metal pipes (copper, steel), PVC pipes, and other advanced polymer solutions.
- End-User Demographics: Growing demand from the construction sector for infrastructure, the automotive industry for lightweight components, and the electrical industry for insulation.
- M&A Trends: Strategic acquisitions to gain market share, expand product portfolios, and integrate advanced technologies.
Cross Linked Polyethylene Industry Growth Trends & Insights
The cross-linked polyethylene market is poised for robust growth, driven by increasing global demand for high-performance materials in critical applications. The market size is projected to reach $XX billion by 2025, with a compound annual growth rate (CAGR) of XX% forecasted through 2033. This expansion is fueled by escalating infrastructure development projects worldwide, particularly in emerging economies, where XLPE's superior durability and longevity make it a preferred choice for water and gas distribution networks. The adoption rate of XLPE is accelerating as awareness of its benefits, including resistance to stress cracking and high temperatures, grows among engineers and specifiers. Technological disruptions, such as advancements in chemical and mechanical recycling processes, are paving the way for more sustainable XLPE solutions, appealing to environmentally conscious consumers and industries. Consumer behavior shifts are also playing a significant role, with a discernible preference for materials that offer long-term reliability and reduced environmental impact. The market penetration of XLPE in applications like underfloor heating systems, solar thermal piping, and advanced electrical insulation is expected to rise considerably. This growth narrative is further supported by innovations in cross-linking technologies that enhance processing efficiency and material properties, leading to wider applications and increased market adoption. The industry is actively exploring new formulations and manufacturing techniques to cater to specialized requirements across diverse end-user segments, solidifying XLPE's position as a leading material solution. The estimated market size in 2025 is expected to be $XX billion.
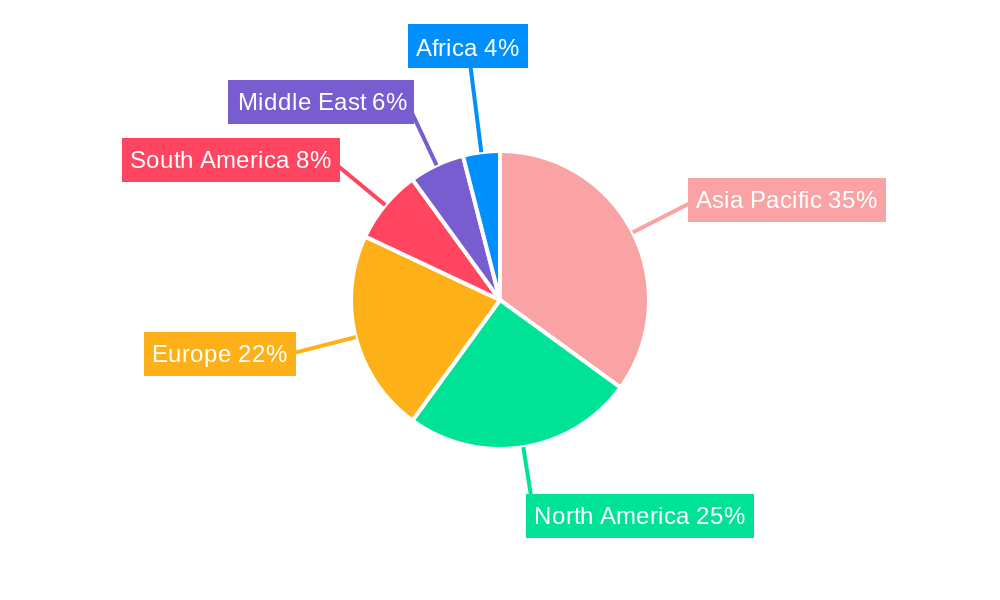
Dominant Regions, Countries, or Segments in Cross Linked Polyethylene Industry
The global Cross Linked Polyethylene (XLPE/PEX) market is experiencing significant growth, with distinct regional and segment leadership. Asia Pacific is emerging as a dominant region, propelled by rapid industrialization, extensive infrastructure development, and a burgeoning construction sector. Countries like China and India are major contributors, with substantial investments in water management systems, residential plumbing, and electrical infrastructure that heavily rely on XLPE. The Building and Construction end-user industry, particularly for piping systems in residential, commercial, and industrial applications, represents the largest segment, driven by the demand for durable, corrosion-resistant, and long-lasting materials. The adoption of PEX pipes for hot and cold water supply, radiant heating, and snow melting systems is a key growth driver.
- Dominant Region: Asia Pacific, driven by massive infrastructure projects and urbanization.
- Key Countries: China, India, Southeast Asian nations.
- Growth Drivers: Government investments in water and sanitation, increasing housing demand, and expanding industrial complexes.
- Dominant End-User Industry: Building and Construction.
- Market Share: Significant portion of the overall XLPE market.
- Key Applications: Potable water pipes (hot and cold), radiant heating systems, plumbing, and industrial fluid transport.
- Factors: Superior chemical resistance, thermal stability, flexibility, and ease of installation compared to traditional materials.
- Dominant Type: High-density Polyethylene (HDPE) based XLPE, offering a balance of mechanical strength, chemical resistance, and cost-effectiveness.
- Market Penetration: Widely used in infrastructure and construction due to its established performance characteristics.
- Emerging Dominance in Electrical and Electronics: Increasing demand for XLPE in high-voltage cable insulation due to its excellent dielectric properties and thermal resistance.
- Growth Potential: Driven by the expansion of power grids, renewable energy projects, and the automotive industry's shift towards electric vehicles.
Cross Linked Polyethylene Industry Product Landscape
The product landscape of the cross-linked polyethylene industry is defined by its versatility and performance-driven innovations. XLPE materials are engineered to exhibit superior thermal stability, chemical resistance, and mechanical strength compared to conventional polyethylene. This makes them ideal for demanding applications such as high-performance piping for potable water and industrial fluids, advanced insulation for electrical cables, and durable components in the automotive sector. Innovations focus on enhancing properties like creep resistance, UV stability, and ease of processing. The development of specialized grades, such as PEX-a, PEX-b, and PEX-c, caters to specific application needs, offering unique performance characteristics. The product lifecycle is also being influenced by a growing emphasis on sustainability, leading to the development of XLPE compounds with recycled content and improved recyclability.
Key Drivers, Barriers & Challenges in Cross Linked Polyethylene Industry
The Cross Linked Polyethylene (XLPE) industry is propelled by several key drivers, including the escalating demand for durable and corrosion-resistant piping systems in infrastructure development, particularly in emerging economies. Technological advancements in cross-linking processes are enhancing material performance, enabling wider applications. The growing emphasis on energy efficiency and renewable energy sources also drives demand for XLPE in cable insulation and solar thermal systems.
- Key Drivers:
- Infrastructure development and urbanization globally.
- Demand for long-lasting and reliable piping solutions.
- Growth in the electrical and electronics sector for insulation.
- Advancements in cross-linking technologies.
- Increasing adoption of sustainable materials.
Conversely, the industry faces significant barriers and challenges. Fluctuations in raw material prices, primarily polyethylene and cross-linking agents, can impact profitability. Intense competition from alternative materials like PVC and metal pipes, coupled with established installation practices, presents a persistent hurdle. Regulatory complexities and the need for stringent quality control in sensitive applications, such as potable water systems, add to operational challenges. Supply chain disruptions and geopolitical uncertainties can also affect production and distribution.
- Barriers & Challenges:
- Volatility in raw material prices.
- Competition from alternative materials (PVC, metal).
- Stringent regulatory requirements and quality standards.
- Supply chain vulnerabilities and logistics complexities.
- High initial investment for specialized manufacturing equipment.
Emerging Opportunities in Cross Linked Polyethylene Industry
Emerging opportunities within the Cross Linked Polyethylene (XLPE) industry are largely centered around sustainability and expanding applications. The growing global push for a circular economy presents a significant avenue for innovation in recycling technologies for XLPE, enabling the creation of high-quality recycled content for new products. Untapped markets in developing regions with increasing infrastructure needs offer substantial growth potential. Furthermore, the evolving automotive industry's demand for lightweight, high-performance materials for electric vehicles and advanced battery systems presents a promising new frontier. There is also a growing interest in smart XLPE materials with embedded sensing capabilities for infrastructure monitoring and diagnostics.
Growth Accelerators in the Cross Linked Polyethylene Industry Industry
The long-term growth of the Cross Linked Polyethylene (XLPE) industry will be significantly accelerated by ongoing technological breakthroughs, particularly in enhancing the sustainability and performance profiles of XLPE. Strategic partnerships between raw material suppliers, XLPE manufacturers, and end-users will foster collaborative innovation and market penetration. Expansion into new geographic markets with under-served infrastructure needs, coupled with aggressive market development strategies focused on highlighting XLPE's lifecycle cost advantages and superior performance, will also act as key growth accelerators.
Key Players Shaping the Cross Linked Polyethylene Industry Market
- Arkema
- Nouryon
- Exxon Mobil Corporation
- Avient Corporation
- Armacell
- Dow
- Hanwha Chemical
- Lyondellbasell Industries NV
- Borealis AG
- Solvay SA
Notable Milestones in Cross Linked Polyethylene Industry Sector
- January 2023: Borealis AG announced the successful recycling of crosslinked polyethylene such as PE-X and XLPE into recycled polyethylene using its Borcycle C chemical recycling process. This innovation allows for the maintenance of industry standards and high application quality, enabling customers to capitalize on circular economy solutions.
- June 2022: Borealis AG partnered with Uponor to enhance cross-linked polyethylene (PE-X) pipes. This collaboration led to the development of PE-X blue pipes, a portfolio crafted from PEX utilizing renewable feedstock, accredited by mass balance under the International Sustainability & Carbon Certification Plus (ISCC PLUS) scheme.
In-Depth Cross Linked Polyethylene Industry Market Outlook
The future of the Cross Linked Polyethylene (XLPE) industry appears exceptionally promising, driven by a confluence of factors that position it for sustained expansion. Growth accelerators will be rooted in continued advancements in sustainable XLPE production and recycling, aligning with global environmental mandates. Strategic collaborations, particularly those focusing on integrated solutions for the construction and electrical sectors, will unlock new market potential. Furthermore, a proactive approach to addressing infrastructure deficits in developing nations, coupled with targeted marketing of XLPE's long-term economic and performance benefits, will solidify its market leadership. The industry's ability to innovate and adapt to evolving material demands will be key to capitalizing on these future opportunities.
Cross Linked Polyethylene Industry Segmentation
-
1. Type
- 1.1. High-density Polyethylene (HDPE)
- 1.2. Low-density Polyethylene (LDPE)
- 1.3. Other Types
-
2. End-user Industry
- 2.1. Building and Construction
- 2.2. Electrical and Electronics
- 2.3. Automotive
- 2.4. Medical
- 2.5. Chemical Industry
- 2.6. Other End-user Industries
Cross Linked Polyethylene Industry Segmentation By Geography
-
1. Asia Pacific
- 1.1. China
- 1.2. India
- 1.3. Japan
- 1.4. South Korea
- 1.5. ASEAN Countries
- 1.6. Rest of Asia Pacific
-
2. North America
- 2.1. United States
- 2.2. Canada
- 2.3. Mexico
-
3. Europe
- 3.1. Germany
- 3.2. United Kingdom
- 3.3. Italy
- 3.4. France
- 3.5. Rest of Europe
-
4. South America
- 4.1. Brazil
- 4.2. Argentina
- 4.3. Rest of South America
- 5. Middle East
-
6. Saudi Arabia
- 6.1. South Africa
- 6.2. United Arab Emirates
- 6.3. Rest of Middle East
Cross Linked Polyethylene Industry Regional Market Share
Geographic Coverage of Cross Linked Polyethylene Industry
Cross Linked Polyethylene Industry REPORT HIGHLIGHTS
| Aspects | Details |
|---|---|
| Study Period | 2020-2034 |
| Base Year | 2025 |
| Estimated Year | 2026 |
| Forecast Period | 2026-2034 |
| Historical Period | 2020-2025 |
| Growth Rate | CAGR of 7.7% from 2020-2034 |
| Segmentation |
|
Table of Contents
- 1. Introduction
- 1.1. Research Scope
- 1.2. Market Segmentation
- 1.3. Research Objective
- 1.4. Definitions and Assumptions
- 2. Executive Summary
- 2.1. Market Snapshot
- 3. Market Dynamics
- 3.1. Market Drivers
- 3.2. Market Restrains
- 3.3. Market Trends
- 3.4. Market Opportunities
- 4. Market Factor Analysis
- 4.1. Porters Five Forces
- 4.1.1. Bargaining Power of Suppliers
- 4.1.2. Bargaining Power of Buyers
- 4.1.3. Threat of New Entrants
- 4.1.4. Threat of Substitutes
- 4.1.5. Competitive Rivalry
- 4.2. PESTEL analysis
- 4.3. BCG Analysis
- 4.3.1. Stars (High Growth, High Market Share)
- 4.3.2. Cash Cows (Low Growth, High Market Share)
- 4.3.3. Question Mark (High Growth, Low Market Share)
- 4.3.4. Dogs (Low Growth, Low Market Share)
- 4.4. Ansoff Matrix Analysis
- 4.5. Supply Chain Analysis
- 4.6. Regulatory Landscape
- 4.7. Current Market Potential and Opportunity Assessment (TAM–SAM–SOM Framework)
- 4.8. VDR Analyst Note
- 4.1. Porters Five Forces
- 5. Market Analysis, Insights and Forecast 2021-2033
- 5.1. Market Analysis, Insights and Forecast - by Type
- 5.1.1. High-density Polyethylene (HDPE)
- 5.1.2. Low-density Polyethylene (LDPE)
- 5.1.3. Other Types
- 5.2. Market Analysis, Insights and Forecast - by End-user Industry
- 5.2.1. Building and Construction
- 5.2.2. Electrical and Electronics
- 5.2.3. Automotive
- 5.2.4. Medical
- 5.2.5. Chemical Industry
- 5.2.6. Other End-user Industries
- 5.3. Market Analysis, Insights and Forecast - by Region
- 5.3.1. Asia Pacific
- 5.3.2. North America
- 5.3.3. Europe
- 5.3.4. South America
- 5.3.5. Middle East
- 5.3.6. Saudi Arabia
- 5.1. Market Analysis, Insights and Forecast - by Type
- 6. Global Cross Linked Polyethylene Industry Analysis, Insights and Forecast, 2021-2033
- 6.1. Market Analysis, Insights and Forecast - by Type
- 6.1.1. High-density Polyethylene (HDPE)
- 6.1.2. Low-density Polyethylene (LDPE)
- 6.1.3. Other Types
- 6.2. Market Analysis, Insights and Forecast - by End-user Industry
- 6.2.1. Building and Construction
- 6.2.2. Electrical and Electronics
- 6.2.3. Automotive
- 6.2.4. Medical
- 6.2.5. Chemical Industry
- 6.2.6. Other End-user Industries
- 6.1. Market Analysis, Insights and Forecast - by Type
- 7. Asia Pacific Cross Linked Polyethylene Industry Analysis, Insights and Forecast, 2021-2033
- 7.1. Market Analysis, Insights and Forecast - by Type
- 7.1.1. High-density Polyethylene (HDPE)
- 7.1.2. Low-density Polyethylene (LDPE)
- 7.1.3. Other Types
- 7.2. Market Analysis, Insights and Forecast - by End-user Industry
- 7.2.1. Building and Construction
- 7.2.2. Electrical and Electronics
- 7.2.3. Automotive
- 7.2.4. Medical
- 7.2.5. Chemical Industry
- 7.2.6. Other End-user Industries
- 7.1. Market Analysis, Insights and Forecast - by Type
- 8. North America Cross Linked Polyethylene Industry Analysis, Insights and Forecast, 2021-2033
- 8.1. Market Analysis, Insights and Forecast - by Type
- 8.1.1. High-density Polyethylene (HDPE)
- 8.1.2. Low-density Polyethylene (LDPE)
- 8.1.3. Other Types
- 8.2. Market Analysis, Insights and Forecast - by End-user Industry
- 8.2.1. Building and Construction
- 8.2.2. Electrical and Electronics
- 8.2.3. Automotive
- 8.2.4. Medical
- 8.2.5. Chemical Industry
- 8.2.6. Other End-user Industries
- 8.1. Market Analysis, Insights and Forecast - by Type
- 9. Europe Cross Linked Polyethylene Industry Analysis, Insights and Forecast, 2021-2033
- 9.1. Market Analysis, Insights and Forecast - by Type
- 9.1.1. High-density Polyethylene (HDPE)
- 9.1.2. Low-density Polyethylene (LDPE)
- 9.1.3. Other Types
- 9.2. Market Analysis, Insights and Forecast - by End-user Industry
- 9.2.1. Building and Construction
- 9.2.2. Electrical and Electronics
- 9.2.3. Automotive
- 9.2.4. Medical
- 9.2.5. Chemical Industry
- 9.2.6. Other End-user Industries
- 9.1. Market Analysis, Insights and Forecast - by Type
- 10. South America Cross Linked Polyethylene Industry Analysis, Insights and Forecast, 2021-2033
- 10.1. Market Analysis, Insights and Forecast - by Type
- 10.1.1. High-density Polyethylene (HDPE)
- 10.1.2. Low-density Polyethylene (LDPE)
- 10.1.3. Other Types
- 10.2. Market Analysis, Insights and Forecast - by End-user Industry
- 10.2.1. Building and Construction
- 10.2.2. Electrical and Electronics
- 10.2.3. Automotive
- 10.2.4. Medical
- 10.2.5. Chemical Industry
- 10.2.6. Other End-user Industries
- 10.1. Market Analysis, Insights and Forecast - by Type
- 11. Middle East Cross Linked Polyethylene Industry Analysis, Insights and Forecast, 2021-2033
- 11.1. Market Analysis, Insights and Forecast - by Type
- 11.1.1. High-density Polyethylene (HDPE)
- 11.1.2. Low-density Polyethylene (LDPE)
- 11.1.3. Other Types
- 11.2. Market Analysis, Insights and Forecast - by End-user Industry
- 11.2.1. Building and Construction
- 11.2.2. Electrical and Electronics
- 11.2.3. Automotive
- 11.2.4. Medical
- 11.2.5. Chemical Industry
- 11.2.6. Other End-user Industries
- 11.1. Market Analysis, Insights and Forecast - by Type
- 12. Saudi Arabia Cross Linked Polyethylene Industry Analysis, Insights and Forecast, 2021-2033
- 12.1. Market Analysis, Insights and Forecast - by Type
- 12.1.1. High-density Polyethylene (HDPE)
- 12.1.2. Low-density Polyethylene (LDPE)
- 12.1.3. Other Types
- 12.2. Market Analysis, Insights and Forecast - by End-user Industry
- 12.2.1. Building and Construction
- 12.2.2. Electrical and Electronics
- 12.2.3. Automotive
- 12.2.4. Medical
- 12.2.5. Chemical Industry
- 12.2.6. Other End-user Industries
- 12.1. Market Analysis, Insights and Forecast - by Type
- 13. Competitive Analysis
- 13.1. Company Profiles
- 13.1.1 Arkema
- 13.1.1.1. Company Overview
- 13.1.1.2. Products
- 13.1.1.3. Company Financials
- 13.1.1.4. SWOT Analysis
- 13.1.2 Nouryon
- 13.1.2.1. Company Overview
- 13.1.2.2. Products
- 13.1.2.3. Company Financials
- 13.1.2.4. SWOT Analysis
- 13.1.3 Exxon Mobil Corporation
- 13.1.3.1. Company Overview
- 13.1.3.2. Products
- 13.1.3.3. Company Financials
- 13.1.3.4. SWOT Analysis
- 13.1.4 Avient Corporation
- 13.1.4.1. Company Overview
- 13.1.4.2. Products
- 13.1.4.3. Company Financials
- 13.1.4.4. SWOT Analysis
- 13.1.5 Armacell
- 13.1.5.1. Company Overview
- 13.1.5.2. Products
- 13.1.5.3. Company Financials
- 13.1.5.4. SWOT Analysis
- 13.1.6 Dow
- 13.1.6.1. Company Overview
- 13.1.6.2. Products
- 13.1.6.3. Company Financials
- 13.1.6.4. SWOT Analysis
- 13.1.7 Hanwha Chemical
- 13.1.7.1. Company Overview
- 13.1.7.2. Products
- 13.1.7.3. Company Financials
- 13.1.7.4. SWOT Analysis
- 13.1.8 Lyondelbasell Industries NV
- 13.1.8.1. Company Overview
- 13.1.8.2. Products
- 13.1.8.3. Company Financials
- 13.1.8.4. SWOT Analysis
- 13.1.9 Borealis AG
- 13.1.9.1. Company Overview
- 13.1.9.2. Products
- 13.1.9.3. Company Financials
- 13.1.9.4. SWOT Analysis
- 13.1.10 Solvay SA
- 13.1.10.1. Company Overview
- 13.1.10.2. Products
- 13.1.10.3. Company Financials
- 13.1.10.4. SWOT Analysis
- 13.1.1 Arkema
- 13.2. Market Entropy
- 13.2.1 Company's Key Areas Served
- 13.2.2 Recent Developments
- 13.3. Company Market Share Analysis 2025
- 13.3.1 Top 5 Companies Market Share Analysis
- 13.3.2 Top 3 Companies Market Share Analysis
- 13.4. List of Potential Customers
- 14. Research Methodology
List of Figures
- Figure 1: Global Cross Linked Polyethylene Industry Revenue Breakdown (billion, %) by Region 2025 & 2033
- Figure 2: Global Cross Linked Polyethylene Industry Volume Breakdown (K Tons, %) by Region 2025 & 2033
- Figure 3: Asia Pacific Cross Linked Polyethylene Industry Revenue (billion), by Type 2025 & 2033
- Figure 4: Asia Pacific Cross Linked Polyethylene Industry Volume (K Tons), by Type 2025 & 2033
- Figure 5: Asia Pacific Cross Linked Polyethylene Industry Revenue Share (%), by Type 2025 & 2033
- Figure 6: Asia Pacific Cross Linked Polyethylene Industry Volume Share (%), by Type 2025 & 2033
- Figure 7: Asia Pacific Cross Linked Polyethylene Industry Revenue (billion), by End-user Industry 2025 & 2033
- Figure 8: Asia Pacific Cross Linked Polyethylene Industry Volume (K Tons), by End-user Industry 2025 & 2033
- Figure 9: Asia Pacific Cross Linked Polyethylene Industry Revenue Share (%), by End-user Industry 2025 & 2033
- Figure 10: Asia Pacific Cross Linked Polyethylene Industry Volume Share (%), by End-user Industry 2025 & 2033
- Figure 11: Asia Pacific Cross Linked Polyethylene Industry Revenue (billion), by Country 2025 & 2033
- Figure 12: Asia Pacific Cross Linked Polyethylene Industry Volume (K Tons), by Country 2025 & 2033
- Figure 13: Asia Pacific Cross Linked Polyethylene Industry Revenue Share (%), by Country 2025 & 2033
- Figure 14: Asia Pacific Cross Linked Polyethylene Industry Volume Share (%), by Country 2025 & 2033
- Figure 15: North America Cross Linked Polyethylene Industry Revenue (billion), by Type 2025 & 2033
- Figure 16: North America Cross Linked Polyethylene Industry Volume (K Tons), by Type 2025 & 2033
- Figure 17: North America Cross Linked Polyethylene Industry Revenue Share (%), by Type 2025 & 2033
- Figure 18: North America Cross Linked Polyethylene Industry Volume Share (%), by Type 2025 & 2033
- Figure 19: North America Cross Linked Polyethylene Industry Revenue (billion), by End-user Industry 2025 & 2033
- Figure 20: North America Cross Linked Polyethylene Industry Volume (K Tons), by End-user Industry 2025 & 2033
- Figure 21: North America Cross Linked Polyethylene Industry Revenue Share (%), by End-user Industry 2025 & 2033
- Figure 22: North America Cross Linked Polyethylene Industry Volume Share (%), by End-user Industry 2025 & 2033
- Figure 23: North America Cross Linked Polyethylene Industry Revenue (billion), by Country 2025 & 2033
- Figure 24: North America Cross Linked Polyethylene Industry Volume (K Tons), by Country 2025 & 2033
- Figure 25: North America Cross Linked Polyethylene Industry Revenue Share (%), by Country 2025 & 2033
- Figure 26: North America Cross Linked Polyethylene Industry Volume Share (%), by Country 2025 & 2033
- Figure 27: Europe Cross Linked Polyethylene Industry Revenue (billion), by Type 2025 & 2033
- Figure 28: Europe Cross Linked Polyethylene Industry Volume (K Tons), by Type 2025 & 2033
- Figure 29: Europe Cross Linked Polyethylene Industry Revenue Share (%), by Type 2025 & 2033
- Figure 30: Europe Cross Linked Polyethylene Industry Volume Share (%), by Type 2025 & 2033
- Figure 31: Europe Cross Linked Polyethylene Industry Revenue (billion), by End-user Industry 2025 & 2033
- Figure 32: Europe Cross Linked Polyethylene Industry Volume (K Tons), by End-user Industry 2025 & 2033
- Figure 33: Europe Cross Linked Polyethylene Industry Revenue Share (%), by End-user Industry 2025 & 2033
- Figure 34: Europe Cross Linked Polyethylene Industry Volume Share (%), by End-user Industry 2025 & 2033
- Figure 35: Europe Cross Linked Polyethylene Industry Revenue (billion), by Country 2025 & 2033
- Figure 36: Europe Cross Linked Polyethylene Industry Volume (K Tons), by Country 2025 & 2033
- Figure 37: Europe Cross Linked Polyethylene Industry Revenue Share (%), by Country 2025 & 2033
- Figure 38: Europe Cross Linked Polyethylene Industry Volume Share (%), by Country 2025 & 2033
- Figure 39: South America Cross Linked Polyethylene Industry Revenue (billion), by Type 2025 & 2033
- Figure 40: South America Cross Linked Polyethylene Industry Volume (K Tons), by Type 2025 & 2033
- Figure 41: South America Cross Linked Polyethylene Industry Revenue Share (%), by Type 2025 & 2033
- Figure 42: South America Cross Linked Polyethylene Industry Volume Share (%), by Type 2025 & 2033
- Figure 43: South America Cross Linked Polyethylene Industry Revenue (billion), by End-user Industry 2025 & 2033
- Figure 44: South America Cross Linked Polyethylene Industry Volume (K Tons), by End-user Industry 2025 & 2033
- Figure 45: South America Cross Linked Polyethylene Industry Revenue Share (%), by End-user Industry 2025 & 2033
- Figure 46: South America Cross Linked Polyethylene Industry Volume Share (%), by End-user Industry 2025 & 2033
- Figure 47: South America Cross Linked Polyethylene Industry Revenue (billion), by Country 2025 & 2033
- Figure 48: South America Cross Linked Polyethylene Industry Volume (K Tons), by Country 2025 & 2033
- Figure 49: South America Cross Linked Polyethylene Industry Revenue Share (%), by Country 2025 & 2033
- Figure 50: South America Cross Linked Polyethylene Industry Volume Share (%), by Country 2025 & 2033
- Figure 51: Middle East Cross Linked Polyethylene Industry Revenue (billion), by Type 2025 & 2033
- Figure 52: Middle East Cross Linked Polyethylene Industry Volume (K Tons), by Type 2025 & 2033
- Figure 53: Middle East Cross Linked Polyethylene Industry Revenue Share (%), by Type 2025 & 2033
- Figure 54: Middle East Cross Linked Polyethylene Industry Volume Share (%), by Type 2025 & 2033
- Figure 55: Middle East Cross Linked Polyethylene Industry Revenue (billion), by End-user Industry 2025 & 2033
- Figure 56: Middle East Cross Linked Polyethylene Industry Volume (K Tons), by End-user Industry 2025 & 2033
- Figure 57: Middle East Cross Linked Polyethylene Industry Revenue Share (%), by End-user Industry 2025 & 2033
- Figure 58: Middle East Cross Linked Polyethylene Industry Volume Share (%), by End-user Industry 2025 & 2033
- Figure 59: Middle East Cross Linked Polyethylene Industry Revenue (billion), by Country 2025 & 2033
- Figure 60: Middle East Cross Linked Polyethylene Industry Volume (K Tons), by Country 2025 & 2033
- Figure 61: Middle East Cross Linked Polyethylene Industry Revenue Share (%), by Country 2025 & 2033
- Figure 62: Middle East Cross Linked Polyethylene Industry Volume Share (%), by Country 2025 & 2033
- Figure 63: Saudi Arabia Cross Linked Polyethylene Industry Revenue (billion), by Type 2025 & 2033
- Figure 64: Saudi Arabia Cross Linked Polyethylene Industry Volume (K Tons), by Type 2025 & 2033
- Figure 65: Saudi Arabia Cross Linked Polyethylene Industry Revenue Share (%), by Type 2025 & 2033
- Figure 66: Saudi Arabia Cross Linked Polyethylene Industry Volume Share (%), by Type 2025 & 2033
- Figure 67: Saudi Arabia Cross Linked Polyethylene Industry Revenue (billion), by End-user Industry 2025 & 2033
- Figure 68: Saudi Arabia Cross Linked Polyethylene Industry Volume (K Tons), by End-user Industry 2025 & 2033
- Figure 69: Saudi Arabia Cross Linked Polyethylene Industry Revenue Share (%), by End-user Industry 2025 & 2033
- Figure 70: Saudi Arabia Cross Linked Polyethylene Industry Volume Share (%), by End-user Industry 2025 & 2033
- Figure 71: Saudi Arabia Cross Linked Polyethylene Industry Revenue (billion), by Country 2025 & 2033
- Figure 72: Saudi Arabia Cross Linked Polyethylene Industry Volume (K Tons), by Country 2025 & 2033
- Figure 73: Saudi Arabia Cross Linked Polyethylene Industry Revenue Share (%), by Country 2025 & 2033
- Figure 74: Saudi Arabia Cross Linked Polyethylene Industry Volume Share (%), by Country 2025 & 2033
List of Tables
- Table 1: Global Cross Linked Polyethylene Industry Revenue billion Forecast, by Type 2020 & 2033
- Table 2: Global Cross Linked Polyethylene Industry Volume K Tons Forecast, by Type 2020 & 2033
- Table 3: Global Cross Linked Polyethylene Industry Revenue billion Forecast, by End-user Industry 2020 & 2033
- Table 4: Global Cross Linked Polyethylene Industry Volume K Tons Forecast, by End-user Industry 2020 & 2033
- Table 5: Global Cross Linked Polyethylene Industry Revenue billion Forecast, by Region 2020 & 2033
- Table 6: Global Cross Linked Polyethylene Industry Volume K Tons Forecast, by Region 2020 & 2033
- Table 7: Global Cross Linked Polyethylene Industry Revenue billion Forecast, by Type 2020 & 2033
- Table 8: Global Cross Linked Polyethylene Industry Volume K Tons Forecast, by Type 2020 & 2033
- Table 9: Global Cross Linked Polyethylene Industry Revenue billion Forecast, by End-user Industry 2020 & 2033
- Table 10: Global Cross Linked Polyethylene Industry Volume K Tons Forecast, by End-user Industry 2020 & 2033
- Table 11: Global Cross Linked Polyethylene Industry Revenue billion Forecast, by Country 2020 & 2033
- Table 12: Global Cross Linked Polyethylene Industry Volume K Tons Forecast, by Country 2020 & 2033
- Table 13: China Cross Linked Polyethylene Industry Revenue (billion) Forecast, by Application 2020 & 2033
- Table 14: China Cross Linked Polyethylene Industry Volume (K Tons) Forecast, by Application 2020 & 2033
- Table 15: India Cross Linked Polyethylene Industry Revenue (billion) Forecast, by Application 2020 & 2033
- Table 16: India Cross Linked Polyethylene Industry Volume (K Tons) Forecast, by Application 2020 & 2033
- Table 17: Japan Cross Linked Polyethylene Industry Revenue (billion) Forecast, by Application 2020 & 2033
- Table 18: Japan Cross Linked Polyethylene Industry Volume (K Tons) Forecast, by Application 2020 & 2033
- Table 19: South Korea Cross Linked Polyethylene Industry Revenue (billion) Forecast, by Application 2020 & 2033
- Table 20: South Korea Cross Linked Polyethylene Industry Volume (K Tons) Forecast, by Application 2020 & 2033
- Table 21: ASEAN Countries Cross Linked Polyethylene Industry Revenue (billion) Forecast, by Application 2020 & 2033
- Table 22: ASEAN Countries Cross Linked Polyethylene Industry Volume (K Tons) Forecast, by Application 2020 & 2033
- Table 23: Rest of Asia Pacific Cross Linked Polyethylene Industry Revenue (billion) Forecast, by Application 2020 & 2033
- Table 24: Rest of Asia Pacific Cross Linked Polyethylene Industry Volume (K Tons) Forecast, by Application 2020 & 2033
- Table 25: Global Cross Linked Polyethylene Industry Revenue billion Forecast, by Type 2020 & 2033
- Table 26: Global Cross Linked Polyethylene Industry Volume K Tons Forecast, by Type 2020 & 2033
- Table 27: Global Cross Linked Polyethylene Industry Revenue billion Forecast, by End-user Industry 2020 & 2033
- Table 28: Global Cross Linked Polyethylene Industry Volume K Tons Forecast, by End-user Industry 2020 & 2033
- Table 29: Global Cross Linked Polyethylene Industry Revenue billion Forecast, by Country 2020 & 2033
- Table 30: Global Cross Linked Polyethylene Industry Volume K Tons Forecast, by Country 2020 & 2033
- Table 31: United States Cross Linked Polyethylene Industry Revenue (billion) Forecast, by Application 2020 & 2033
- Table 32: United States Cross Linked Polyethylene Industry Volume (K Tons) Forecast, by Application 2020 & 2033
- Table 33: Canada Cross Linked Polyethylene Industry Revenue (billion) Forecast, by Application 2020 & 2033
- Table 34: Canada Cross Linked Polyethylene Industry Volume (K Tons) Forecast, by Application 2020 & 2033
- Table 35: Mexico Cross Linked Polyethylene Industry Revenue (billion) Forecast, by Application 2020 & 2033
- Table 36: Mexico Cross Linked Polyethylene Industry Volume (K Tons) Forecast, by Application 2020 & 2033
- Table 37: Global Cross Linked Polyethylene Industry Revenue billion Forecast, by Type 2020 & 2033
- Table 38: Global Cross Linked Polyethylene Industry Volume K Tons Forecast, by Type 2020 & 2033
- Table 39: Global Cross Linked Polyethylene Industry Revenue billion Forecast, by End-user Industry 2020 & 2033
- Table 40: Global Cross Linked Polyethylene Industry Volume K Tons Forecast, by End-user Industry 2020 & 2033
- Table 41: Global Cross Linked Polyethylene Industry Revenue billion Forecast, by Country 2020 & 2033
- Table 42: Global Cross Linked Polyethylene Industry Volume K Tons Forecast, by Country 2020 & 2033
- Table 43: Germany Cross Linked Polyethylene Industry Revenue (billion) Forecast, by Application 2020 & 2033
- Table 44: Germany Cross Linked Polyethylene Industry Volume (K Tons) Forecast, by Application 2020 & 2033
- Table 45: United Kingdom Cross Linked Polyethylene Industry Revenue (billion) Forecast, by Application 2020 & 2033
- Table 46: United Kingdom Cross Linked Polyethylene Industry Volume (K Tons) Forecast, by Application 2020 & 2033
- Table 47: Italy Cross Linked Polyethylene Industry Revenue (billion) Forecast, by Application 2020 & 2033
- Table 48: Italy Cross Linked Polyethylene Industry Volume (K Tons) Forecast, by Application 2020 & 2033
- Table 49: France Cross Linked Polyethylene Industry Revenue (billion) Forecast, by Application 2020 & 2033
- Table 50: France Cross Linked Polyethylene Industry Volume (K Tons) Forecast, by Application 2020 & 2033
- Table 51: Rest of Europe Cross Linked Polyethylene Industry Revenue (billion) Forecast, by Application 2020 & 2033
- Table 52: Rest of Europe Cross Linked Polyethylene Industry Volume (K Tons) Forecast, by Application 2020 & 2033
- Table 53: Global Cross Linked Polyethylene Industry Revenue billion Forecast, by Type 2020 & 2033
- Table 54: Global Cross Linked Polyethylene Industry Volume K Tons Forecast, by Type 2020 & 2033
- Table 55: Global Cross Linked Polyethylene Industry Revenue billion Forecast, by End-user Industry 2020 & 2033
- Table 56: Global Cross Linked Polyethylene Industry Volume K Tons Forecast, by End-user Industry 2020 & 2033
- Table 57: Global Cross Linked Polyethylene Industry Revenue billion Forecast, by Country 2020 & 2033
- Table 58: Global Cross Linked Polyethylene Industry Volume K Tons Forecast, by Country 2020 & 2033
- Table 59: Brazil Cross Linked Polyethylene Industry Revenue (billion) Forecast, by Application 2020 & 2033
- Table 60: Brazil Cross Linked Polyethylene Industry Volume (K Tons) Forecast, by Application 2020 & 2033
- Table 61: Argentina Cross Linked Polyethylene Industry Revenue (billion) Forecast, by Application 2020 & 2033
- Table 62: Argentina Cross Linked Polyethylene Industry Volume (K Tons) Forecast, by Application 2020 & 2033
- Table 63: Rest of South America Cross Linked Polyethylene Industry Revenue (billion) Forecast, by Application 2020 & 2033
- Table 64: Rest of South America Cross Linked Polyethylene Industry Volume (K Tons) Forecast, by Application 2020 & 2033
- Table 65: Global Cross Linked Polyethylene Industry Revenue billion Forecast, by Type 2020 & 2033
- Table 66: Global Cross Linked Polyethylene Industry Volume K Tons Forecast, by Type 2020 & 2033
- Table 67: Global Cross Linked Polyethylene Industry Revenue billion Forecast, by End-user Industry 2020 & 2033
- Table 68: Global Cross Linked Polyethylene Industry Volume K Tons Forecast, by End-user Industry 2020 & 2033
- Table 69: Global Cross Linked Polyethylene Industry Revenue billion Forecast, by Country 2020 & 2033
- Table 70: Global Cross Linked Polyethylene Industry Volume K Tons Forecast, by Country 2020 & 2033
- Table 71: Global Cross Linked Polyethylene Industry Revenue billion Forecast, by Type 2020 & 2033
- Table 72: Global Cross Linked Polyethylene Industry Volume K Tons Forecast, by Type 2020 & 2033
- Table 73: Global Cross Linked Polyethylene Industry Revenue billion Forecast, by End-user Industry 2020 & 2033
- Table 74: Global Cross Linked Polyethylene Industry Volume K Tons Forecast, by End-user Industry 2020 & 2033
- Table 75: Global Cross Linked Polyethylene Industry Revenue billion Forecast, by Country 2020 & 2033
- Table 76: Global Cross Linked Polyethylene Industry Volume K Tons Forecast, by Country 2020 & 2033
- Table 77: South Africa Cross Linked Polyethylene Industry Revenue (billion) Forecast, by Application 2020 & 2033
- Table 78: South Africa Cross Linked Polyethylene Industry Volume (K Tons) Forecast, by Application 2020 & 2033
- Table 79: United Arab Emirates Cross Linked Polyethylene Industry Revenue (billion) Forecast, by Application 2020 & 2033
- Table 80: United Arab Emirates Cross Linked Polyethylene Industry Volume (K Tons) Forecast, by Application 2020 & 2033
- Table 81: Rest of Middle East Cross Linked Polyethylene Industry Revenue (billion) Forecast, by Application 2020 & 2033
- Table 82: Rest of Middle East Cross Linked Polyethylene Industry Volume (K Tons) Forecast, by Application 2020 & 2033
Frequently Asked Questions
1. What is the projected Compound Annual Growth Rate (CAGR) of the Cross Linked Polyethylene Industry?
The projected CAGR is approximately 7.7%.
2. Which companies are prominent players in the Cross Linked Polyethylene Industry?
Key companies in the market include Arkema, Nouryon, Exxon Mobil Corporation, Avient Corporation, Armacell, Dow, Hanwha Chemical, Lyondelbasell Industries NV, Borealis AG, Solvay SA.
3. What are the main segments of the Cross Linked Polyethylene Industry?
The market segments include Type, End-user Industry.
4. Can you provide details about the market size?
The market size is estimated to be USD 7.27 billion as of 2022.
5. What are some drivers contributing to market growth?
Low-cost. Flexibility. and Easy Installation Of XLPE; Surge in Demand from Pipe and Tubing Applications; Other Drivers.
6. What are the notable trends driving market growth?
Building and construction to Dominate the Market.
7. Are there any restraints impacting market growth?
Fluctuation in Raw Material Prices; Low Heat Transfer Resistance and Adhesion.
8. Can you provide examples of recent developments in the market?
January 2023: Borealis AG announced the recycling of crosslinked polyethylene such as PE-X and XLPE into recycled polyethylene using its Borcycle C chemical recycling process. It enables maintaining industry standards and high application quality, and help customer to capitalize on circular solutions.
9. What pricing options are available for accessing the report?
Pricing options include single-user, multi-user, and enterprise licenses priced at USD 4750, USD 5250, and USD 8750 respectively.
10. Is the market size provided in terms of value or volume?
The market size is provided in terms of value, measured in billion and volume, measured in K Tons.
11. Are there any specific market keywords associated with the report?
Yes, the market keyword associated with the report is "Cross Linked Polyethylene Industry," which aids in identifying and referencing the specific market segment covered.
12. How do I determine which pricing option suits my needs best?
The pricing options vary based on user requirements and access needs. Individual users may opt for single-user licenses, while businesses requiring broader access may choose multi-user or enterprise licenses for cost-effective access to the report.
13. Are there any additional resources or data provided in the Cross Linked Polyethylene Industry report?
While the report offers comprehensive insights, it's advisable to review the specific contents or supplementary materials provided to ascertain if additional resources or data are available.
14. How can I stay updated on further developments or reports in the Cross Linked Polyethylene Industry?
To stay informed about further developments, trends, and reports in the Cross Linked Polyethylene Industry, consider subscribing to industry newsletters, following relevant companies and organizations, or regularly checking reputable industry news sources and publications.
Methodology
Step 1 - Identification of Relevant Samples Size from Population Database


Step 2 - Approaches for Defining Global Market Size (Value, Volume* & Price*)

Note*: In applicable scenarios
Step 3 - Data Sources
Primary Research
- Web Analytics
- Survey Reports
- Research Institute
- Latest Research Reports
- Opinion Leaders
Secondary Research
- Annual Reports
- White Paper
- Latest Press Release
- Industry Association
- Paid Database
- Investor Presentations

Step 4 - Data Triangulation
Involves using different sources of information in order to increase the validity of a study
These sources are likely to be stakeholders in a program - participants, other researchers, program staff, other community members, and so on.
Then we put all data in single framework & apply various statistical tools to find out the dynamic on the market.
During the analysis stage, feedback from the stakeholder groups would be compared to determine areas of agreement as well as areas of divergence