

Key Insights
The Core Materials for Composites market is poised for substantial expansion, projecting a Compound Annual Growth Rate (CAGR) of 9.29% between 2025 and 2033. This growth trajectory is underpinned by escalating demand for lightweight, high-strength materials across key industries including aerospace, automotive, and wind energy. Innovations in composite technology are enhancing performance and cost-efficiency, further stimulating market development. Moreover, stringent environmental regulations advocating for fuel efficiency and reduced emissions are propelling the adoption of sustainable composite alternatives to conventional materials. The market is segmented by material type, application, and geography. Intense competition among leading entities such as 3A Composites, Armacell International SA, and Hexcel Corporation is fostering continuous innovation and competitive pricing.
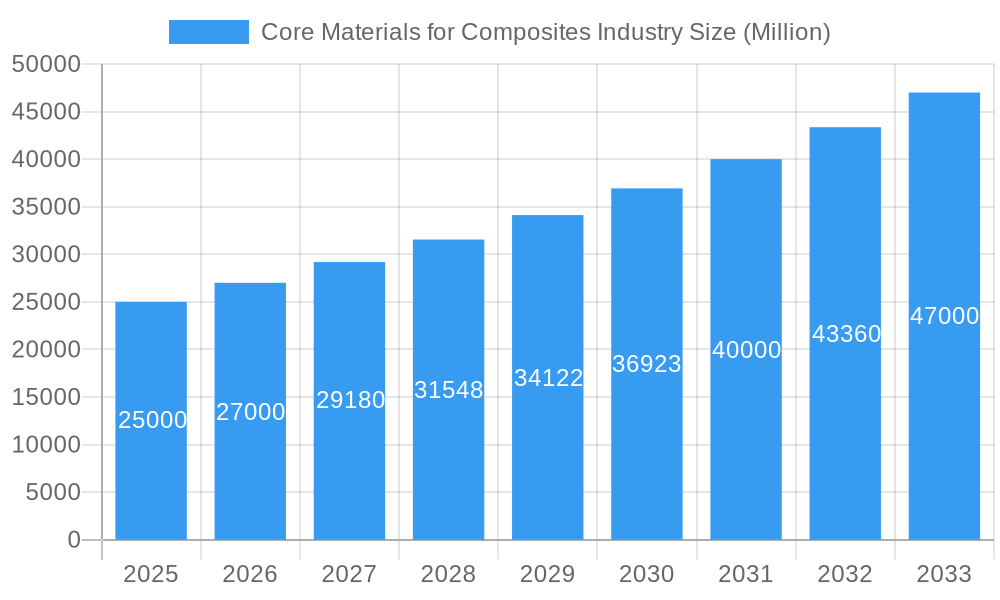
Core Materials for Composites Industry Market Size (In Billion)
Despite significant opportunities, the market faces challenges including raw material price volatility and substantial R&D investment requirements for technological advancement. The intricate manufacturing processes for composite materials can also present entry barriers. Nevertheless, the long-term outlook remains robust, driven by widespread industry adoption and a persistent focus on manufacturing sustainability. The market's growth is expected to spur increased production capacities and novel material solutions, reinforcing its critical role in advanced manufacturing. The global market size is estimated at 7.16 billion in 2025.
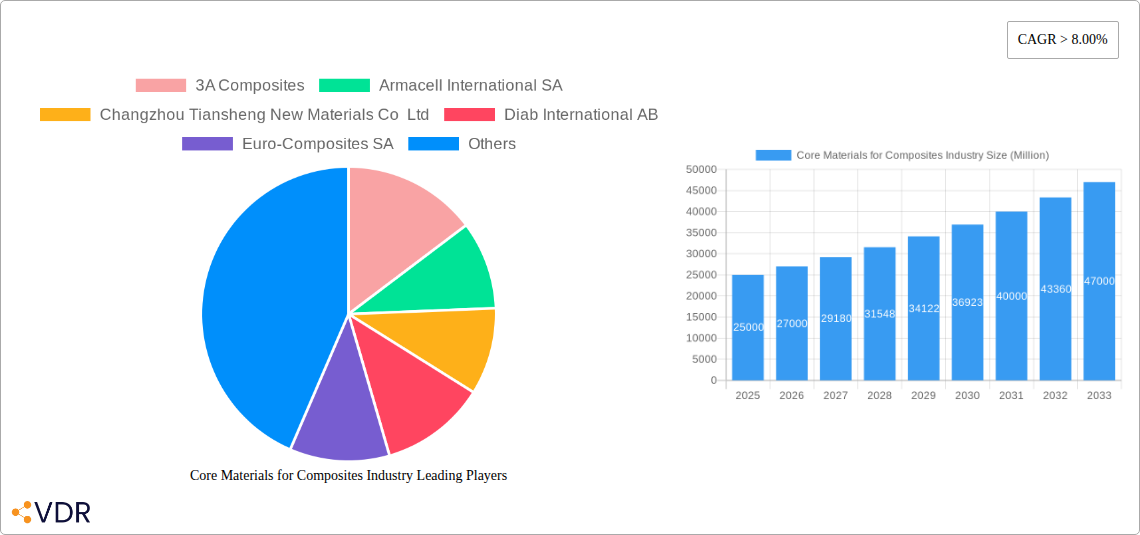
Core Materials for Composites Industry Company Market Share
Core Materials for Composites Industry: A Comprehensive Market Report (2019-2033)
This in-depth report provides a comprehensive analysis of the Core Materials for Composites Industry, encompassing market dynamics, growth trends, regional dominance, product landscape, challenges, opportunities, and key players. The report covers the period from 2019 to 2033, with a focus on the 2025-2033 forecast period. The study utilizes a combination of qualitative and quantitative data to deliver actionable insights for industry professionals, investors, and strategic decision-makers. This report serves as an indispensable resource for understanding the current state and future trajectory of this rapidly evolving market, encompassing both the parent market (Advanced Materials) and the child market (Composites Manufacturing).
Parent Market: Advanced Materials Child Market: Composites Manufacturing
Core Materials for Composites Industry Market Dynamics & Structure
This section analyzes the competitive landscape, technological advancements, regulatory influences, and market trends within the core materials for the composites industry. We delve into market concentration, analyzing the market share held by key players like 3A Composites, Armacell International SA, and Hexcel Corporation. The report also examines the impact of mergers and acquisitions (M&A) activity on market consolidation. Quantitative data, such as market share percentages and M&A deal volumes (XX Million units in 2024), is presented alongside qualitative factors, such as innovation barriers and regulatory hurdles.
- Market Concentration: Highly fragmented with top 5 players holding approximately xx% market share in 2024.
- Technological Innovation: Focus on lightweighting, high-performance materials, and sustainable solutions.
- Regulatory Framework: Increasing emphasis on environmental regulations driving demand for eco-friendly composites.
- Competitive Substitutes: Metals, plastics, and other alternative materials pose competitive pressure.
- End-User Demographics: Automotive, aerospace, wind energy, and construction are major end-use segments.
- M&A Trends: Consolidation expected to continue, driven by economies of scale and technological advancements; xx M&A deals recorded in 2024.
Core Materials for Composites Industry Growth Trends & Insights
This section offers a detailed analysis of the Core Materials for Composites Industry's growth trajectory, leveraging proprietary data and market intelligence to provide insights into market size evolution, adoption rates, technological disruptions, and shifts in consumer behavior. The report presents a comprehensive analysis of historical data (2019-2024) and forecasts (2025-2033), including the estimated market size in 2025 (XX Million units) and projected Compound Annual Growth Rate (CAGR) during the forecast period (xx%).
The analysis explores the impact of technological advancements such as the adoption of advanced fiber reinforcements and matrix resins on market growth. It also examines changes in consumer preferences, focusing on the increasing demand for sustainable and lightweight materials. Specific metrics such as CAGR and market penetration rates for various segments are provided to offer deeper insights.
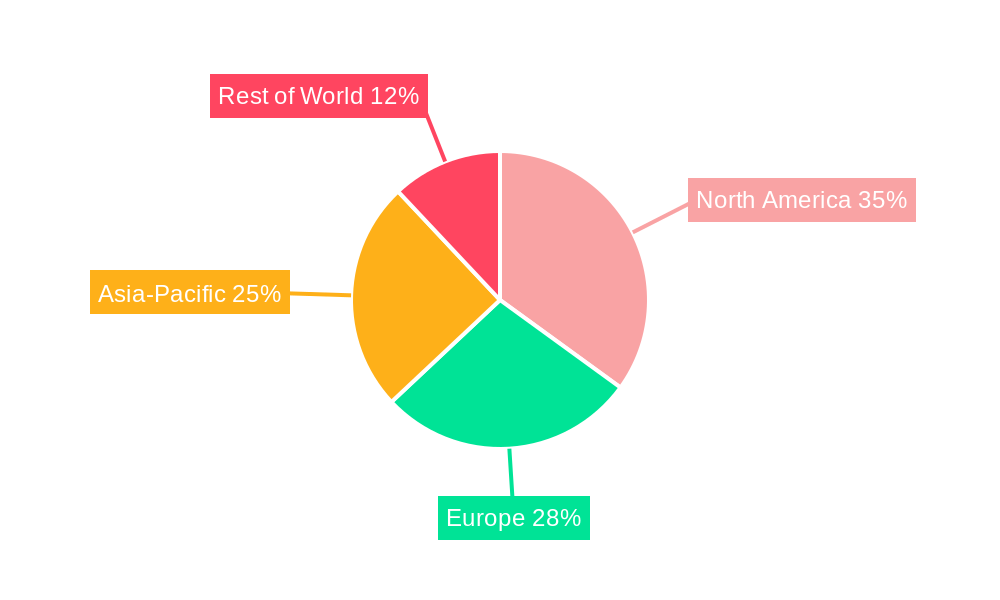
Dominant Regions, Countries, or Segments in Core Materials for Composites Industry
This section identifies the leading geographical regions and segments driving market growth within the Core Materials for Composites Industry. The analysis includes quantitative data on market share and growth potential for each region, along with qualitative factors influencing regional dominance.
- Dominant Region: North America currently holds the largest market share (xx%), driven by robust automotive and aerospace industries.
- Key Drivers:
- Favorable government policies promoting the adoption of lightweight materials.
- Significant investments in infrastructure development.
- Growing demand from key end-use industries.
- Growth Potential: Asia-Pacific is expected to exhibit the highest growth rate (xx%) over the forecast period due to increasing industrialization and infrastructure investments.
Core Materials for Composites Industry Product Landscape
This section explores the diverse product landscape of the Core Materials for Composites Industry, examining product innovations, applications, and performance metrics. The analysis highlights unique selling propositions (USPs) and technological advancements driving product differentiation. Key product categories covered include fiber-reinforced polymers (FRP), carbon fiber, glass fiber, and aramid fiber. The report illustrates how these materials' unique properties, like high strength-to-weight ratios and durability, drive their adoption across various applications.
Key Drivers, Barriers & Challenges in Core Materials for Composites Industry
This section identifies the key factors driving market growth, as well as the challenges and restraints hindering its expansion.
Key Drivers:
- Increasing demand for lightweight materials in automotive and aerospace industries.
- Growing adoption of composites in renewable energy applications (wind energy).
- Technological advancements leading to improved material properties and cost reduction.
Challenges and Restraints:
- High initial cost of composite materials compared to traditional materials.
- Concerns regarding the recyclability and environmental impact of some composites.
- Supply chain disruptions impacting the availability and cost of raw materials. (Estimated impact of xx% on 2024 production).
Emerging Opportunities in Core Materials for Composites Industry
This section highlights emerging trends and opportunities within the Core Materials for Composites Industry. These opportunities include:
- Growth in the use of bio-based and recycled composite materials.
- Expansion into new applications such as 3D-printed composites.
- Development of innovative manufacturing processes.
Growth Accelerators in the Core Materials for Composites Industry Industry
Long-term growth in the Core Materials for Composites Industry will be fueled by continuous technological innovation, leading to the development of higher-performing, cost-effective, and sustainable materials. Strategic partnerships and collaborations between material suppliers and end-users will also accelerate growth. Furthermore, expansions into untapped markets, like the construction sector, present significant opportunities.
Key Players Shaping the Core Materials for Composites Industry Market
- 3A Composites
- Armacell International SA
- Changzhou Tiansheng New Materials Co Ltd
- Diab International AB
- Euro-Composites SA
- Evonik Industries AG
- Gurit Holding AG
- Hexcel Corporation
- Plascore Incorporated
- Saertex GmbH & Co KG
- The Gill Corporation
Notable Milestones in Core Materials for Composites Industry Sector
- 2022 Q4: Hexcel Corporation announces a new high-strength carbon fiber.
- 2023 Q1: Evonik Industries AG invests in a new bio-based resin production facility.
- 2024 Q2: Major merger between two leading fiber manufacturers.
In-Depth Core Materials for Composites Industry Market Outlook
The Core Materials for Composites Industry is poised for significant growth over the forecast period (2025-2033). Continued innovation in material science, coupled with expanding applications in key sectors, will drive market expansion. Strategic partnerships and investments in sustainable manufacturing processes will further enhance the industry's long-term prospects. The market is expected to reach xx Million units by 2033, representing substantial opportunities for both established players and new entrants.
Core Materials for Composites Industry Segmentation
-
1. Type
-
1.1. Foam Core
- 1.1.1. PVC Foam
- 1.1.2. Polystyrene Foam
- 1.1.3. Polyurethane Foam
- 1.1.4. PMMA Foam
- 1.1.5. SAN Co-polymer Foam
- 1.1.6. Other Thermoplastics
-
1.2. Honeycomb
- 1.2.1. Aluminum Honeycomb
- 1.2.2. Nomex Honeycomb
- 1.2.3. Thermoplastic Honeycomb
-
1.3. Wood
- 1.3.1. Balsa
- 1.3.2. Other Woods
-
1.1. Foam Core
-
2. End-user Industry
- 2.1. Aerospace and Defense
- 2.2. Marine
- 2.3. Construction
- 2.4. Wind Energy
- 2.5. Automotive
- 2.6. Consumer Goods
- 2.7. Other End-user Industries
Core Materials for Composites Industry Segmentation By Geography
-
1. Asia Pacific
- 1.1. China
- 1.2. India
- 1.3. Japan
- 1.4. South Korea
- 1.5. ASEAN Countries
- 1.6. Rest of Asia Pacific
-
2. North America
- 2.1. United States
- 2.2. Canada
- 2.3. Mexico
-
3. Europe
- 3.1. Germany
- 3.2. United Kingdom
- 3.3. Italy
- 3.4. France
- 3.5. Spain
- 3.6. Rest of Europe
-
4. South America
- 4.1. Brazil
- 4.2. Argentina
- 4.3. Rest of South America
- 5. Middle East
-
6. Saudi Arabia
- 6.1. South Africa
- 6.2. Rest of Middle East
Core Materials for Composites Industry Regional Market Share
Geographic Coverage of Core Materials for Composites Industry
Core Materials for Composites Industry REPORT HIGHLIGHTS
| Aspects | Details |
|---|---|
| Study Period | 2020-2034 |
| Base Year | 2025 |
| Estimated Year | 2026 |
| Forecast Period | 2026-2034 |
| Historical Period | 2020-2025 |
| Growth Rate | CAGR of 9.29% from 2020-2034 |
| Segmentation |
|
Table of Contents
- 1. Introduction
- 1.1. Research Scope
- 1.2. Market Segmentation
- 1.3. Research Objective
- 1.4. Definitions and Assumptions
- 2. Executive Summary
- 2.1. Market Snapshot
- 3. Market Dynamics
- 3.1. Market Drivers
- 3.2. Market Restrains
- 3.3. Market Trends
- 3.4. Market Opportunities
- 4. Market Factor Analysis
- 4.1. Porters Five Forces
- 4.1.1. Bargaining Power of Suppliers
- 4.1.2. Bargaining Power of Buyers
- 4.1.3. Threat of New Entrants
- 4.1.4. Threat of Substitutes
- 4.1.5. Competitive Rivalry
- 4.2. PESTEL analysis
- 4.3. BCG Analysis
- 4.3.1. Stars (High Growth, High Market Share)
- 4.3.2. Cash Cows (Low Growth, High Market Share)
- 4.3.3. Question Mark (High Growth, Low Market Share)
- 4.3.4. Dogs (Low Growth, Low Market Share)
- 4.4. Ansoff Matrix Analysis
- 4.5. Supply Chain Analysis
- 4.6. Regulatory Landscape
- 4.7. Current Market Potential and Opportunity Assessment (TAM–SAM–SOM Framework)
- 4.8. VDR Analyst Note
- 4.1. Porters Five Forces
- 5. Market Analysis, Insights and Forecast 2021-2033
- 5.1. Market Analysis, Insights and Forecast - by Type
- 5.1.1. Foam Core
- 5.1.1.1. PVC Foam
- 5.1.1.2. Polystyrene Foam
- 5.1.1.3. Polyurethane Foam
- 5.1.1.4. PMMA Foam
- 5.1.1.5. SAN Co-polymer Foam
- 5.1.1.6. Other Thermoplastics
- 5.1.2. Honeycomb
- 5.1.2.1. Aluminum Honeycomb
- 5.1.2.2. Nomex Honeycomb
- 5.1.2.3. Thermoplastic Honeycomb
- 5.1.3. Wood
- 5.1.3.1. Balsa
- 5.1.3.2. Other Woods
- 5.1.1. Foam Core
- 5.2. Market Analysis, Insights and Forecast - by End-user Industry
- 5.2.1. Aerospace and Defense
- 5.2.2. Marine
- 5.2.3. Construction
- 5.2.4. Wind Energy
- 5.2.5. Automotive
- 5.2.6. Consumer Goods
- 5.2.7. Other End-user Industries
- 5.3. Market Analysis, Insights and Forecast - by Region
- 5.3.1. Asia Pacific
- 5.3.2. North America
- 5.3.3. Europe
- 5.3.4. South America
- 5.3.5. Middle East
- 5.3.6. Saudi Arabia
- 5.1. Market Analysis, Insights and Forecast - by Type
- 6. Global Core Materials for Composites Industry Analysis, Insights and Forecast, 2021-2033
- 6.1. Market Analysis, Insights and Forecast - by Type
- 6.1.1. Foam Core
- 6.1.1.1. PVC Foam
- 6.1.1.2. Polystyrene Foam
- 6.1.1.3. Polyurethane Foam
- 6.1.1.4. PMMA Foam
- 6.1.1.5. SAN Co-polymer Foam
- 6.1.1.6. Other Thermoplastics
- 6.1.2. Honeycomb
- 6.1.2.1. Aluminum Honeycomb
- 6.1.2.2. Nomex Honeycomb
- 6.1.2.3. Thermoplastic Honeycomb
- 6.1.3. Wood
- 6.1.3.1. Balsa
- 6.1.3.2. Other Woods
- 6.1.1. Foam Core
- 6.2. Market Analysis, Insights and Forecast - by End-user Industry
- 6.2.1. Aerospace and Defense
- 6.2.2. Marine
- 6.2.3. Construction
- 6.2.4. Wind Energy
- 6.2.5. Automotive
- 6.2.6. Consumer Goods
- 6.2.7. Other End-user Industries
- 6.1. Market Analysis, Insights and Forecast - by Type
- 7. Asia Pacific Core Materials for Composites Industry Analysis, Insights and Forecast, 2021-2033
- 7.1. Market Analysis, Insights and Forecast - by Type
- 7.1.1. Foam Core
- 7.1.1.1. PVC Foam
- 7.1.1.2. Polystyrene Foam
- 7.1.1.3. Polyurethane Foam
- 7.1.1.4. PMMA Foam
- 7.1.1.5. SAN Co-polymer Foam
- 7.1.1.6. Other Thermoplastics
- 7.1.2. Honeycomb
- 7.1.2.1. Aluminum Honeycomb
- 7.1.2.2. Nomex Honeycomb
- 7.1.2.3. Thermoplastic Honeycomb
- 7.1.3. Wood
- 7.1.3.1. Balsa
- 7.1.3.2. Other Woods
- 7.1.1. Foam Core
- 7.2. Market Analysis, Insights and Forecast - by End-user Industry
- 7.2.1. Aerospace and Defense
- 7.2.2. Marine
- 7.2.3. Construction
- 7.2.4. Wind Energy
- 7.2.5. Automotive
- 7.2.6. Consumer Goods
- 7.2.7. Other End-user Industries
- 7.1. Market Analysis, Insights and Forecast - by Type
- 8. North America Core Materials for Composites Industry Analysis, Insights and Forecast, 2021-2033
- 8.1. Market Analysis, Insights and Forecast - by Type
- 8.1.1. Foam Core
- 8.1.1.1. PVC Foam
- 8.1.1.2. Polystyrene Foam
- 8.1.1.3. Polyurethane Foam
- 8.1.1.4. PMMA Foam
- 8.1.1.5. SAN Co-polymer Foam
- 8.1.1.6. Other Thermoplastics
- 8.1.2. Honeycomb
- 8.1.2.1. Aluminum Honeycomb
- 8.1.2.2. Nomex Honeycomb
- 8.1.2.3. Thermoplastic Honeycomb
- 8.1.3. Wood
- 8.1.3.1. Balsa
- 8.1.3.2. Other Woods
- 8.1.1. Foam Core
- 8.2. Market Analysis, Insights and Forecast - by End-user Industry
- 8.2.1. Aerospace and Defense
- 8.2.2. Marine
- 8.2.3. Construction
- 8.2.4. Wind Energy
- 8.2.5. Automotive
- 8.2.6. Consumer Goods
- 8.2.7. Other End-user Industries
- 8.1. Market Analysis, Insights and Forecast - by Type
- 9. Europe Core Materials for Composites Industry Analysis, Insights and Forecast, 2021-2033
- 9.1. Market Analysis, Insights and Forecast - by Type
- 9.1.1. Foam Core
- 9.1.1.1. PVC Foam
- 9.1.1.2. Polystyrene Foam
- 9.1.1.3. Polyurethane Foam
- 9.1.1.4. PMMA Foam
- 9.1.1.5. SAN Co-polymer Foam
- 9.1.1.6. Other Thermoplastics
- 9.1.2. Honeycomb
- 9.1.2.1. Aluminum Honeycomb
- 9.1.2.2. Nomex Honeycomb
- 9.1.2.3. Thermoplastic Honeycomb
- 9.1.3. Wood
- 9.1.3.1. Balsa
- 9.1.3.2. Other Woods
- 9.1.1. Foam Core
- 9.2. Market Analysis, Insights and Forecast - by End-user Industry
- 9.2.1. Aerospace and Defense
- 9.2.2. Marine
- 9.2.3. Construction
- 9.2.4. Wind Energy
- 9.2.5. Automotive
- 9.2.6. Consumer Goods
- 9.2.7. Other End-user Industries
- 9.1. Market Analysis, Insights and Forecast - by Type
- 10. South America Core Materials for Composites Industry Analysis, Insights and Forecast, 2021-2033
- 10.1. Market Analysis, Insights and Forecast - by Type
- 10.1.1. Foam Core
- 10.1.1.1. PVC Foam
- 10.1.1.2. Polystyrene Foam
- 10.1.1.3. Polyurethane Foam
- 10.1.1.4. PMMA Foam
- 10.1.1.5. SAN Co-polymer Foam
- 10.1.1.6. Other Thermoplastics
- 10.1.2. Honeycomb
- 10.1.2.1. Aluminum Honeycomb
- 10.1.2.2. Nomex Honeycomb
- 10.1.2.3. Thermoplastic Honeycomb
- 10.1.3. Wood
- 10.1.3.1. Balsa
- 10.1.3.2. Other Woods
- 10.1.1. Foam Core
- 10.2. Market Analysis, Insights and Forecast - by End-user Industry
- 10.2.1. Aerospace and Defense
- 10.2.2. Marine
- 10.2.3. Construction
- 10.2.4. Wind Energy
- 10.2.5. Automotive
- 10.2.6. Consumer Goods
- 10.2.7. Other End-user Industries
- 10.1. Market Analysis, Insights and Forecast - by Type
- 11. Middle East Core Materials for Composites Industry Analysis, Insights and Forecast, 2021-2033
- 11.1. Market Analysis, Insights and Forecast - by Type
- 11.1.1. Foam Core
- 11.1.1.1. PVC Foam
- 11.1.1.2. Polystyrene Foam
- 11.1.1.3. Polyurethane Foam
- 11.1.1.4. PMMA Foam
- 11.1.1.5. SAN Co-polymer Foam
- 11.1.1.6. Other Thermoplastics
- 11.1.2. Honeycomb
- 11.1.2.1. Aluminum Honeycomb
- 11.1.2.2. Nomex Honeycomb
- 11.1.2.3. Thermoplastic Honeycomb
- 11.1.3. Wood
- 11.1.3.1. Balsa
- 11.1.3.2. Other Woods
- 11.1.1. Foam Core
- 11.2. Market Analysis, Insights and Forecast - by End-user Industry
- 11.2.1. Aerospace and Defense
- 11.2.2. Marine
- 11.2.3. Construction
- 11.2.4. Wind Energy
- 11.2.5. Automotive
- 11.2.6. Consumer Goods
- 11.2.7. Other End-user Industries
- 11.1. Market Analysis, Insights and Forecast - by Type
- 12. Saudi Arabia Core Materials for Composites Industry Analysis, Insights and Forecast, 2021-2033
- 12.1. Market Analysis, Insights and Forecast - by Type
- 12.1.1. Foam Core
- 12.1.1.1. PVC Foam
- 12.1.1.2. Polystyrene Foam
- 12.1.1.3. Polyurethane Foam
- 12.1.1.4. PMMA Foam
- 12.1.1.5. SAN Co-polymer Foam
- 12.1.1.6. Other Thermoplastics
- 12.1.2. Honeycomb
- 12.1.2.1. Aluminum Honeycomb
- 12.1.2.2. Nomex Honeycomb
- 12.1.2.3. Thermoplastic Honeycomb
- 12.1.3. Wood
- 12.1.3.1. Balsa
- 12.1.3.2. Other Woods
- 12.1.1. Foam Core
- 12.2. Market Analysis, Insights and Forecast - by End-user Industry
- 12.2.1. Aerospace and Defense
- 12.2.2. Marine
- 12.2.3. Construction
- 12.2.4. Wind Energy
- 12.2.5. Automotive
- 12.2.6. Consumer Goods
- 12.2.7. Other End-user Industries
- 12.1. Market Analysis, Insights and Forecast - by Type
- 13. Competitive Analysis
- 13.1. Company Profiles
- 13.1.1 3A Composites
- 13.1.1.1. Company Overview
- 13.1.1.2. Products
- 13.1.1.3. Company Financials
- 13.1.1.4. SWOT Analysis
- 13.1.2 Armacell International SA
- 13.1.2.1. Company Overview
- 13.1.2.2. Products
- 13.1.2.3. Company Financials
- 13.1.2.4. SWOT Analysis
- 13.1.3 Changzhou Tiansheng New Materials Co Ltd
- 13.1.3.1. Company Overview
- 13.1.3.2. Products
- 13.1.3.3. Company Financials
- 13.1.3.4. SWOT Analysis
- 13.1.4 Diab International AB
- 13.1.4.1. Company Overview
- 13.1.4.2. Products
- 13.1.4.3. Company Financials
- 13.1.4.4. SWOT Analysis
- 13.1.5 Euro-Composites SA
- 13.1.5.1. Company Overview
- 13.1.5.2. Products
- 13.1.5.3. Company Financials
- 13.1.5.4. SWOT Analysis
- 13.1.6 Evonik Industries AG
- 13.1.6.1. Company Overview
- 13.1.6.2. Products
- 13.1.6.3. Company Financials
- 13.1.6.4. SWOT Analysis
- 13.1.7 Gurit Holding AG
- 13.1.7.1. Company Overview
- 13.1.7.2. Products
- 13.1.7.3. Company Financials
- 13.1.7.4. SWOT Analysis
- 13.1.8 Hexcel Corporation
- 13.1.8.1. Company Overview
- 13.1.8.2. Products
- 13.1.8.3. Company Financials
- 13.1.8.4. SWOT Analysis
- 13.1.9 Plascore Incorporated
- 13.1.9.1. Company Overview
- 13.1.9.2. Products
- 13.1.9.3. Company Financials
- 13.1.9.4. SWOT Analysis
- 13.1.10 Saertex GmbH & Co KG
- 13.1.10.1. Company Overview
- 13.1.10.2. Products
- 13.1.10.3. Company Financials
- 13.1.10.4. SWOT Analysis
- 13.1.11 The Gill Corporation*List Not Exhaustive
- 13.1.11.1. Company Overview
- 13.1.11.2. Products
- 13.1.11.3. Company Financials
- 13.1.11.4. SWOT Analysis
- 13.1.1 3A Composites
- 13.2. Market Entropy
- 13.2.1 Company's Key Areas Served
- 13.2.2 Recent Developments
- 13.3. Company Market Share Analysis 2025
- 13.3.1 Top 5 Companies Market Share Analysis
- 13.3.2 Top 3 Companies Market Share Analysis
- 13.4. List of Potential Customers
- 14. Research Methodology
List of Figures
- Figure 1: Global Core Materials for Composites Industry Revenue Breakdown (billion, %) by Region 2025 & 2033
- Figure 2: Asia Pacific Core Materials for Composites Industry Revenue (billion), by Type 2025 & 2033
- Figure 3: Asia Pacific Core Materials for Composites Industry Revenue Share (%), by Type 2025 & 2033
- Figure 4: Asia Pacific Core Materials for Composites Industry Revenue (billion), by End-user Industry 2025 & 2033
- Figure 5: Asia Pacific Core Materials for Composites Industry Revenue Share (%), by End-user Industry 2025 & 2033
- Figure 6: Asia Pacific Core Materials for Composites Industry Revenue (billion), by Country 2025 & 2033
- Figure 7: Asia Pacific Core Materials for Composites Industry Revenue Share (%), by Country 2025 & 2033
- Figure 8: North America Core Materials for Composites Industry Revenue (billion), by Type 2025 & 2033
- Figure 9: North America Core Materials for Composites Industry Revenue Share (%), by Type 2025 & 2033
- Figure 10: North America Core Materials for Composites Industry Revenue (billion), by End-user Industry 2025 & 2033
- Figure 11: North America Core Materials for Composites Industry Revenue Share (%), by End-user Industry 2025 & 2033
- Figure 12: North America Core Materials for Composites Industry Revenue (billion), by Country 2025 & 2033
- Figure 13: North America Core Materials for Composites Industry Revenue Share (%), by Country 2025 & 2033
- Figure 14: Europe Core Materials for Composites Industry Revenue (billion), by Type 2025 & 2033
- Figure 15: Europe Core Materials for Composites Industry Revenue Share (%), by Type 2025 & 2033
- Figure 16: Europe Core Materials for Composites Industry Revenue (billion), by End-user Industry 2025 & 2033
- Figure 17: Europe Core Materials for Composites Industry Revenue Share (%), by End-user Industry 2025 & 2033
- Figure 18: Europe Core Materials for Composites Industry Revenue (billion), by Country 2025 & 2033
- Figure 19: Europe Core Materials for Composites Industry Revenue Share (%), by Country 2025 & 2033
- Figure 20: South America Core Materials for Composites Industry Revenue (billion), by Type 2025 & 2033
- Figure 21: South America Core Materials for Composites Industry Revenue Share (%), by Type 2025 & 2033
- Figure 22: South America Core Materials for Composites Industry Revenue (billion), by End-user Industry 2025 & 2033
- Figure 23: South America Core Materials for Composites Industry Revenue Share (%), by End-user Industry 2025 & 2033
- Figure 24: South America Core Materials for Composites Industry Revenue (billion), by Country 2025 & 2033
- Figure 25: South America Core Materials for Composites Industry Revenue Share (%), by Country 2025 & 2033
- Figure 26: Middle East Core Materials for Composites Industry Revenue (billion), by Type 2025 & 2033
- Figure 27: Middle East Core Materials for Composites Industry Revenue Share (%), by Type 2025 & 2033
- Figure 28: Middle East Core Materials for Composites Industry Revenue (billion), by End-user Industry 2025 & 2033
- Figure 29: Middle East Core Materials for Composites Industry Revenue Share (%), by End-user Industry 2025 & 2033
- Figure 30: Middle East Core Materials for Composites Industry Revenue (billion), by Country 2025 & 2033
- Figure 31: Middle East Core Materials for Composites Industry Revenue Share (%), by Country 2025 & 2033
- Figure 32: Saudi Arabia Core Materials for Composites Industry Revenue (billion), by Type 2025 & 2033
- Figure 33: Saudi Arabia Core Materials for Composites Industry Revenue Share (%), by Type 2025 & 2033
- Figure 34: Saudi Arabia Core Materials for Composites Industry Revenue (billion), by End-user Industry 2025 & 2033
- Figure 35: Saudi Arabia Core Materials for Composites Industry Revenue Share (%), by End-user Industry 2025 & 2033
- Figure 36: Saudi Arabia Core Materials for Composites Industry Revenue (billion), by Country 2025 & 2033
- Figure 37: Saudi Arabia Core Materials for Composites Industry Revenue Share (%), by Country 2025 & 2033
List of Tables
- Table 1: Global Core Materials for Composites Industry Revenue billion Forecast, by Type 2020 & 2033
- Table 2: Global Core Materials for Composites Industry Revenue billion Forecast, by End-user Industry 2020 & 2033
- Table 3: Global Core Materials for Composites Industry Revenue billion Forecast, by Region 2020 & 2033
- Table 4: Global Core Materials for Composites Industry Revenue billion Forecast, by Type 2020 & 2033
- Table 5: Global Core Materials for Composites Industry Revenue billion Forecast, by End-user Industry 2020 & 2033
- Table 6: Global Core Materials for Composites Industry Revenue billion Forecast, by Country 2020 & 2033
- Table 7: China Core Materials for Composites Industry Revenue (billion) Forecast, by Application 2020 & 2033
- Table 8: India Core Materials for Composites Industry Revenue (billion) Forecast, by Application 2020 & 2033
- Table 9: Japan Core Materials for Composites Industry Revenue (billion) Forecast, by Application 2020 & 2033
- Table 10: South Korea Core Materials for Composites Industry Revenue (billion) Forecast, by Application 2020 & 2033
- Table 11: ASEAN Countries Core Materials for Composites Industry Revenue (billion) Forecast, by Application 2020 & 2033
- Table 12: Rest of Asia Pacific Core Materials for Composites Industry Revenue (billion) Forecast, by Application 2020 & 2033
- Table 13: Global Core Materials for Composites Industry Revenue billion Forecast, by Type 2020 & 2033
- Table 14: Global Core Materials for Composites Industry Revenue billion Forecast, by End-user Industry 2020 & 2033
- Table 15: Global Core Materials for Composites Industry Revenue billion Forecast, by Country 2020 & 2033
- Table 16: United States Core Materials for Composites Industry Revenue (billion) Forecast, by Application 2020 & 2033
- Table 17: Canada Core Materials for Composites Industry Revenue (billion) Forecast, by Application 2020 & 2033
- Table 18: Mexico Core Materials for Composites Industry Revenue (billion) Forecast, by Application 2020 & 2033
- Table 19: Global Core Materials for Composites Industry Revenue billion Forecast, by Type 2020 & 2033
- Table 20: Global Core Materials for Composites Industry Revenue billion Forecast, by End-user Industry 2020 & 2033
- Table 21: Global Core Materials for Composites Industry Revenue billion Forecast, by Country 2020 & 2033
- Table 22: Germany Core Materials for Composites Industry Revenue (billion) Forecast, by Application 2020 & 2033
- Table 23: United Kingdom Core Materials for Composites Industry Revenue (billion) Forecast, by Application 2020 & 2033
- Table 24: Italy Core Materials for Composites Industry Revenue (billion) Forecast, by Application 2020 & 2033
- Table 25: France Core Materials for Composites Industry Revenue (billion) Forecast, by Application 2020 & 2033
- Table 26: Spain Core Materials for Composites Industry Revenue (billion) Forecast, by Application 2020 & 2033
- Table 27: Rest of Europe Core Materials for Composites Industry Revenue (billion) Forecast, by Application 2020 & 2033
- Table 28: Global Core Materials for Composites Industry Revenue billion Forecast, by Type 2020 & 2033
- Table 29: Global Core Materials for Composites Industry Revenue billion Forecast, by End-user Industry 2020 & 2033
- Table 30: Global Core Materials for Composites Industry Revenue billion Forecast, by Country 2020 & 2033
- Table 31: Brazil Core Materials for Composites Industry Revenue (billion) Forecast, by Application 2020 & 2033
- Table 32: Argentina Core Materials for Composites Industry Revenue (billion) Forecast, by Application 2020 & 2033
- Table 33: Rest of South America Core Materials for Composites Industry Revenue (billion) Forecast, by Application 2020 & 2033
- Table 34: Global Core Materials for Composites Industry Revenue billion Forecast, by Type 2020 & 2033
- Table 35: Global Core Materials for Composites Industry Revenue billion Forecast, by End-user Industry 2020 & 2033
- Table 36: Global Core Materials for Composites Industry Revenue billion Forecast, by Country 2020 & 2033
- Table 37: Global Core Materials for Composites Industry Revenue billion Forecast, by Type 2020 & 2033
- Table 38: Global Core Materials for Composites Industry Revenue billion Forecast, by End-user Industry 2020 & 2033
- Table 39: Global Core Materials for Composites Industry Revenue billion Forecast, by Country 2020 & 2033
- Table 40: South Africa Core Materials for Composites Industry Revenue (billion) Forecast, by Application 2020 & 2033
- Table 41: Rest of Middle East Core Materials for Composites Industry Revenue (billion) Forecast, by Application 2020 & 2033
Frequently Asked Questions
1. What is the projected Compound Annual Growth Rate (CAGR) of the Core Materials for Composites Industry?
The projected CAGR is approximately 9.29%.
2. Which companies are prominent players in the Core Materials for Composites Industry?
Key companies in the market include 3A Composites, Armacell International SA, Changzhou Tiansheng New Materials Co Ltd, Diab International AB, Euro-Composites SA, Evonik Industries AG, Gurit Holding AG, Hexcel Corporation, Plascore Incorporated, Saertex GmbH & Co KG, The Gill Corporation*List Not Exhaustive.
3. What are the main segments of the Core Materials for Composites Industry?
The market segments include Type, End-user Industry.
4. Can you provide details about the market size?
The market size is estimated to be USD 7.16 billion as of 2022.
5. What are some drivers contributing to market growth?
; Increasing Demand from the Wind Energy Domain; Increasing Use of Composites in the Aerospace Industry; Emerging Applications in the Automotive Market.
6. What are the notable trends driving market growth?
Growing Usage in Aerospace and Defense Sector.
7. Are there any restraints impacting market growth?
; Increasing Demand from the Wind Energy Domain; Increasing Use of Composites in the Aerospace Industry; Emerging Applications in the Automotive Market.
8. Can you provide examples of recent developments in the market?
N/A
9. What pricing options are available for accessing the report?
Pricing options include single-user, multi-user, and enterprise licenses priced at USD 4750, USD 5250, and USD 8750 respectively.
10. Is the market size provided in terms of value or volume?
The market size is provided in terms of value, measured in billion.
11. Are there any specific market keywords associated with the report?
Yes, the market keyword associated with the report is "Core Materials for Composites Industry," which aids in identifying and referencing the specific market segment covered.
12. How do I determine which pricing option suits my needs best?
The pricing options vary based on user requirements and access needs. Individual users may opt for single-user licenses, while businesses requiring broader access may choose multi-user or enterprise licenses for cost-effective access to the report.
13. Are there any additional resources or data provided in the Core Materials for Composites Industry report?
While the report offers comprehensive insights, it's advisable to review the specific contents or supplementary materials provided to ascertain if additional resources or data are available.
14. How can I stay updated on further developments or reports in the Core Materials for Composites Industry?
To stay informed about further developments, trends, and reports in the Core Materials for Composites Industry, consider subscribing to industry newsletters, following relevant companies and organizations, or regularly checking reputable industry news sources and publications.
Methodology
Step 1 - Identification of Relevant Samples Size from Population Database


Step 2 - Approaches for Defining Global Market Size (Value, Volume* & Price*)

Note*: In applicable scenarios
Step 3 - Data Sources
Primary Research
- Web Analytics
- Survey Reports
- Research Institute
- Latest Research Reports
- Opinion Leaders
Secondary Research
- Annual Reports
- White Paper
- Latest Press Release
- Industry Association
- Paid Database
- Investor Presentations

Step 4 - Data Triangulation
Involves using different sources of information in order to increase the validity of a study
These sources are likely to be stakeholders in a program - participants, other researchers, program staff, other community members, and so on.
Then we put all data in single framework & apply various statistical tools to find out the dynamic on the market.
During the analysis stage, feedback from the stakeholder groups would be compared to determine areas of agreement as well as areas of divergence