

Key Insights
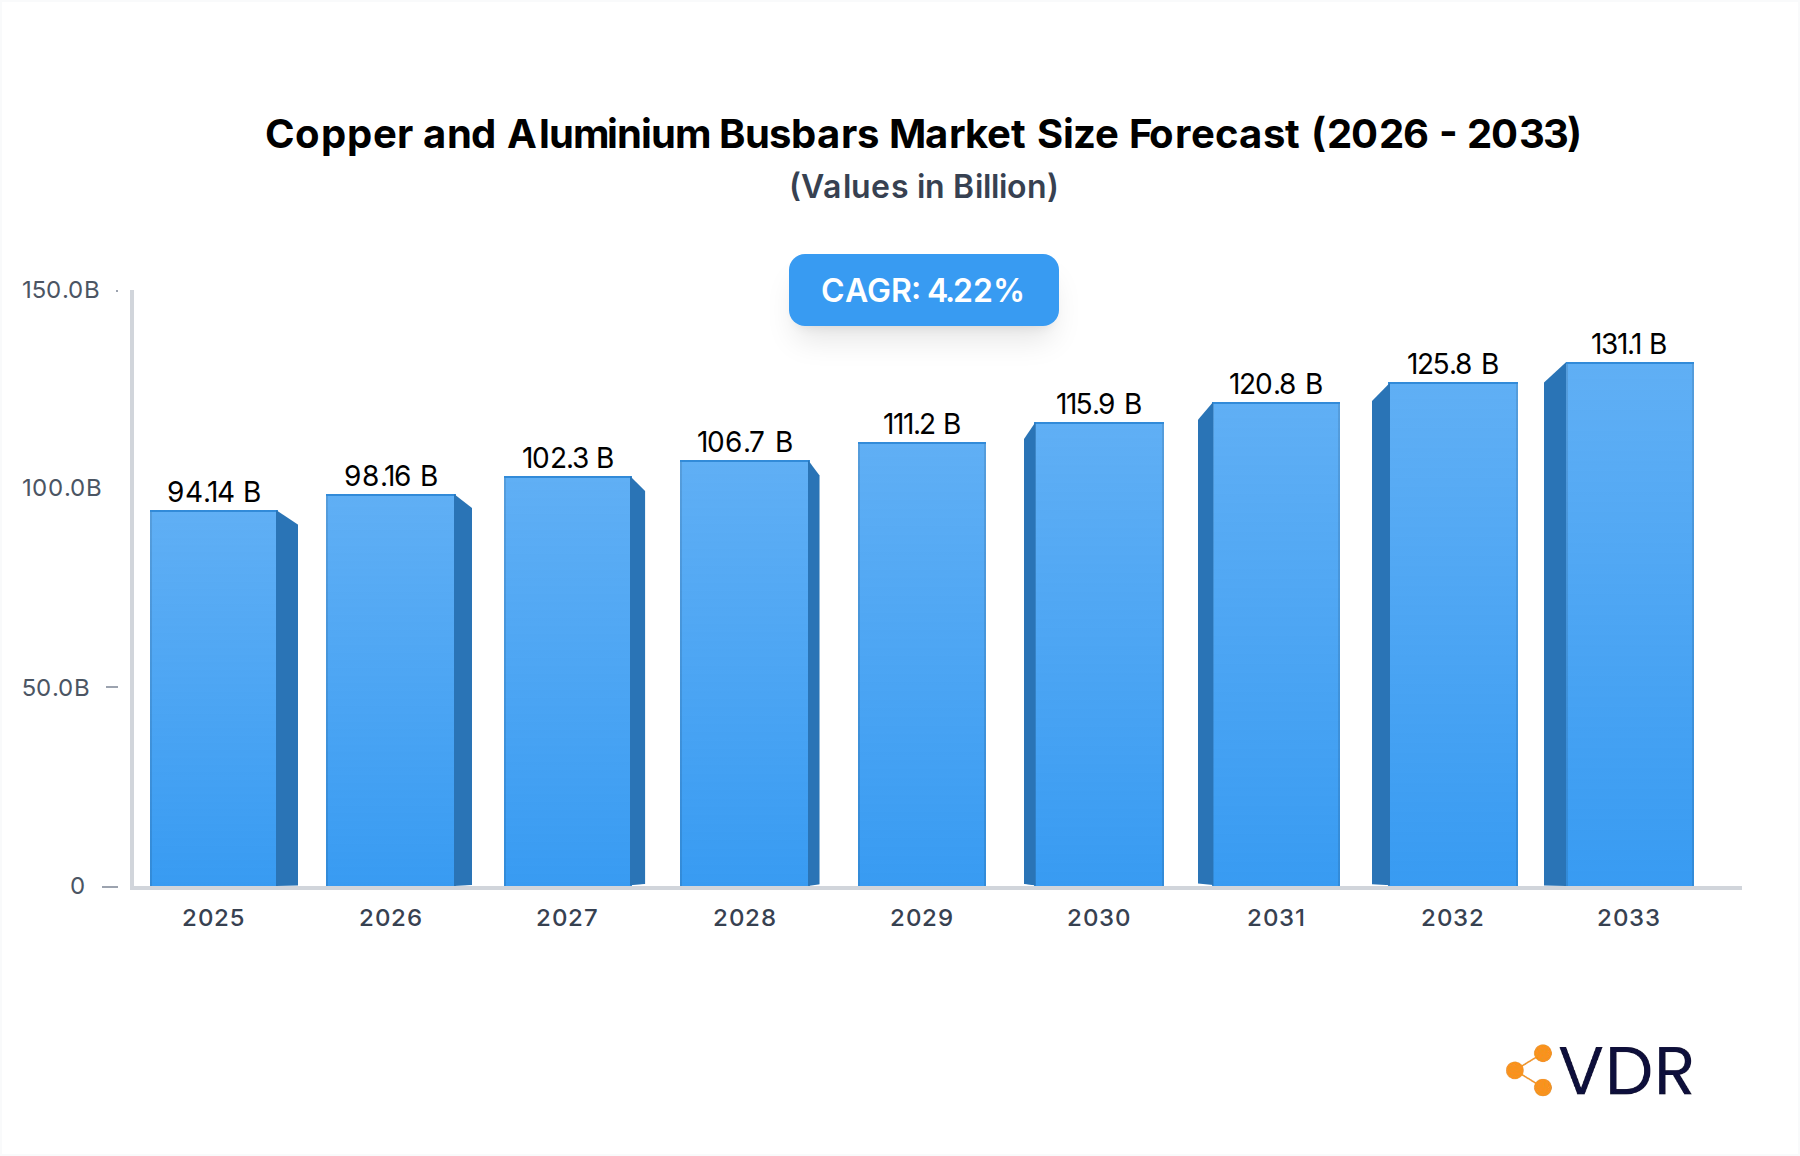
The global Copper and Aluminium Busbars market is projected to reach a significant $94.14 billion in 2025, exhibiting a robust compound annual growth rate (CAGR) of 4.35% through the forecast period of 2025-2033. This expansion is fueled by the escalating demand for reliable and efficient electrical power distribution across diverse sectors. The Utilities sector remains a cornerstone of this market, driven by the continuous need for infrastructure upgrades and the integration of renewable energy sources requiring substantial busbar capacity. Residential and commercial construction projects, particularly in developing economies, also contribute significantly to market growth as electrical systems become more complex and energy-intensive. Industrial applications, from manufacturing plants to data centers, further underscore the importance of high-performance busbars for seamless power flow and operational efficiency. The inherent conductivity and durability of copper, coupled with the cost-effectiveness and lighter weight of aluminum, ensure both materials maintain strong market presence, catering to specific application requirements and price sensitivities.

Copper and Aluminium Busbars Market Size (In Billion)
The market's upward trajectory is further propelled by key trends such as the increasing adoption of smart grid technologies and the growing electrification of transportation. These advancements necessitate advanced busbar solutions capable of handling higher power densities and offering enhanced safety features. While the market benefits from these drivers, certain restraints such as volatile raw material prices, particularly for copper, can pose challenges to consistent profitability. However, ongoing innovation in manufacturing processes, including advancements in material science and design, is continuously improving the performance and cost-effectiveness of busbars. Geographically, Asia Pacific, led by China and India, is anticipated to be a dominant region due to rapid industrialization and expanding infrastructure. North America and Europe are also expected to see steady growth, driven by stringent safety regulations and the modernization of existing electrical networks. Companies are increasingly focusing on sustainable manufacturing practices and the development of customized busbar solutions to meet the evolving needs of a dynamic global market.
Copper and Aluminium Busbars Company Market Share
Copper and Aluminium Busbars Market Analysis Report: Forecast to 2033
This comprehensive report provides an in-depth analysis of the global Copper and Aluminium Busbars market, offering critical insights into its dynamics, growth trajectories, and future outlook. With a study period spanning from 2019 to 2033, and a base year of 2025, this report is an indispensable resource for industry stakeholders seeking to navigate the evolving landscape of electrical infrastructure components. The market is segmented by application, including Utilities, Residential, Commercial, and Industrial Use, and by type, encompassing Copper Bus Bars and Aluminum Bus Bars. We also examine the parent and child market segments for a more granular understanding of market interdependencies.
Copper and Aluminium Busbars Market Dynamics & Structure
The global Copper and Aluminium Busbars market exhibits a moderately consolidated structure, with key players like ABB, Siemens, Eaton, and Schneider Electric holding significant market share. This concentration is driven by substantial capital investments required for manufacturing, stringent quality control standards, and the need for extensive distribution networks. Technological innovation remains a primary driver, with advancements in material science leading to enhanced conductivity, durability, and thermal management properties for both copper and aluminum busbars. Regulatory frameworks, particularly concerning electrical safety standards and environmental compliance (e.g., RoHS, REACH), play a crucial role in shaping product development and market entry. Competitive product substitutes, such as advanced cable systems, present a challenge, albeit one mitigated by the inherent advantages of busbars in high-current applications and modular electrical distribution. End-user demographics are increasingly influenced by the growing demand for renewable energy integration, smart grids, and electrification of transportation, all of which necessitate robust and efficient busbar solutions. Mergers and acquisitions (M&A) trends are notable, with larger conglomerates acquiring specialized busbar manufacturers to expand their product portfolios and market reach. For instance, recent years have seen several strategic acquisitions aimed at bolstering capabilities in high-voltage busbar technology and sustainable material sourcing. The market is valued in billions of USD, with the parent market for electrical components estimated to be worth over $300 billion, and the child market for busbars comprising a significant portion of this.
- Market Concentration: Moderately consolidated, driven by high entry barriers.
- Technological Innovation: Focus on material science for enhanced conductivity and thermal efficiency.
- Regulatory Frameworks: Safety, environmental compliance, and standardization are key influences.
- Competitive Substitutes: Advanced cabling systems offer an alternative in specific scenarios.
- End-User Demographics: Driven by renewable energy, smart grids, and electrification.
- M&A Trends: Strategic acquisitions to expand product portfolios and market access.
Copper and Aluminium Busbars Growth Trends & Insights
The global Copper and Aluminium Busbars market is poised for robust growth, projected to expand at a significant Compound Annual Growth Rate (CAGR) over the forecast period. This expansion is fundamentally driven by the escalating global demand for electricity, coupled with widespread infrastructure development and modernization initiatives. The Utilities segment, in particular, acts as a primary growth engine, fueled by substantial investments in power generation, transmission, and distribution networks to meet increasing energy needs and integrate renewable energy sources. The ongoing transition towards renewable energy, such as solar and wind power, necessitates sophisticated grid infrastructure and efficient power distribution systems, where busbars play a critical role in handling high currents and ensuring reliable power flow. Furthermore, the burgeoning trend of electrification across various sectors, including transportation (electric vehicles and charging infrastructure) and industrial automation, directly translates into higher demand for high-performance busbars.
Technological advancements are continuously reshaping the market. Innovations in copper alloys are yielding busbars with improved conductivity and thermal resistance, while advancements in aluminum alloys offer lighter weight and cost-effectiveness, broadening their application scope. The development of advanced surface treatments and coatings further enhances the performance and lifespan of both copper and aluminum busbars, making them more resilient to environmental factors and operational stresses.
Consumer behavior shifts are also influencing market dynamics. There is an increasing preference for sustainable and energy-efficient electrical components, pushing manufacturers to adopt eco-friendly materials and production processes. The growing emphasis on smart grid technologies and the Internet of Things (IoT) is driving the demand for highly integrated and intelligent busbar solutions that can facilitate real-time monitoring and control. The market penetration of advanced busbar systems is expected to rise as the benefits of their superior performance, reliability, and cost-effectiveness become more widely recognized across residential, commercial, and industrial applications. The overall market size is projected to reach xx billion USD by 2033, with the copper busbar market valued at xx billion USD and the aluminum busbar market at xx billion USD in 2025.
- Market Size Evolution: Significant expansion driven by infrastructure development and energy demand.
- Adoption Rates: Increasing adoption across Utilities, Residential, Commercial, and Industrial sectors.
- Technological Disruptions: Innovations in material science and manufacturing processes.
- Consumer Behavior Shifts: Growing demand for sustainability, energy efficiency, and smart solutions.
- CAGR: Projected at xx% over the forecast period.
- Market Penetration: Rising for advanced and integrated busbar systems.
Dominant Regions, Countries, or Segments in Copper and Aluminium Busbars
The Utilities segment stands out as the dominant force driving growth in the global Copper and Aluminium Busbars market. This dominance is intrinsically linked to the massive and continuous investments required for the maintenance, upgrade, and expansion of electricity grids worldwide. As nations grapple with meeting escalating energy demands, integrating intermittent renewable energy sources, and modernizing aging infrastructure, the need for high-capacity, reliable, and efficient power transmission and distribution solutions becomes paramount. Busbars are indispensable components in substations, power plants, and transmission lines, facilitating the safe and efficient transfer of electricity.
Asia Pacific, particularly countries like China and India, emerges as the leading region in terms of market size and growth potential. This supremacy is attributable to several key drivers: rapid industrialization and urbanization, significant government initiatives focused on infrastructure development and energy access, and a burgeoning manufacturing sector that consumes substantial electrical power. China, as a global manufacturing hub and a leader in renewable energy deployment, presents a colossal demand for both copper and aluminum busbars. India's ambitious targets for renewable energy integration and its focus on electrifying rural areas further bolster market growth. Economic policies in these regions often favor local manufacturing and large-scale infrastructure projects, creating a conducive environment for busbar suppliers.
In terms of Type, while both copper and aluminum busbars are crucial, the growing emphasis on cost-effectiveness and weight reduction in certain applications is fueling the adoption of Aluminum Bus Bars. However, Copper Bus Bars continue to command a significant market share due to their superior conductivity and thermal performance, especially in high-density power distribution systems where space is limited and high efficiency is critical. The parent market for electrical infrastructure components is projected to be valued at over $300 billion in 2025, with the busbar market expected to contribute a substantial xx billion USD.
- Dominant Segment (Application): Utilities, driven by grid modernization and renewable energy integration.
- Dominant Region: Asia Pacific, led by China and India, due to industrialization and infrastructure investment.
- Key Drivers in Asia Pacific: Rapid urbanization, government policies, manufacturing growth, renewable energy expansion.
- Dominant Segment (Type): Copper Bus Bars for high conductivity applications; Aluminum Bus Bars for cost-effectiveness and weight savings.
- Market Share (Utilities): Estimated at xx% of the total busbar market.
- Growth Potential (Asia Pacific): Projected to grow at a CAGR of xx% during the forecast period.
Copper and Aluminium Busbars Product Landscape
The product landscape for copper and aluminium busbars is characterized by continuous innovation focused on enhancing electrical and thermal performance, durability, and ease of installation. Manufacturers are developing specialized alloys and advanced manufacturing techniques to produce busbars with higher conductivity, improved heat dissipation capabilities, and increased mechanical strength. Applications span a wide spectrum, from high-current power distribution in industrial facilities and substations to compact electrical panels in residential and commercial buildings. Unique selling propositions often revolve around customization for specific project requirements, adherence to stringent international safety and performance standards (e.g., IEC, UL), and the provision of integrated solutions that include connectors and mounting hardware. Technological advancements include the development of pre-fabricated busbar systems for faster assembly and the introduction of antimicrobial coatings for hygiene-sensitive environments.
Key Drivers, Barriers & Challenges in Copper and Aluminium Busbars
Key Drivers:
- Growing Global Electricity Demand: Continuous increase in energy consumption across residential, commercial, and industrial sectors.
- Infrastructure Development and Modernization: Significant investments in upgrading and expanding power grids worldwide.
- Renewable Energy Integration: The need for robust infrastructure to support solar, wind, and other renewable energy sources.
- Electrification Trends: Expansion of electric vehicles, smart cities, and industrial automation.
- Technological Advancements: Innovations in material science and manufacturing leading to improved performance and efficiency.
Key Barriers & Challenges:
- Raw Material Price Volatility: Fluctuations in the prices of copper and aluminum can impact manufacturing costs and final product pricing.
- Supply Chain Disruptions: Geopolitical events, trade disputes, and logistical challenges can affect the availability of raw materials and finished products.
- Stringent Regulations and Standards: Compliance with evolving safety and environmental regulations can increase manufacturing complexity and costs.
- Competition from Alternative Technologies: Advanced cabling solutions and emerging power transmission technologies can pose a competitive threat in specific applications.
- Skilled Labor Shortages: The need for specialized expertise in manufacturing and installation can be a constraint.
- Environmental Concerns: Growing scrutiny on the environmental impact of mining and processing of raw materials.
Emerging Opportunities in Copper and Aluminium Busbars
Emerging opportunities in the Copper and Aluminium Busbars market are largely driven by the global energy transition and the increasing demand for smarter and more efficient electrical infrastructure. The rapid expansion of electric vehicle charging networks presents a significant avenue for growth, requiring high-capacity busbars for charging stations. Furthermore, the development of smart grids and microgrids, designed for enhanced resilience and localized power management, will necessitate advanced busbar solutions capable of dynamic load balancing and real-time monitoring. Untapped markets in developing economies with rapidly expanding electrification efforts, coupled with a growing interest in sustainable and recyclable materials for busbars, offer further potential for innovation and market penetration. The integration of advanced monitoring sensors directly into busbar systems for predictive maintenance is another burgeoning opportunity.
Growth Accelerators in the Copper and Aluminium Busbars Industry
Several key catalysts are accelerating long-term growth in the Copper and Aluminium Busbars industry. Technological breakthroughs in developing high-performance alloys with superior conductivity and thermal management properties are enabling busbars to handle higher current densities and operate more efficiently. Strategic partnerships between busbar manufacturers, power utilities, and technology providers are fostering the development of integrated solutions for smart grids and renewable energy projects. Furthermore, market expansion strategies targeting emerging economies with increasing electrification needs, coupled with a focus on offering customized solutions for specific industrial applications, are significantly driving market growth. The growing adoption of modular and prefabricated busbar systems is also a key accelerator, reducing installation times and labor costs for large-scale projects.
Key Players Shaping the Copper and Aluminium Busbars Market
- Hitachi Metals
- Oriental Copper
- Pentair
- Gindre
- Schneider
- Watteredge
- Luvata
- Gonda Metal
- Metal Gems
- EMS
- Storm Power Components
- ABB
- Eaton
- Legrand
- Schneider Electric
- Siemens
- Chint Electrics
- Mersen
- Power Products
- C&S Electric
- Promet
- Baotai
Notable Milestones in Copper and Aluminium Busbars Sector
- 2019: Hitachi Metals launches new high-conductivity copper alloy for demanding industrial applications.
- 2020: ABB acquires a leading provider of smart grid solutions, enhancing its integrated busbar offerings.
- 2021: Oriental Copper expands its manufacturing capacity to meet rising demand in the Asia Pacific region.
- 2022: Eaton introduces innovative, space-saving busbar systems for commercial buildings.
- 2023: Schneider Electric announces strategic investments in sustainable material sourcing for its busbar production.
- 2024: Siemens patents a new modular busbar design enabling faster installation and greater flexibility.
In-Depth Copper and Aluminium Busbars Market Outlook
The outlook for the Copper and Aluminium Busbars market remains exceptionally positive, driven by an unwavering global demand for reliable and efficient electrical power distribution. The ongoing massive investments in renewable energy infrastructure, coupled with the imperative to modernize aging power grids, will continue to fuel the demand for high-performance busbar solutions. The electrification of transportation and the proliferation of smart city initiatives represent significant growth vectors, creating a sustained need for advanced and integrated busbar systems. Strategic opportunities lie in developing solutions tailored for these rapidly evolving sectors, focusing on enhanced conductivity, thermal management, and smart capabilities. Furthermore, a proactive approach to sustainable material sourcing and manufacturing processes will be crucial for long-term success in an increasingly environmentally conscious market. The market is projected to experience sustained growth, with a projected valuation of xx billion USD by 2033.
Copper and Aluminium Busbars Segmentation
-
1. Application
- 1.1. Utilities
- 1.2. Residential
- 1.3. Commercial
- 1.4. Industrial Use
-
2. Types
- 2.1. Copper Bus Bar
- 2.2. Aluminum Bus Bar
Copper and Aluminium Busbars Segmentation By Geography
-
1. North America
- 1.1. United States
- 1.2. Canada
- 1.3. Mexico
-
2. South America
- 2.1. Brazil
- 2.2. Argentina
- 2.3. Rest of South America
-
3. Europe
- 3.1. United Kingdom
- 3.2. Germany
- 3.3. France
- 3.4. Italy
- 3.5. Spain
- 3.6. Russia
- 3.7. Benelux
- 3.8. Nordics
- 3.9. Rest of Europe
-
4. Middle East & Africa
- 4.1. Turkey
- 4.2. Israel
- 4.3. GCC
- 4.4. North Africa
- 4.5. South Africa
- 4.6. Rest of Middle East & Africa
-
5. Asia Pacific
- 5.1. China
- 5.2. India
- 5.3. Japan
- 5.4. South Korea
- 5.5. ASEAN
- 5.6. Oceania
- 5.7. Rest of Asia Pacific
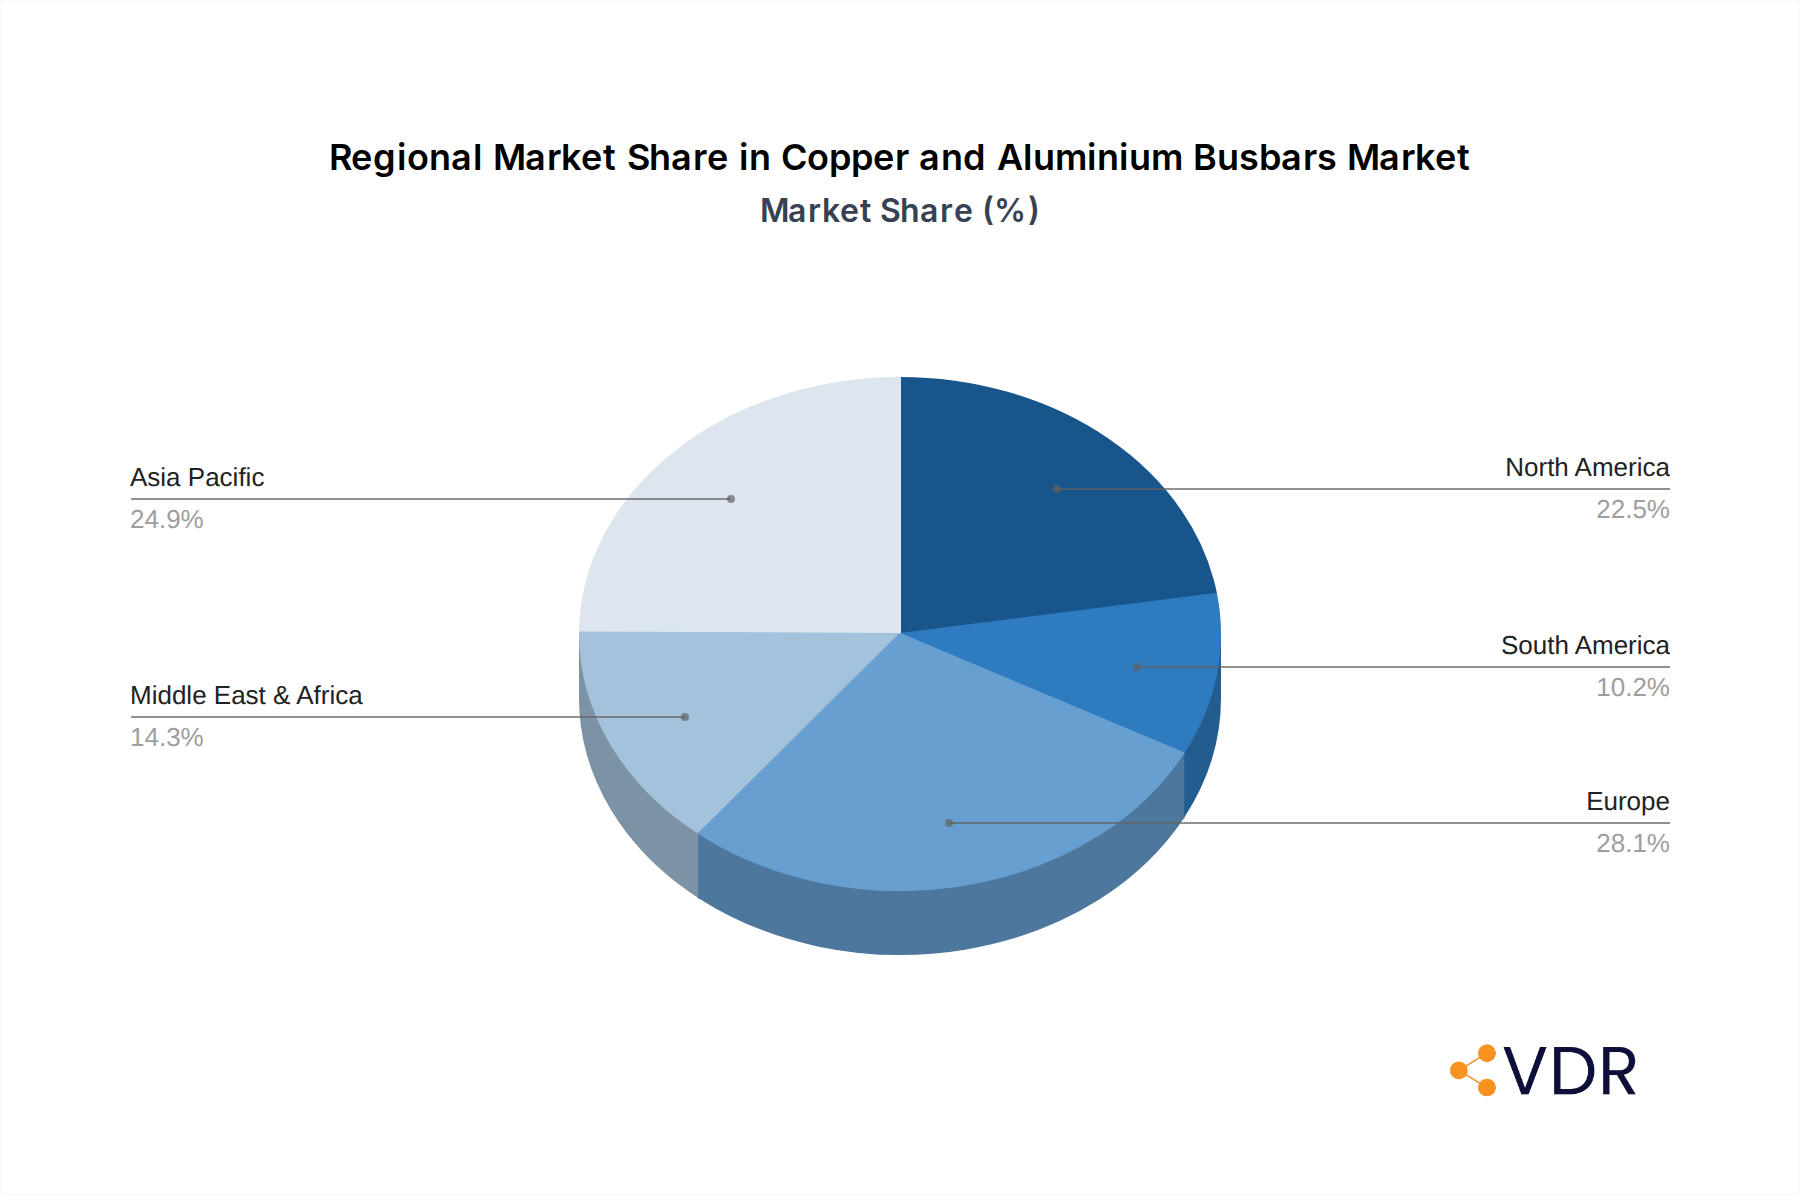
Copper and Aluminium Busbars Regional Market Share
Geographic Coverage of Copper and Aluminium Busbars
Copper and Aluminium Busbars REPORT HIGHLIGHTS
| Aspects | Details |
|---|---|
| Study Period | 2020-2034 |
| Base Year | 2025 |
| Estimated Year | 2026 |
| Forecast Period | 2026-2034 |
| Historical Period | 2020-2025 |
| Growth Rate | CAGR of 4.35% from 2020-2034 |
| Segmentation |
|
Table of Contents
- 1. Introduction
- 1.1. Research Scope
- 1.2. Market Segmentation
- 1.3. Research Methodology
- 1.4. Definitions and Assumptions
- 2. Executive Summary
- 2.1. Introduction
- 3. Market Dynamics
- 3.1. Introduction
- 3.2. Market Drivers
- 3.3. Market Restrains
- 3.4. Market Trends
- 4. Market Factor Analysis
- 4.1. Porters Five Forces
- 4.2. Supply/Value Chain
- 4.3. PESTEL analysis
- 4.4. Market Entropy
- 4.5. Patent/Trademark Analysis
- 5. Global Copper and Aluminium Busbars Analysis, Insights and Forecast, 2020-2032
- 5.1. Market Analysis, Insights and Forecast - by Application
- 5.1.1. Utilities
- 5.1.2. Residential
- 5.1.3. Commercial
- 5.1.4. Industrial Use
- 5.2. Market Analysis, Insights and Forecast - by Types
- 5.2.1. Copper Bus Bar
- 5.2.2. Aluminum Bus Bar
- 5.3. Market Analysis, Insights and Forecast - by Region
- 5.3.1. North America
- 5.3.2. South America
- 5.3.3. Europe
- 5.3.4. Middle East & Africa
- 5.3.5. Asia Pacific
- 5.1. Market Analysis, Insights and Forecast - by Application
- 6. North America Copper and Aluminium Busbars Analysis, Insights and Forecast, 2020-2032
- 6.1. Market Analysis, Insights and Forecast - by Application
- 6.1.1. Utilities
- 6.1.2. Residential
- 6.1.3. Commercial
- 6.1.4. Industrial Use
- 6.2. Market Analysis, Insights and Forecast - by Types
- 6.2.1. Copper Bus Bar
- 6.2.2. Aluminum Bus Bar
- 6.1. Market Analysis, Insights and Forecast - by Application
- 7. South America Copper and Aluminium Busbars Analysis, Insights and Forecast, 2020-2032
- 7.1. Market Analysis, Insights and Forecast - by Application
- 7.1.1. Utilities
- 7.1.2. Residential
- 7.1.3. Commercial
- 7.1.4. Industrial Use
- 7.2. Market Analysis, Insights and Forecast - by Types
- 7.2.1. Copper Bus Bar
- 7.2.2. Aluminum Bus Bar
- 7.1. Market Analysis, Insights and Forecast - by Application
- 8. Europe Copper and Aluminium Busbars Analysis, Insights and Forecast, 2020-2032
- 8.1. Market Analysis, Insights and Forecast - by Application
- 8.1.1. Utilities
- 8.1.2. Residential
- 8.1.3. Commercial
- 8.1.4. Industrial Use
- 8.2. Market Analysis, Insights and Forecast - by Types
- 8.2.1. Copper Bus Bar
- 8.2.2. Aluminum Bus Bar
- 8.1. Market Analysis, Insights and Forecast - by Application
- 9. Middle East & Africa Copper and Aluminium Busbars Analysis, Insights and Forecast, 2020-2032
- 9.1. Market Analysis, Insights and Forecast - by Application
- 9.1.1. Utilities
- 9.1.2. Residential
- 9.1.3. Commercial
- 9.1.4. Industrial Use
- 9.2. Market Analysis, Insights and Forecast - by Types
- 9.2.1. Copper Bus Bar
- 9.2.2. Aluminum Bus Bar
- 9.1. Market Analysis, Insights and Forecast - by Application
- 10. Asia Pacific Copper and Aluminium Busbars Analysis, Insights and Forecast, 2020-2032
- 10.1. Market Analysis, Insights and Forecast - by Application
- 10.1.1. Utilities
- 10.1.2. Residential
- 10.1.3. Commercial
- 10.1.4. Industrial Use
- 10.2. Market Analysis, Insights and Forecast - by Types
- 10.2.1. Copper Bus Bar
- 10.2.2. Aluminum Bus Bar
- 10.1. Market Analysis, Insights and Forecast - by Application
- 11. Competitive Analysis
- 11.1. Global Market Share Analysis 2025
- 11.2. Company Profiles
- 11.2.1 Hitachi Metals
- 11.2.1.1. Overview
- 11.2.1.2. Products
- 11.2.1.3. SWOT Analysis
- 11.2.1.4. Recent Developments
- 11.2.1.5. Financials (Based on Availability)
- 11.2.2 Oriental Copper
- 11.2.2.1. Overview
- 11.2.2.2. Products
- 11.2.2.3. SWOT Analysis
- 11.2.2.4. Recent Developments
- 11.2.2.5. Financials (Based on Availability)
- 11.2.3 Pentair
- 11.2.3.1. Overview
- 11.2.3.2. Products
- 11.2.3.3. SWOT Analysis
- 11.2.3.4. Recent Developments
- 11.2.3.5. Financials (Based on Availability)
- 11.2.4 Gindre
- 11.2.4.1. Overview
- 11.2.4.2. Products
- 11.2.4.3. SWOT Analysis
- 11.2.4.4. Recent Developments
- 11.2.4.5. Financials (Based on Availability)
- 11.2.5 Schneider
- 11.2.5.1. Overview
- 11.2.5.2. Products
- 11.2.5.3. SWOT Analysis
- 11.2.5.4. Recent Developments
- 11.2.5.5. Financials (Based on Availability)
- 11.2.6 Watteredge
- 11.2.6.1. Overview
- 11.2.6.2. Products
- 11.2.6.3. SWOT Analysis
- 11.2.6.4. Recent Developments
- 11.2.6.5. Financials (Based on Availability)
- 11.2.7 Luvata
- 11.2.7.1. Overview
- 11.2.7.2. Products
- 11.2.7.3. SWOT Analysis
- 11.2.7.4. Recent Developments
- 11.2.7.5. Financials (Based on Availability)
- 11.2.8 Gonda Metal
- 11.2.8.1. Overview
- 11.2.8.2. Products
- 11.2.8.3. SWOT Analysis
- 11.2.8.4. Recent Developments
- 11.2.8.5. Financials (Based on Availability)
- 11.2.9 Metal Gems
- 11.2.9.1. Overview
- 11.2.9.2. Products
- 11.2.9.3. SWOT Analysis
- 11.2.9.4. Recent Developments
- 11.2.9.5. Financials (Based on Availability)
- 11.2.10 EMS
- 11.2.10.1. Overview
- 11.2.10.2. Products
- 11.2.10.3. SWOT Analysis
- 11.2.10.4. Recent Developments
- 11.2.10.5. Financials (Based on Availability)
- 11.2.11 Storm Power Components
- 11.2.11.1. Overview
- 11.2.11.2. Products
- 11.2.11.3. SWOT Analysis
- 11.2.11.4. Recent Developments
- 11.2.11.5. Financials (Based on Availability)
- 11.2.12 ABB
- 11.2.12.1. Overview
- 11.2.12.2. Products
- 11.2.12.3. SWOT Analysis
- 11.2.12.4. Recent Developments
- 11.2.12.5. Financials (Based on Availability)
- 11.2.13 Eaton
- 11.2.13.1. Overview
- 11.2.13.2. Products
- 11.2.13.3. SWOT Analysis
- 11.2.13.4. Recent Developments
- 11.2.13.5. Financials (Based on Availability)
- 11.2.14 Legrand
- 11.2.14.1. Overview
- 11.2.14.2. Products
- 11.2.14.3. SWOT Analysis
- 11.2.14.4. Recent Developments
- 11.2.14.5. Financials (Based on Availability)
- 11.2.15 Schneider Electric
- 11.2.15.1. Overview
- 11.2.15.2. Products
- 11.2.15.3. SWOT Analysis
- 11.2.15.4. Recent Developments
- 11.2.15.5. Financials (Based on Availability)
- 11.2.16 Siemens
- 11.2.16.1. Overview
- 11.2.16.2. Products
- 11.2.16.3. SWOT Analysis
- 11.2.16.4. Recent Developments
- 11.2.16.5. Financials (Based on Availability)
- 11.2.17 Chint Electrics
- 11.2.17.1. Overview
- 11.2.17.2. Products
- 11.2.17.3. SWOT Analysis
- 11.2.17.4. Recent Developments
- 11.2.17.5. Financials (Based on Availability)
- 11.2.18 Mersen
- 11.2.18.1. Overview
- 11.2.18.2. Products
- 11.2.18.3. SWOT Analysis
- 11.2.18.4. Recent Developments
- 11.2.18.5. Financials (Based on Availability)
- 11.2.19 Power Products
- 11.2.19.1. Overview
- 11.2.19.2. Products
- 11.2.19.3. SWOT Analysis
- 11.2.19.4. Recent Developments
- 11.2.19.5. Financials (Based on Availability)
- 11.2.20 C&S Electric
- 11.2.20.1. Overview
- 11.2.20.2. Products
- 11.2.20.3. SWOT Analysis
- 11.2.20.4. Recent Developments
- 11.2.20.5. Financials (Based on Availability)
- 11.2.21 Promet
- 11.2.21.1. Overview
- 11.2.21.2. Products
- 11.2.21.3. SWOT Analysis
- 11.2.21.4. Recent Developments
- 11.2.21.5. Financials (Based on Availability)
- 11.2.22 Baotai
- 11.2.22.1. Overview
- 11.2.22.2. Products
- 11.2.22.3. SWOT Analysis
- 11.2.22.4. Recent Developments
- 11.2.22.5. Financials (Based on Availability)
- 11.2.1 Hitachi Metals
List of Figures
- Figure 1: Global Copper and Aluminium Busbars Revenue Breakdown (billion, %) by Region 2025 & 2033
- Figure 2: North America Copper and Aluminium Busbars Revenue (billion), by Application 2025 & 2033
- Figure 3: North America Copper and Aluminium Busbars Revenue Share (%), by Application 2025 & 2033
- Figure 4: North America Copper and Aluminium Busbars Revenue (billion), by Types 2025 & 2033
- Figure 5: North America Copper and Aluminium Busbars Revenue Share (%), by Types 2025 & 2033
- Figure 6: North America Copper and Aluminium Busbars Revenue (billion), by Country 2025 & 2033
- Figure 7: North America Copper and Aluminium Busbars Revenue Share (%), by Country 2025 & 2033
- Figure 8: South America Copper and Aluminium Busbars Revenue (billion), by Application 2025 & 2033
- Figure 9: South America Copper and Aluminium Busbars Revenue Share (%), by Application 2025 & 2033
- Figure 10: South America Copper and Aluminium Busbars Revenue (billion), by Types 2025 & 2033
- Figure 11: South America Copper and Aluminium Busbars Revenue Share (%), by Types 2025 & 2033
- Figure 12: South America Copper and Aluminium Busbars Revenue (billion), by Country 2025 & 2033
- Figure 13: South America Copper and Aluminium Busbars Revenue Share (%), by Country 2025 & 2033
- Figure 14: Europe Copper and Aluminium Busbars Revenue (billion), by Application 2025 & 2033
- Figure 15: Europe Copper and Aluminium Busbars Revenue Share (%), by Application 2025 & 2033
- Figure 16: Europe Copper and Aluminium Busbars Revenue (billion), by Types 2025 & 2033
- Figure 17: Europe Copper and Aluminium Busbars Revenue Share (%), by Types 2025 & 2033
- Figure 18: Europe Copper and Aluminium Busbars Revenue (billion), by Country 2025 & 2033
- Figure 19: Europe Copper and Aluminium Busbars Revenue Share (%), by Country 2025 & 2033
- Figure 20: Middle East & Africa Copper and Aluminium Busbars Revenue (billion), by Application 2025 & 2033
- Figure 21: Middle East & Africa Copper and Aluminium Busbars Revenue Share (%), by Application 2025 & 2033
- Figure 22: Middle East & Africa Copper and Aluminium Busbars Revenue (billion), by Types 2025 & 2033
- Figure 23: Middle East & Africa Copper and Aluminium Busbars Revenue Share (%), by Types 2025 & 2033
- Figure 24: Middle East & Africa Copper and Aluminium Busbars Revenue (billion), by Country 2025 & 2033
- Figure 25: Middle East & Africa Copper and Aluminium Busbars Revenue Share (%), by Country 2025 & 2033
- Figure 26: Asia Pacific Copper and Aluminium Busbars Revenue (billion), by Application 2025 & 2033
- Figure 27: Asia Pacific Copper and Aluminium Busbars Revenue Share (%), by Application 2025 & 2033
- Figure 28: Asia Pacific Copper and Aluminium Busbars Revenue (billion), by Types 2025 & 2033
- Figure 29: Asia Pacific Copper and Aluminium Busbars Revenue Share (%), by Types 2025 & 2033
- Figure 30: Asia Pacific Copper and Aluminium Busbars Revenue (billion), by Country 2025 & 2033
- Figure 31: Asia Pacific Copper and Aluminium Busbars Revenue Share (%), by Country 2025 & 2033
List of Tables
- Table 1: Global Copper and Aluminium Busbars Revenue billion Forecast, by Application 2020 & 2033
- Table 2: Global Copper and Aluminium Busbars Revenue billion Forecast, by Types 2020 & 2033
- Table 3: Global Copper and Aluminium Busbars Revenue billion Forecast, by Region 2020 & 2033
- Table 4: Global Copper and Aluminium Busbars Revenue billion Forecast, by Application 2020 & 2033
- Table 5: Global Copper and Aluminium Busbars Revenue billion Forecast, by Types 2020 & 2033
- Table 6: Global Copper and Aluminium Busbars Revenue billion Forecast, by Country 2020 & 2033
- Table 7: United States Copper and Aluminium Busbars Revenue (billion) Forecast, by Application 2020 & 2033
- Table 8: Canada Copper and Aluminium Busbars Revenue (billion) Forecast, by Application 2020 & 2033
- Table 9: Mexico Copper and Aluminium Busbars Revenue (billion) Forecast, by Application 2020 & 2033
- Table 10: Global Copper and Aluminium Busbars Revenue billion Forecast, by Application 2020 & 2033
- Table 11: Global Copper and Aluminium Busbars Revenue billion Forecast, by Types 2020 & 2033
- Table 12: Global Copper and Aluminium Busbars Revenue billion Forecast, by Country 2020 & 2033
- Table 13: Brazil Copper and Aluminium Busbars Revenue (billion) Forecast, by Application 2020 & 2033
- Table 14: Argentina Copper and Aluminium Busbars Revenue (billion) Forecast, by Application 2020 & 2033
- Table 15: Rest of South America Copper and Aluminium Busbars Revenue (billion) Forecast, by Application 2020 & 2033
- Table 16: Global Copper and Aluminium Busbars Revenue billion Forecast, by Application 2020 & 2033
- Table 17: Global Copper and Aluminium Busbars Revenue billion Forecast, by Types 2020 & 2033
- Table 18: Global Copper and Aluminium Busbars Revenue billion Forecast, by Country 2020 & 2033
- Table 19: United Kingdom Copper and Aluminium Busbars Revenue (billion) Forecast, by Application 2020 & 2033
- Table 20: Germany Copper and Aluminium Busbars Revenue (billion) Forecast, by Application 2020 & 2033
- Table 21: France Copper and Aluminium Busbars Revenue (billion) Forecast, by Application 2020 & 2033
- Table 22: Italy Copper and Aluminium Busbars Revenue (billion) Forecast, by Application 2020 & 2033
- Table 23: Spain Copper and Aluminium Busbars Revenue (billion) Forecast, by Application 2020 & 2033
- Table 24: Russia Copper and Aluminium Busbars Revenue (billion) Forecast, by Application 2020 & 2033
- Table 25: Benelux Copper and Aluminium Busbars Revenue (billion) Forecast, by Application 2020 & 2033
- Table 26: Nordics Copper and Aluminium Busbars Revenue (billion) Forecast, by Application 2020 & 2033
- Table 27: Rest of Europe Copper and Aluminium Busbars Revenue (billion) Forecast, by Application 2020 & 2033
- Table 28: Global Copper and Aluminium Busbars Revenue billion Forecast, by Application 2020 & 2033
- Table 29: Global Copper and Aluminium Busbars Revenue billion Forecast, by Types 2020 & 2033
- Table 30: Global Copper and Aluminium Busbars Revenue billion Forecast, by Country 2020 & 2033
- Table 31: Turkey Copper and Aluminium Busbars Revenue (billion) Forecast, by Application 2020 & 2033
- Table 32: Israel Copper and Aluminium Busbars Revenue (billion) Forecast, by Application 2020 & 2033
- Table 33: GCC Copper and Aluminium Busbars Revenue (billion) Forecast, by Application 2020 & 2033
- Table 34: North Africa Copper and Aluminium Busbars Revenue (billion) Forecast, by Application 2020 & 2033
- Table 35: South Africa Copper and Aluminium Busbars Revenue (billion) Forecast, by Application 2020 & 2033
- Table 36: Rest of Middle East & Africa Copper and Aluminium Busbars Revenue (billion) Forecast, by Application 2020 & 2033
- Table 37: Global Copper and Aluminium Busbars Revenue billion Forecast, by Application 2020 & 2033
- Table 38: Global Copper and Aluminium Busbars Revenue billion Forecast, by Types 2020 & 2033
- Table 39: Global Copper and Aluminium Busbars Revenue billion Forecast, by Country 2020 & 2033
- Table 40: China Copper and Aluminium Busbars Revenue (billion) Forecast, by Application 2020 & 2033
- Table 41: India Copper and Aluminium Busbars Revenue (billion) Forecast, by Application 2020 & 2033
- Table 42: Japan Copper and Aluminium Busbars Revenue (billion) Forecast, by Application 2020 & 2033
- Table 43: South Korea Copper and Aluminium Busbars Revenue (billion) Forecast, by Application 2020 & 2033
- Table 44: ASEAN Copper and Aluminium Busbars Revenue (billion) Forecast, by Application 2020 & 2033
- Table 45: Oceania Copper and Aluminium Busbars Revenue (billion) Forecast, by Application 2020 & 2033
- Table 46: Rest of Asia Pacific Copper and Aluminium Busbars Revenue (billion) Forecast, by Application 2020 & 2033
Frequently Asked Questions
1. What is the projected Compound Annual Growth Rate (CAGR) of the Copper and Aluminium Busbars?
The projected CAGR is approximately 4.35%.
2. Which companies are prominent players in the Copper and Aluminium Busbars?
Key companies in the market include Hitachi Metals, Oriental Copper, Pentair, Gindre, Schneider, Watteredge, Luvata, Gonda Metal, Metal Gems, EMS, Storm Power Components, ABB, Eaton, Legrand, Schneider Electric, Siemens, Chint Electrics, Mersen, Power Products, C&S Electric, Promet, Baotai.
3. What are the main segments of the Copper and Aluminium Busbars?
The market segments include Application, Types.
4. Can you provide details about the market size?
The market size is estimated to be USD 94.14 billion as of 2022.
5. What are some drivers contributing to market growth?
N/A
6. What are the notable trends driving market growth?
N/A
7. Are there any restraints impacting market growth?
N/A
8. Can you provide examples of recent developments in the market?
N/A
9. What pricing options are available for accessing the report?
Pricing options include single-user, multi-user, and enterprise licenses priced at USD 4900.00, USD 7350.00, and USD 9800.00 respectively.
10. Is the market size provided in terms of value or volume?
The market size is provided in terms of value, measured in billion.
11. Are there any specific market keywords associated with the report?
Yes, the market keyword associated with the report is "Copper and Aluminium Busbars," which aids in identifying and referencing the specific market segment covered.
12. How do I determine which pricing option suits my needs best?
The pricing options vary based on user requirements and access needs. Individual users may opt for single-user licenses, while businesses requiring broader access may choose multi-user or enterprise licenses for cost-effective access to the report.
13. Are there any additional resources or data provided in the Copper and Aluminium Busbars report?
While the report offers comprehensive insights, it's advisable to review the specific contents or supplementary materials provided to ascertain if additional resources or data are available.
14. How can I stay updated on further developments or reports in the Copper and Aluminium Busbars?
To stay informed about further developments, trends, and reports in the Copper and Aluminium Busbars, consider subscribing to industry newsletters, following relevant companies and organizations, or regularly checking reputable industry news sources and publications.
Methodology
Step 1 - Identification of Relevant Samples Size from Population Database


Step 2 - Approaches for Defining Global Market Size (Value, Volume* & Price*)

Note*: In applicable scenarios
Step 3 - Data Sources
Primary Research
- Web Analytics
- Survey Reports
- Research Institute
- Latest Research Reports
- Opinion Leaders
Secondary Research
- Annual Reports
- White Paper
- Latest Press Release
- Industry Association
- Paid Database
- Investor Presentations

Step 4 - Data Triangulation
Involves using different sources of information in order to increase the validity of a study
These sources are likely to be stakeholders in a program - participants, other researchers, program staff, other community members, and so on.
Then we put all data in single framework & apply various statistical tools to find out the dynamic on the market.
During the analysis stage, feedback from the stakeholder groups would be compared to determine areas of agreement as well as areas of divergence