
Key Insights
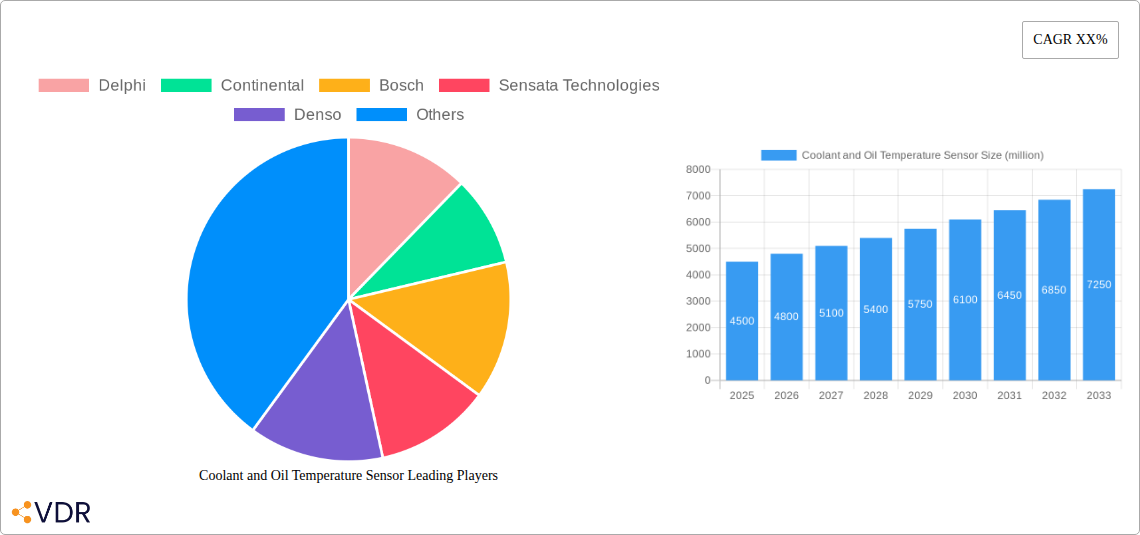
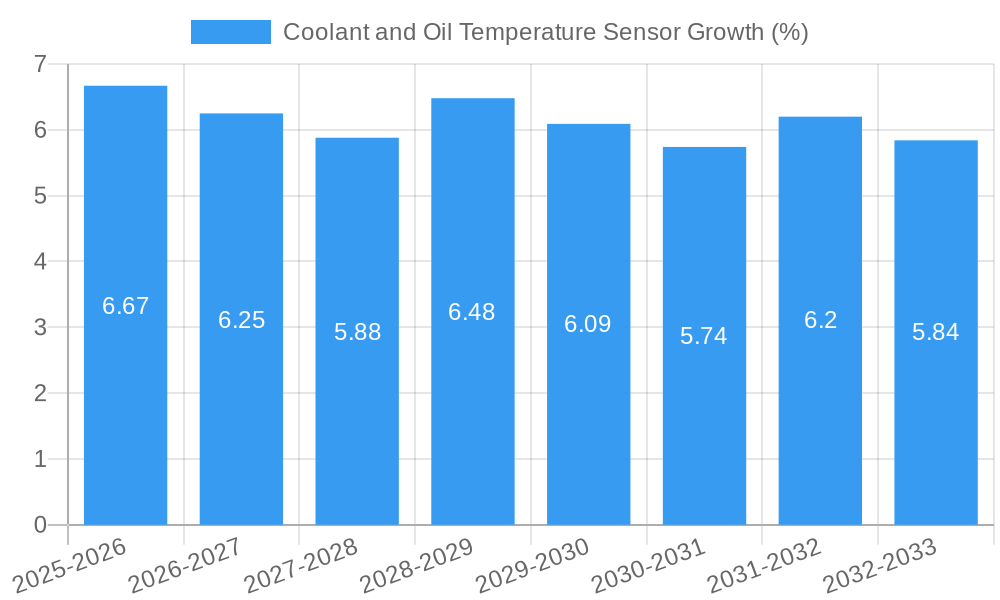
The global market for coolant and oil temperature sensors is experiencing robust growth, driven by an escalating demand for enhanced vehicle performance, fuel efficiency, and stringent emission control regulations worldwide. This market, valued at an estimated USD 4.5 billion in 2025, is projected to expand at a Compound Annual Growth Rate (CAGR) of 6.5%, reaching approximately USD 7.5 billion by 2033. A primary driver is the increasing sophistication of modern vehicles, particularly in the passenger car segment, where advanced engine management systems rely heavily on accurate temperature data to optimize combustion and prevent overheating. The growing adoption of electric vehicles (EVs) and hybrid electric vehicles (HEVs) also contributes significantly, as precise thermal management is crucial for battery performance, longevity, and overall system efficiency in these powertrains. Furthermore, the continuous innovation in sensor technology, leading to more accurate, durable, and cost-effective solutions, is fueling market expansion. The commercial vehicle sector, with its focus on operational efficiency and reduced downtime, is also a key contributor to this growth, as reliable temperature monitoring is essential for heavy-duty engine health.
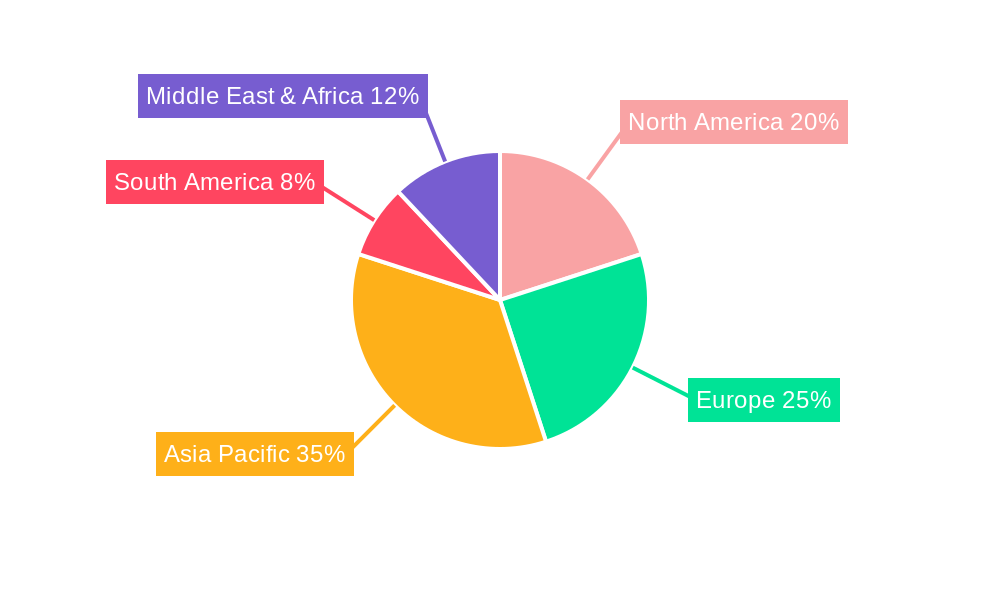
The market dynamics are further shaped by emerging trends such as the integration of these sensors into broader automotive electronic architectures and the development of smart sensor technologies capable of predictive diagnostics. While the market presents a positive outlook, certain restraints, like the commoditization of basic sensor types and potential supply chain disruptions, could pose challenges. However, the persistent focus on vehicle safety, reliability, and the ongoing evolution of automotive electronics are expected to outweigh these limitations. Key players like Delphi, Continental, Bosch, and Denso are at the forefront of innovation, investing heavily in research and development to meet the evolving needs of automakers globally. The Asia Pacific region, particularly China and India, is anticipated to be a major growth engine due to its large automotive manufacturing base and increasing domestic vehicle sales, coupled with a rising demand for sophisticated automotive components.
This in-depth market report provides a detailed analysis of the global Coolant and Oil Temperature Sensor market, offering critical insights for industry stakeholders. With a study period spanning from 2019 to 2033, including a base year of 2025 and a forecast period from 2025 to 2033, this report delves into market dynamics, growth trends, regional dominance, product landscapes, key drivers, barriers, emerging opportunities, and the competitive landscape. Leveraging high-traffic keywords such as "automotive sensors," "engine temperature sensor," "vehicle coolant sensor," "oil temp sensor," "automotive aftermarket," and "OEM automotive parts," this report is optimized for maximum search engine visibility and designed to engage professionals across the automotive value chain, from component manufacturers and suppliers to vehicle OEMs and aftermarket service providers. The report also meticulously analyzes the parent and child markets, providing a holistic view of market interconnectedness.
Coolant and Oil Temperature Sensor Market Dynamics & Structure
The global Coolant and Oil Temperature Sensor market is characterized by a moderately consolidated structure, with key players like Delphi, Continental, Bosch, Sensata Technologies, and Denso holding significant market share. Technological innovation is a primary driver, fueled by the increasing demand for advanced engine management systems, enhanced fuel efficiency, and stricter emission regulations worldwide. Regulatory frameworks, particularly those concerning vehicle emissions and diagnostic capabilities, are shaping product development and adoption. Competitive product substitutes are limited, with advanced sensor technologies offering distinct advantages in accuracy and reliability. End-user demographics are shifting towards a greater demand for sophisticated vehicle electronics and predictive maintenance solutions. Mergers and acquisitions (M&A) are a recurring trend, with companies consolidating to enhance their product portfolios, expand their geographical reach, and gain a competitive edge. For instance, recent M&A activities have focused on integrating sensor technology with broader automotive electronics solutions. Barriers to innovation include the high cost of research and development and the long product validation cycles within the automotive industry. Market concentration is estimated to be around 45% among the top five players. Recent M&A deal volumes indicate a trend towards strategic partnerships and acquisitions in the sensor domain, with approximately 5 significant deals in the past three years.
Coolant and Oil Temperature Sensor Growth Trends & Insights
The global Coolant and Oil Temperature Sensor market is poised for substantial growth, driven by an evolving automotive landscape. The market size is projected to reach approximately $5,500 million by 2033, with a Compound Annual Growth Rate (CAGR) of around 6.8% during the forecast period of 2025–2033. Adoption rates for these critical engine components are steadily increasing, propelled by the global automotive production volumes and the growing sophistication of vehicle powertrains. Technological disruptions, such as the development of more robust and accurate sensor materials and the integration of intelligent sensing capabilities, are key factors influencing market dynamics. Consumer behavior is shifting towards a greater emphasis on vehicle reliability, performance, and extended engine life, thereby increasing the demand for high-quality temperature sensors. The aftermarket segment is expected to witness significant growth as older vehicles require component replacements. The increasing penetration of advanced driver-assistance systems (ADAS) and autonomous driving technologies, which rely on precise engine condition monitoring, further fuels demand. The transition towards electric vehicles (EVs) also presents new opportunities, as thermal management is crucial for battery performance and longevity, driving the need for advanced temperature sensing solutions in EV powertrains and battery packs. By 2025, the market is estimated to be valued at approximately $3,800 million, reflecting continued expansion. The penetration of advanced engine monitoring systems in new vehicles is projected to reach 95% by 2030.
Dominant Regions, Countries, or Segments in Coolant and Oil Temperature Sensor
The Passenger Vehicles segment, within the Application category, is the dominant force driving the global Coolant and Oil Temperature Sensor market growth. This dominance is attributed to the sheer volume of passenger car production worldwide and the increasing integration of advanced engine management systems in these vehicles. The Asia Pacific region, particularly China, is a significant growth engine, owing to its massive automotive manufacturing base and burgeoning domestic demand for vehicles equipped with sophisticated engine monitoring technology. Economic policies in these regions, such as incentives for domestic automotive manufacturing and emissions standards, further bolster the demand for these essential components. Infrastructure development, including the expansion of vehicle production facilities and robust supply chains, also contributes to the regional dominance. The market share held by the Passenger Vehicles segment is estimated to be around 70% of the total market value. Key drivers in this segment include the increasing adoption of sophisticated engine control units (ECUs) for optimized fuel efficiency and reduced emissions, a growing middle class in emerging economies leading to higher vehicle ownership, and stringent government regulations on vehicle performance and environmental impact. Countries like the United States and Germany also contribute significantly due to their established automotive industries and high vehicle parc. The growth potential within this segment remains robust due to ongoing technological advancements and the continuous introduction of new vehicle models.
Coolant and Oil Temperature Sensor Product Landscape
The product landscape of Coolant and Oil Temperature Sensors is characterized by continuous innovation, focusing on enhanced accuracy, durability, and integration capabilities. Advancements include the development of miniaturized sensors, high-temperature resistant materials, and multi-functional sensors capable of measuring both coolant and oil temperatures. These sensors are integral to modern engine management systems, playing a crucial role in optimizing combustion, preventing overheating, and ensuring peak performance. Unique selling propositions lie in their ability to provide real-time, precise data to the vehicle's ECU, thereby enabling more efficient fuel injection, ignition timing, and emission control. Technological advancements are enabling greater resilience to harsh under-hood environments, extending sensor lifespan and reducing maintenance requirements.
Key Drivers, Barriers & Challenges in Coolant and Oil Temperature Sensor
Key Drivers:
- Increasing Automotive Production: Global growth in vehicle manufacturing directly fuels demand for these essential sensors.
- Stringent Emission Regulations: Growing environmental concerns and governmental mandates necessitate precise engine control, driven by accurate temperature sensing.
- Advancements in Engine Technology: The complexity and efficiency demands of modern engines require sophisticated monitoring systems.
- Aftermarket Demand: Replacement needs for aging vehicle fleets provide a consistent revenue stream.
- Focus on Fuel Efficiency: Optimized engine performance through accurate temperature data directly contributes to improved fuel economy.
Key Barriers & Challenges:
- Supply Chain Volatility: Disruptions in raw material availability or manufacturing can impact production and lead times, with potential impacts of 5-10% on delivery schedules during peak disruptions.
- Intense Competition: A crowded market with established players and emerging low-cost manufacturers can lead to price pressures.
- Technological Obsolescence: Rapid advancements in automotive electronics require continuous R&D investment to stay competitive.
- High Certification Costs: Meeting automotive industry standards and OEM specifications involves significant validation and testing expenses, estimated at $500,000 to $2 million per new sensor development.
- Transition to Electric Vehicles: While creating new opportunities, the shift away from internal combustion engines may eventually impact demand for traditional engine temperature sensors.
Emerging Opportunities in Coolant and Oil Temperature Sensor
Emerging opportunities in the Coolant and Oil Temperature Sensor market lie in the development of highly integrated, smart sensors for electrified vehicle powertrains and battery management systems. The growing trend of predictive maintenance in automotive applications presents a significant avenue, where advanced sensors can provide early warnings of potential engine issues. Untapped markets in developing regions with rapidly expanding automotive sectors also offer considerable growth potential. Furthermore, the integration of these sensors with vehicle-to-everything (V2X) communication technologies for enhanced safety and performance is an emerging area of innovation. The demand for robust, high-temperature tolerant sensors for specialized industrial applications beyond automotive is also a promising niche.
Growth Accelerators in the Coolant and Oil Temperature Sensor Industry
Several catalysts are accelerating growth in the Coolant and Oil Temperature Sensor industry. Technological breakthroughs in micro-electromechanical systems (MEMS) technology are enabling the development of smaller, more accurate, and cost-effective sensors. Strategic partnerships between sensor manufacturers and vehicle OEMs are crucial for co-development and ensuring seamless integration of new sensor technologies into vehicle platforms. Market expansion strategies, including targeting emerging economies and developing specialized sensor solutions for niche vehicle segments, are also driving growth. The increasing focus on vehicle diagnostics and the Internet of Things (IoT) in automotive will further propel the demand for connected and intelligent sensor solutions.
Key Players Shaping the Coolant and Oil Temperature Sensor Market
- Delphi
- Continental
- Bosch
- Sensata Technologies
- Denso
- TE Connectivity
- Hella
- Valeo
- Panasonic
- TDK
- Qufu Temb Auto Parts Manufacturing
- Inzi Controls
- Nippon Thermostat
- Hitachi Automotive Systems
- Autoliv
- Hyundai Mobis
- ZF
- NXP
- Bourns
Notable Milestones in Coolant and Oil Temperature Sensor Sector
- 2019: Introduction of advanced ceramic-based temperature sensors offering enhanced durability and accuracy.
- 2020: Increased integration of temperature sensors within complex mechatronic modules for streamlined vehicle assembly.
- 2021: Development of smart temperature sensors with built-in diagnostic capabilities for early fault detection.
- 2022: Significant advancements in miniaturization, allowing for sensor integration into tighter engine spaces.
- 2023: Growing focus on developing temperature sensors specifically designed for the thermal management needs of electric vehicle batteries.
- 2024: Increased adoption of multi-functional sensors capable of monitoring both coolant and oil temperatures simultaneously.
In-Depth Coolant and Oil Temperature Sensor Market Outlook
The future outlook for the Coolant and Oil Temperature Sensor market remains exceptionally positive, driven by continuous innovation and expanding automotive applications. Growth accelerators such as the relentless pursuit of fuel efficiency and emission reduction will ensure sustained demand for sophisticated engine monitoring. The ongoing electrification of vehicles, while posing a long-term shift, concurrently presents new opportunities for advanced thermal management sensors in battery systems and powertrains. Strategic collaborations between sensor providers and automotive giants will continue to drive product development and market penetration. Emerging economies represent significant untapped potential, offering substantial growth opportunities as their automotive industries mature. The integration of these sensors into the broader IoT ecosystem for vehicles will further enhance their value proposition and market reach.
Coolant and Oil Temperature Sensor Segmentation
-
1. Application
- 1.1. Passenger Vehicles
- 1.2. Commercial Vehicles
-
2. Types
- 2.1. Coolant Temperature Sensor
- 2.2. Oil Temperature Sensor
Coolant and Oil Temperature Sensor Segmentation By Geography
-
1. North America
- 1.1. United States
- 1.2. Canada
- 1.3. Mexico
-
2. South America
- 2.1. Brazil
- 2.2. Argentina
- 2.3. Rest of South America
-
3. Europe
- 3.1. United Kingdom
- 3.2. Germany
- 3.3. France
- 3.4. Italy
- 3.5. Spain
- 3.6. Russia
- 3.7. Benelux
- 3.8. Nordics
- 3.9. Rest of Europe
-
4. Middle East & Africa
- 4.1. Turkey
- 4.2. Israel
- 4.3. GCC
- 4.4. North Africa
- 4.5. South Africa
- 4.6. Rest of Middle East & Africa
-
5. Asia Pacific
- 5.1. China
- 5.2. India
- 5.3. Japan
- 5.4. South Korea
- 5.5. ASEAN
- 5.6. Oceania
- 5.7. Rest of Asia Pacific
Coolant and Oil Temperature Sensor REPORT HIGHLIGHTS
| Aspects | Details |
|---|---|
| Study Period | 2019-2033 |
| Base Year | 2024 |
| Estimated Year | 2025 |
| Forecast Period | 2025-2033 |
| Historical Period | 2019-2024 |
| Growth Rate | CAGR of XX% from 2019-2033 |
| Segmentation |
|
Table of Contents
- 1. Introduction
- 1.1. Research Scope
- 1.2. Market Segmentation
- 1.3. Research Methodology
- 1.4. Definitions and Assumptions
- 2. Executive Summary
- 2.1. Introduction
- 3. Market Dynamics
- 3.1. Introduction
- 3.2. Market Drivers
- 3.3. Market Restrains
- 3.4. Market Trends
- 4. Market Factor Analysis
- 4.1. Porters Five Forces
- 4.2. Supply/Value Chain
- 4.3. PESTEL analysis
- 4.4. Market Entropy
- 4.5. Patent/Trademark Analysis
- 5. Global Coolant and Oil Temperature Sensor Analysis, Insights and Forecast, 2019-2031
- 5.1. Market Analysis, Insights and Forecast - by Application
- 5.1.1. Passenger Vehicles
- 5.1.2. Commercial Vehicles
- 5.2. Market Analysis, Insights and Forecast - by Types
- 5.2.1. Coolant Temperature Sensor
- 5.2.2. Oil Temperature Sensor
- 5.3. Market Analysis, Insights and Forecast - by Region
- 5.3.1. North America
- 5.3.2. South America
- 5.3.3. Europe
- 5.3.4. Middle East & Africa
- 5.3.5. Asia Pacific
- 5.1. Market Analysis, Insights and Forecast - by Application
- 6. North America Coolant and Oil Temperature Sensor Analysis, Insights and Forecast, 2019-2031
- 6.1. Market Analysis, Insights and Forecast - by Application
- 6.1.1. Passenger Vehicles
- 6.1.2. Commercial Vehicles
- 6.2. Market Analysis, Insights and Forecast - by Types
- 6.2.1. Coolant Temperature Sensor
- 6.2.2. Oil Temperature Sensor
- 6.1. Market Analysis, Insights and Forecast - by Application
- 7. South America Coolant and Oil Temperature Sensor Analysis, Insights and Forecast, 2019-2031
- 7.1. Market Analysis, Insights and Forecast - by Application
- 7.1.1. Passenger Vehicles
- 7.1.2. Commercial Vehicles
- 7.2. Market Analysis, Insights and Forecast - by Types
- 7.2.1. Coolant Temperature Sensor
- 7.2.2. Oil Temperature Sensor
- 7.1. Market Analysis, Insights and Forecast - by Application
- 8. Europe Coolant and Oil Temperature Sensor Analysis, Insights and Forecast, 2019-2031
- 8.1. Market Analysis, Insights and Forecast - by Application
- 8.1.1. Passenger Vehicles
- 8.1.2. Commercial Vehicles
- 8.2. Market Analysis, Insights and Forecast - by Types
- 8.2.1. Coolant Temperature Sensor
- 8.2.2. Oil Temperature Sensor
- 8.1. Market Analysis, Insights and Forecast - by Application
- 9. Middle East & Africa Coolant and Oil Temperature Sensor Analysis, Insights and Forecast, 2019-2031
- 9.1. Market Analysis, Insights and Forecast - by Application
- 9.1.1. Passenger Vehicles
- 9.1.2. Commercial Vehicles
- 9.2. Market Analysis, Insights and Forecast - by Types
- 9.2.1. Coolant Temperature Sensor
- 9.2.2. Oil Temperature Sensor
- 9.1. Market Analysis, Insights and Forecast - by Application
- 10. Asia Pacific Coolant and Oil Temperature Sensor Analysis, Insights and Forecast, 2019-2031
- 10.1. Market Analysis, Insights and Forecast - by Application
- 10.1.1. Passenger Vehicles
- 10.1.2. Commercial Vehicles
- 10.2. Market Analysis, Insights and Forecast - by Types
- 10.2.1. Coolant Temperature Sensor
- 10.2.2. Oil Temperature Sensor
- 10.1. Market Analysis, Insights and Forecast - by Application
- 11. Competitive Analysis
- 11.1. Global Market Share Analysis 2024
- 11.2. Company Profiles
- 11.2.1 Delphi
- 11.2.1.1. Overview
- 11.2.1.2. Products
- 11.2.1.3. SWOT Analysis
- 11.2.1.4. Recent Developments
- 11.2.1.5. Financials (Based on Availability)
- 11.2.2 Continental
- 11.2.2.1. Overview
- 11.2.2.2. Products
- 11.2.2.3. SWOT Analysis
- 11.2.2.4. Recent Developments
- 11.2.2.5. Financials (Based on Availability)
- 11.2.3 Bosch
- 11.2.3.1. Overview
- 11.2.3.2. Products
- 11.2.3.3. SWOT Analysis
- 11.2.3.4. Recent Developments
- 11.2.3.5. Financials (Based on Availability)
- 11.2.4 Sensata Technologies
- 11.2.4.1. Overview
- 11.2.4.2. Products
- 11.2.4.3. SWOT Analysis
- 11.2.4.4. Recent Developments
- 11.2.4.5. Financials (Based on Availability)
- 11.2.5 Denso
- 11.2.5.1. Overview
- 11.2.5.2. Products
- 11.2.5.3. SWOT Analysis
- 11.2.5.4. Recent Developments
- 11.2.5.5. Financials (Based on Availability)
- 11.2.6 TE Connectivity
- 11.2.6.1. Overview
- 11.2.6.2. Products
- 11.2.6.3. SWOT Analysis
- 11.2.6.4. Recent Developments
- 11.2.6.5. Financials (Based on Availability)
- 11.2.7 Hella
- 11.2.7.1. Overview
- 11.2.7.2. Products
- 11.2.7.3. SWOT Analysis
- 11.2.7.4. Recent Developments
- 11.2.7.5. Financials (Based on Availability)
- 11.2.8 Valeo
- 11.2.8.1. Overview
- 11.2.8.2. Products
- 11.2.8.3. SWOT Analysis
- 11.2.8.4. Recent Developments
- 11.2.8.5. Financials (Based on Availability)
- 11.2.9 Panasonic
- 11.2.9.1. Overview
- 11.2.9.2. Products
- 11.2.9.3. SWOT Analysis
- 11.2.9.4. Recent Developments
- 11.2.9.5. Financials (Based on Availability)
- 11.2.10 TDK
- 11.2.10.1. Overview
- 11.2.10.2. Products
- 11.2.10.3. SWOT Analysis
- 11.2.10.4. Recent Developments
- 11.2.10.5. Financials (Based on Availability)
- 11.2.11 Qufu Temb Auto Parts Manufacturing
- 11.2.11.1. Overview
- 11.2.11.2. Products
- 11.2.11.3. SWOT Analysis
- 11.2.11.4. Recent Developments
- 11.2.11.5. Financials (Based on Availability)
- 11.2.12 Inzi Controls
- 11.2.12.1. Overview
- 11.2.12.2. Products
- 11.2.12.3. SWOT Analysis
- 11.2.12.4. Recent Developments
- 11.2.12.5. Financials (Based on Availability)
- 11.2.13 Nippon Thermostat
- 11.2.13.1. Overview
- 11.2.13.2. Products
- 11.2.13.3. SWOT Analysis
- 11.2.13.4. Recent Developments
- 11.2.13.5. Financials (Based on Availability)
- 11.2.14 Hitachi Automotive Systems
- 11.2.14.1. Overview
- 11.2.14.2. Products
- 11.2.14.3. SWOT Analysis
- 11.2.14.4. Recent Developments
- 11.2.14.5. Financials (Based on Availability)
- 11.2.15 Autoliv
- 11.2.15.1. Overview
- 11.2.15.2. Products
- 11.2.15.3. SWOT Analysis
- 11.2.15.4. Recent Developments
- 11.2.15.5. Financials (Based on Availability)
- 11.2.16 Hyundai Mobis
- 11.2.16.1. Overview
- 11.2.16.2. Products
- 11.2.16.3. SWOT Analysis
- 11.2.16.4. Recent Developments
- 11.2.16.5. Financials (Based on Availability)
- 11.2.17 ZF
- 11.2.17.1. Overview
- 11.2.17.2. Products
- 11.2.17.3. SWOT Analysis
- 11.2.17.4. Recent Developments
- 11.2.17.5. Financials (Based on Availability)
- 11.2.18 NXP
- 11.2.18.1. Overview
- 11.2.18.2. Products
- 11.2.18.3. SWOT Analysis
- 11.2.18.4. Recent Developments
- 11.2.18.5. Financials (Based on Availability)
- 11.2.19 Bourns
- 11.2.19.1. Overview
- 11.2.19.2. Products
- 11.2.19.3. SWOT Analysis
- 11.2.19.4. Recent Developments
- 11.2.19.5. Financials (Based on Availability)
- 11.2.1 Delphi
List of Figures
- Figure 1: Global Coolant and Oil Temperature Sensor Revenue Breakdown (million, %) by Region 2024 & 2032
- Figure 2: Global Coolant and Oil Temperature Sensor Volume Breakdown (K, %) by Region 2024 & 2032
- Figure 3: North America Coolant and Oil Temperature Sensor Revenue (million), by Application 2024 & 2032
- Figure 4: North America Coolant and Oil Temperature Sensor Volume (K), by Application 2024 & 2032
- Figure 5: North America Coolant and Oil Temperature Sensor Revenue Share (%), by Application 2024 & 2032
- Figure 6: North America Coolant and Oil Temperature Sensor Volume Share (%), by Application 2024 & 2032
- Figure 7: North America Coolant and Oil Temperature Sensor Revenue (million), by Types 2024 & 2032
- Figure 8: North America Coolant and Oil Temperature Sensor Volume (K), by Types 2024 & 2032
- Figure 9: North America Coolant and Oil Temperature Sensor Revenue Share (%), by Types 2024 & 2032
- Figure 10: North America Coolant and Oil Temperature Sensor Volume Share (%), by Types 2024 & 2032
- Figure 11: North America Coolant and Oil Temperature Sensor Revenue (million), by Country 2024 & 2032
- Figure 12: North America Coolant and Oil Temperature Sensor Volume (K), by Country 2024 & 2032
- Figure 13: North America Coolant and Oil Temperature Sensor Revenue Share (%), by Country 2024 & 2032
- Figure 14: North America Coolant and Oil Temperature Sensor Volume Share (%), by Country 2024 & 2032
- Figure 15: South America Coolant and Oil Temperature Sensor Revenue (million), by Application 2024 & 2032
- Figure 16: South America Coolant and Oil Temperature Sensor Volume (K), by Application 2024 & 2032
- Figure 17: South America Coolant and Oil Temperature Sensor Revenue Share (%), by Application 2024 & 2032
- Figure 18: South America Coolant and Oil Temperature Sensor Volume Share (%), by Application 2024 & 2032
- Figure 19: South America Coolant and Oil Temperature Sensor Revenue (million), by Types 2024 & 2032
- Figure 20: South America Coolant and Oil Temperature Sensor Volume (K), by Types 2024 & 2032
- Figure 21: South America Coolant and Oil Temperature Sensor Revenue Share (%), by Types 2024 & 2032
- Figure 22: South America Coolant and Oil Temperature Sensor Volume Share (%), by Types 2024 & 2032
- Figure 23: South America Coolant and Oil Temperature Sensor Revenue (million), by Country 2024 & 2032
- Figure 24: South America Coolant and Oil Temperature Sensor Volume (K), by Country 2024 & 2032
- Figure 25: South America Coolant and Oil Temperature Sensor Revenue Share (%), by Country 2024 & 2032
- Figure 26: South America Coolant and Oil Temperature Sensor Volume Share (%), by Country 2024 & 2032
- Figure 27: Europe Coolant and Oil Temperature Sensor Revenue (million), by Application 2024 & 2032
- Figure 28: Europe Coolant and Oil Temperature Sensor Volume (K), by Application 2024 & 2032
- Figure 29: Europe Coolant and Oil Temperature Sensor Revenue Share (%), by Application 2024 & 2032
- Figure 30: Europe Coolant and Oil Temperature Sensor Volume Share (%), by Application 2024 & 2032
- Figure 31: Europe Coolant and Oil Temperature Sensor Revenue (million), by Types 2024 & 2032
- Figure 32: Europe Coolant and Oil Temperature Sensor Volume (K), by Types 2024 & 2032
- Figure 33: Europe Coolant and Oil Temperature Sensor Revenue Share (%), by Types 2024 & 2032
- Figure 34: Europe Coolant and Oil Temperature Sensor Volume Share (%), by Types 2024 & 2032
- Figure 35: Europe Coolant and Oil Temperature Sensor Revenue (million), by Country 2024 & 2032
- Figure 36: Europe Coolant and Oil Temperature Sensor Volume (K), by Country 2024 & 2032
- Figure 37: Europe Coolant and Oil Temperature Sensor Revenue Share (%), by Country 2024 & 2032
- Figure 38: Europe Coolant and Oil Temperature Sensor Volume Share (%), by Country 2024 & 2032
- Figure 39: Middle East & Africa Coolant and Oil Temperature Sensor Revenue (million), by Application 2024 & 2032
- Figure 40: Middle East & Africa Coolant and Oil Temperature Sensor Volume (K), by Application 2024 & 2032
- Figure 41: Middle East & Africa Coolant and Oil Temperature Sensor Revenue Share (%), by Application 2024 & 2032
- Figure 42: Middle East & Africa Coolant and Oil Temperature Sensor Volume Share (%), by Application 2024 & 2032
- Figure 43: Middle East & Africa Coolant and Oil Temperature Sensor Revenue (million), by Types 2024 & 2032
- Figure 44: Middle East & Africa Coolant and Oil Temperature Sensor Volume (K), by Types 2024 & 2032
- Figure 45: Middle East & Africa Coolant and Oil Temperature Sensor Revenue Share (%), by Types 2024 & 2032
- Figure 46: Middle East & Africa Coolant and Oil Temperature Sensor Volume Share (%), by Types 2024 & 2032
- Figure 47: Middle East & Africa Coolant and Oil Temperature Sensor Revenue (million), by Country 2024 & 2032
- Figure 48: Middle East & Africa Coolant and Oil Temperature Sensor Volume (K), by Country 2024 & 2032
- Figure 49: Middle East & Africa Coolant and Oil Temperature Sensor Revenue Share (%), by Country 2024 & 2032
- Figure 50: Middle East & Africa Coolant and Oil Temperature Sensor Volume Share (%), by Country 2024 & 2032
- Figure 51: Asia Pacific Coolant and Oil Temperature Sensor Revenue (million), by Application 2024 & 2032
- Figure 52: Asia Pacific Coolant and Oil Temperature Sensor Volume (K), by Application 2024 & 2032
- Figure 53: Asia Pacific Coolant and Oil Temperature Sensor Revenue Share (%), by Application 2024 & 2032
- Figure 54: Asia Pacific Coolant and Oil Temperature Sensor Volume Share (%), by Application 2024 & 2032
- Figure 55: Asia Pacific Coolant and Oil Temperature Sensor Revenue (million), by Types 2024 & 2032
- Figure 56: Asia Pacific Coolant and Oil Temperature Sensor Volume (K), by Types 2024 & 2032
- Figure 57: Asia Pacific Coolant and Oil Temperature Sensor Revenue Share (%), by Types 2024 & 2032
- Figure 58: Asia Pacific Coolant and Oil Temperature Sensor Volume Share (%), by Types 2024 & 2032
- Figure 59: Asia Pacific Coolant and Oil Temperature Sensor Revenue (million), by Country 2024 & 2032
- Figure 60: Asia Pacific Coolant and Oil Temperature Sensor Volume (K), by Country 2024 & 2032
- Figure 61: Asia Pacific Coolant and Oil Temperature Sensor Revenue Share (%), by Country 2024 & 2032
- Figure 62: Asia Pacific Coolant and Oil Temperature Sensor Volume Share (%), by Country 2024 & 2032
List of Tables
- Table 1: Global Coolant and Oil Temperature Sensor Revenue million Forecast, by Region 2019 & 2032
- Table 2: Global Coolant and Oil Temperature Sensor Volume K Forecast, by Region 2019 & 2032
- Table 3: Global Coolant and Oil Temperature Sensor Revenue million Forecast, by Application 2019 & 2032
- Table 4: Global Coolant and Oil Temperature Sensor Volume K Forecast, by Application 2019 & 2032
- Table 5: Global Coolant and Oil Temperature Sensor Revenue million Forecast, by Types 2019 & 2032
- Table 6: Global Coolant and Oil Temperature Sensor Volume K Forecast, by Types 2019 & 2032
- Table 7: Global Coolant and Oil Temperature Sensor Revenue million Forecast, by Region 2019 & 2032
- Table 8: Global Coolant and Oil Temperature Sensor Volume K Forecast, by Region 2019 & 2032
- Table 9: Global Coolant and Oil Temperature Sensor Revenue million Forecast, by Application 2019 & 2032
- Table 10: Global Coolant and Oil Temperature Sensor Volume K Forecast, by Application 2019 & 2032
- Table 11: Global Coolant and Oil Temperature Sensor Revenue million Forecast, by Types 2019 & 2032
- Table 12: Global Coolant and Oil Temperature Sensor Volume K Forecast, by Types 2019 & 2032
- Table 13: Global Coolant and Oil Temperature Sensor Revenue million Forecast, by Country 2019 & 2032
- Table 14: Global Coolant and Oil Temperature Sensor Volume K Forecast, by Country 2019 & 2032
- Table 15: United States Coolant and Oil Temperature Sensor Revenue (million) Forecast, by Application 2019 & 2032
- Table 16: United States Coolant and Oil Temperature Sensor Volume (K) Forecast, by Application 2019 & 2032
- Table 17: Canada Coolant and Oil Temperature Sensor Revenue (million) Forecast, by Application 2019 & 2032
- Table 18: Canada Coolant and Oil Temperature Sensor Volume (K) Forecast, by Application 2019 & 2032
- Table 19: Mexico Coolant and Oil Temperature Sensor Revenue (million) Forecast, by Application 2019 & 2032
- Table 20: Mexico Coolant and Oil Temperature Sensor Volume (K) Forecast, by Application 2019 & 2032
- Table 21: Global Coolant and Oil Temperature Sensor Revenue million Forecast, by Application 2019 & 2032
- Table 22: Global Coolant and Oil Temperature Sensor Volume K Forecast, by Application 2019 & 2032
- Table 23: Global Coolant and Oil Temperature Sensor Revenue million Forecast, by Types 2019 & 2032
- Table 24: Global Coolant and Oil Temperature Sensor Volume K Forecast, by Types 2019 & 2032
- Table 25: Global Coolant and Oil Temperature Sensor Revenue million Forecast, by Country 2019 & 2032
- Table 26: Global Coolant and Oil Temperature Sensor Volume K Forecast, by Country 2019 & 2032
- Table 27: Brazil Coolant and Oil Temperature Sensor Revenue (million) Forecast, by Application 2019 & 2032
- Table 28: Brazil Coolant and Oil Temperature Sensor Volume (K) Forecast, by Application 2019 & 2032
- Table 29: Argentina Coolant and Oil Temperature Sensor Revenue (million) Forecast, by Application 2019 & 2032
- Table 30: Argentina Coolant and Oil Temperature Sensor Volume (K) Forecast, by Application 2019 & 2032
- Table 31: Rest of South America Coolant and Oil Temperature Sensor Revenue (million) Forecast, by Application 2019 & 2032
- Table 32: Rest of South America Coolant and Oil Temperature Sensor Volume (K) Forecast, by Application 2019 & 2032
- Table 33: Global Coolant and Oil Temperature Sensor Revenue million Forecast, by Application 2019 & 2032
- Table 34: Global Coolant and Oil Temperature Sensor Volume K Forecast, by Application 2019 & 2032
- Table 35: Global Coolant and Oil Temperature Sensor Revenue million Forecast, by Types 2019 & 2032
- Table 36: Global Coolant and Oil Temperature Sensor Volume K Forecast, by Types 2019 & 2032
- Table 37: Global Coolant and Oil Temperature Sensor Revenue million Forecast, by Country 2019 & 2032
- Table 38: Global Coolant and Oil Temperature Sensor Volume K Forecast, by Country 2019 & 2032
- Table 39: United Kingdom Coolant and Oil Temperature Sensor Revenue (million) Forecast, by Application 2019 & 2032
- Table 40: United Kingdom Coolant and Oil Temperature Sensor Volume (K) Forecast, by Application 2019 & 2032
- Table 41: Germany Coolant and Oil Temperature Sensor Revenue (million) Forecast, by Application 2019 & 2032
- Table 42: Germany Coolant and Oil Temperature Sensor Volume (K) Forecast, by Application 2019 & 2032
- Table 43: France Coolant and Oil Temperature Sensor Revenue (million) Forecast, by Application 2019 & 2032
- Table 44: France Coolant and Oil Temperature Sensor Volume (K) Forecast, by Application 2019 & 2032
- Table 45: Italy Coolant and Oil Temperature Sensor Revenue (million) Forecast, by Application 2019 & 2032
- Table 46: Italy Coolant and Oil Temperature Sensor Volume (K) Forecast, by Application 2019 & 2032
- Table 47: Spain Coolant and Oil Temperature Sensor Revenue (million) Forecast, by Application 2019 & 2032
- Table 48: Spain Coolant and Oil Temperature Sensor Volume (K) Forecast, by Application 2019 & 2032
- Table 49: Russia Coolant and Oil Temperature Sensor Revenue (million) Forecast, by Application 2019 & 2032
- Table 50: Russia Coolant and Oil Temperature Sensor Volume (K) Forecast, by Application 2019 & 2032
- Table 51: Benelux Coolant and Oil Temperature Sensor Revenue (million) Forecast, by Application 2019 & 2032
- Table 52: Benelux Coolant and Oil Temperature Sensor Volume (K) Forecast, by Application 2019 & 2032
- Table 53: Nordics Coolant and Oil Temperature Sensor Revenue (million) Forecast, by Application 2019 & 2032
- Table 54: Nordics Coolant and Oil Temperature Sensor Volume (K) Forecast, by Application 2019 & 2032
- Table 55: Rest of Europe Coolant and Oil Temperature Sensor Revenue (million) Forecast, by Application 2019 & 2032
- Table 56: Rest of Europe Coolant and Oil Temperature Sensor Volume (K) Forecast, by Application 2019 & 2032
- Table 57: Global Coolant and Oil Temperature Sensor Revenue million Forecast, by Application 2019 & 2032
- Table 58: Global Coolant and Oil Temperature Sensor Volume K Forecast, by Application 2019 & 2032
- Table 59: Global Coolant and Oil Temperature Sensor Revenue million Forecast, by Types 2019 & 2032
- Table 60: Global Coolant and Oil Temperature Sensor Volume K Forecast, by Types 2019 & 2032
- Table 61: Global Coolant and Oil Temperature Sensor Revenue million Forecast, by Country 2019 & 2032
- Table 62: Global Coolant and Oil Temperature Sensor Volume K Forecast, by Country 2019 & 2032
- Table 63: Turkey Coolant and Oil Temperature Sensor Revenue (million) Forecast, by Application 2019 & 2032
- Table 64: Turkey Coolant and Oil Temperature Sensor Volume (K) Forecast, by Application 2019 & 2032
- Table 65: Israel Coolant and Oil Temperature Sensor Revenue (million) Forecast, by Application 2019 & 2032
- Table 66: Israel Coolant and Oil Temperature Sensor Volume (K) Forecast, by Application 2019 & 2032
- Table 67: GCC Coolant and Oil Temperature Sensor Revenue (million) Forecast, by Application 2019 & 2032
- Table 68: GCC Coolant and Oil Temperature Sensor Volume (K) Forecast, by Application 2019 & 2032
- Table 69: North Africa Coolant and Oil Temperature Sensor Revenue (million) Forecast, by Application 2019 & 2032
- Table 70: North Africa Coolant and Oil Temperature Sensor Volume (K) Forecast, by Application 2019 & 2032
- Table 71: South Africa Coolant and Oil Temperature Sensor Revenue (million) Forecast, by Application 2019 & 2032
- Table 72: South Africa Coolant and Oil Temperature Sensor Volume (K) Forecast, by Application 2019 & 2032
- Table 73: Rest of Middle East & Africa Coolant and Oil Temperature Sensor Revenue (million) Forecast, by Application 2019 & 2032
- Table 74: Rest of Middle East & Africa Coolant and Oil Temperature Sensor Volume (K) Forecast, by Application 2019 & 2032
- Table 75: Global Coolant and Oil Temperature Sensor Revenue million Forecast, by Application 2019 & 2032
- Table 76: Global Coolant and Oil Temperature Sensor Volume K Forecast, by Application 2019 & 2032
- Table 77: Global Coolant and Oil Temperature Sensor Revenue million Forecast, by Types 2019 & 2032
- Table 78: Global Coolant and Oil Temperature Sensor Volume K Forecast, by Types 2019 & 2032
- Table 79: Global Coolant and Oil Temperature Sensor Revenue million Forecast, by Country 2019 & 2032
- Table 80: Global Coolant and Oil Temperature Sensor Volume K Forecast, by Country 2019 & 2032
- Table 81: China Coolant and Oil Temperature Sensor Revenue (million) Forecast, by Application 2019 & 2032
- Table 82: China Coolant and Oil Temperature Sensor Volume (K) Forecast, by Application 2019 & 2032
- Table 83: India Coolant and Oil Temperature Sensor Revenue (million) Forecast, by Application 2019 & 2032
- Table 84: India Coolant and Oil Temperature Sensor Volume (K) Forecast, by Application 2019 & 2032
- Table 85: Japan Coolant and Oil Temperature Sensor Revenue (million) Forecast, by Application 2019 & 2032
- Table 86: Japan Coolant and Oil Temperature Sensor Volume (K) Forecast, by Application 2019 & 2032
- Table 87: South Korea Coolant and Oil Temperature Sensor Revenue (million) Forecast, by Application 2019 & 2032
- Table 88: South Korea Coolant and Oil Temperature Sensor Volume (K) Forecast, by Application 2019 & 2032
- Table 89: ASEAN Coolant and Oil Temperature Sensor Revenue (million) Forecast, by Application 2019 & 2032
- Table 90: ASEAN Coolant and Oil Temperature Sensor Volume (K) Forecast, by Application 2019 & 2032
- Table 91: Oceania Coolant and Oil Temperature Sensor Revenue (million) Forecast, by Application 2019 & 2032
- Table 92: Oceania Coolant and Oil Temperature Sensor Volume (K) Forecast, by Application 2019 & 2032
- Table 93: Rest of Asia Pacific Coolant and Oil Temperature Sensor Revenue (million) Forecast, by Application 2019 & 2032
- Table 94: Rest of Asia Pacific Coolant and Oil Temperature Sensor Volume (K) Forecast, by Application 2019 & 2032
Frequently Asked Questions
1. What is the projected Compound Annual Growth Rate (CAGR) of the Coolant and Oil Temperature Sensor?
The projected CAGR is approximately XX%.
2. Which companies are prominent players in the Coolant and Oil Temperature Sensor?
Key companies in the market include Delphi, Continental, Bosch, Sensata Technologies, Denso, TE Connectivity, Hella, Valeo, Panasonic, TDK, Qufu Temb Auto Parts Manufacturing, Inzi Controls, Nippon Thermostat, Hitachi Automotive Systems, Autoliv, Hyundai Mobis, ZF, NXP, Bourns.
3. What are the main segments of the Coolant and Oil Temperature Sensor?
The market segments include Application, Types.
4. Can you provide details about the market size?
The market size is estimated to be USD XXX million as of 2022.
5. What are some drivers contributing to market growth?
N/A
6. What are the notable trends driving market growth?
N/A
7. Are there any restraints impacting market growth?
N/A
8. Can you provide examples of recent developments in the market?
N/A
9. What pricing options are available for accessing the report?
Pricing options include single-user, multi-user, and enterprise licenses priced at USD 3350.00, USD 5025.00, and USD 6700.00 respectively.
10. Is the market size provided in terms of value or volume?
The market size is provided in terms of value, measured in million and volume, measured in K.
11. Are there any specific market keywords associated with the report?
Yes, the market keyword associated with the report is "Coolant and Oil Temperature Sensor," which aids in identifying and referencing the specific market segment covered.
12. How do I determine which pricing option suits my needs best?
The pricing options vary based on user requirements and access needs. Individual users may opt for single-user licenses, while businesses requiring broader access may choose multi-user or enterprise licenses for cost-effective access to the report.
13. Are there any additional resources or data provided in the Coolant and Oil Temperature Sensor report?
While the report offers comprehensive insights, it's advisable to review the specific contents or supplementary materials provided to ascertain if additional resources or data are available.
14. How can I stay updated on further developments or reports in the Coolant and Oil Temperature Sensor?
To stay informed about further developments, trends, and reports in the Coolant and Oil Temperature Sensor, consider subscribing to industry newsletters, following relevant companies and organizations, or regularly checking reputable industry news sources and publications.
Methodology
Step 1 - Identification of Relevant Samples Size from Population Database


Step 2 - Approaches for Defining Global Market Size (Value, Volume* & Price*)

Note*: In applicable scenarios
Step 3 - Data Sources
Primary Research
- Web Analytics
- Survey Reports
- Research Institute
- Latest Research Reports
- Opinion Leaders
Secondary Research
- Annual Reports
- White Paper
- Latest Press Release
- Industry Association
- Paid Database
- Investor Presentations

Step 4 - Data Triangulation
Involves using different sources of information in order to increase the validity of a study
These sources are likely to be stakeholders in a program - participants, other researchers, program staff, other community members, and so on.
Then we put all data in single framework & apply various statistical tools to find out the dynamic on the market.
During the analysis stage, feedback from the stakeholder groups would be compared to determine areas of agreement as well as areas of divergence


