

Key Insights
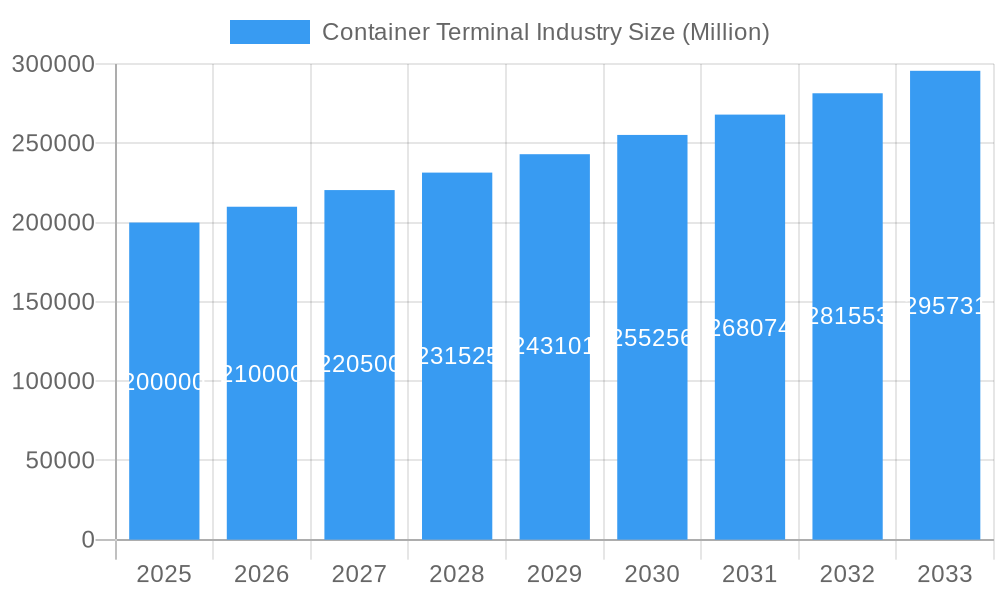
The global container terminal industry, a crucial component of global trade, is experiencing robust growth, projected to maintain a CAGR exceeding 5% from 2025 to 2033. This expansion is fueled by several key drivers. The continuous rise in global e-commerce necessitates efficient port infrastructure and handling capabilities, directly boosting demand for container terminal services. Furthermore, increasing globalization and the resulting surge in international trade volume contribute significantly to market growth. The industry is witnessing a shift towards automation and technological advancements, including improved container tracking systems and automated guided vehicles, leading to enhanced efficiency and reduced operational costs. Finally, strategic investments in port infrastructure development, particularly in emerging economies, are creating new opportunities for expansion and market penetration. Significant players like PSA International, DP World, and APM Terminals are shaping the competitive landscape through strategic acquisitions, technological innovation, and expansion into new markets.
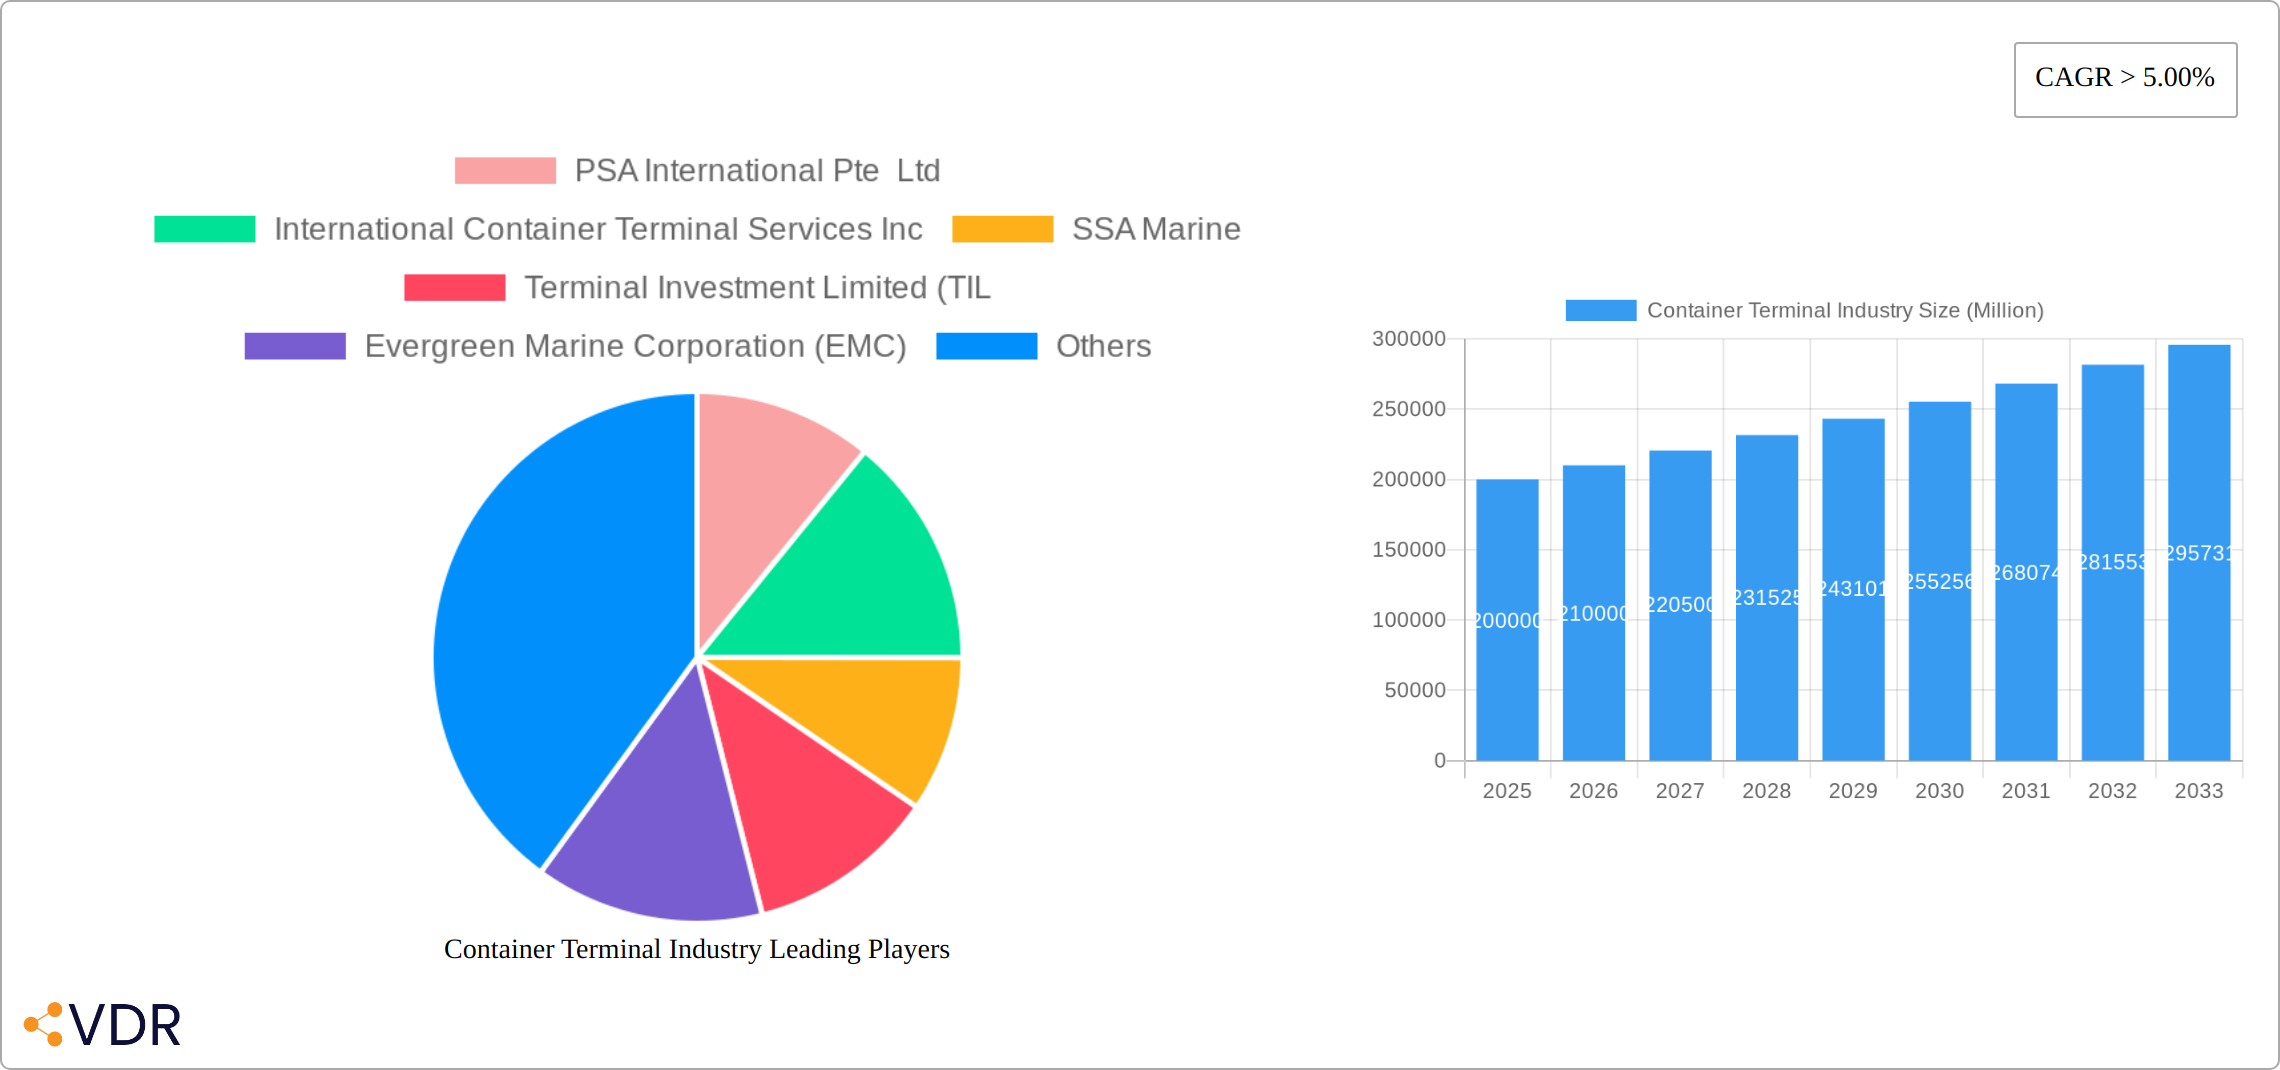
Container Terminal Industry Market Size (In Billion)
However, the industry faces challenges. Geopolitical uncertainties and trade wars can disrupt global trade flows, impacting container throughput. Fluctuations in fuel prices and labor costs also influence operational expenses. Moreover, environmental concerns and the need for sustainable port operations are creating new regulatory pressures and demanding investment in environmentally friendly technologies. Segment-wise, stevedoring and cargo handling services dominate the market, followed by cargo transportation. Among cargo types, crude oil and dry cargo hold substantial shares, with liquid cargo experiencing steady growth. Regionally, Asia-Pacific, driven by China and India’s booming economies, holds the largest market share, followed by North America and Europe. Future growth will be influenced by the successful navigation of geopolitical complexities, technological adaptation, and the effective implementation of sustainable practices within the industry.
Container Terminal Industry Company Market Share
Container Terminal Industry Market Report: 2019-2033
This comprehensive report provides a detailed analysis of the global container terminal industry, encompassing market dynamics, growth trends, key players, and future outlook. With a focus on the parent market of global logistics and the child market of port operations, this report offers invaluable insights for industry professionals, investors, and strategic decision-makers. The study period covers 2019-2033, with a base year of 2025 and a forecast period of 2025-2033. Market values are presented in million units.
Container Terminal Industry Market Dynamics & Structure
The container terminal industry is characterized by a moderately concentrated market structure, with a few dominant players controlling significant market share. The industry is witnessing continuous technological innovation driven by automation, digitization, and data analytics to enhance efficiency and optimize operations. Stringent regulatory frameworks governing safety, security, and environmental compliance shape industry practices. Competition from alternative transportation modes, such as rail and trucking, exerts pressure on market dynamics. The end-user demographics encompass a diverse range of importers, exporters, and freight forwarders across various industries. Mergers and acquisitions (M&A) activity plays a significant role in market consolidation and expansion.
- Market Concentration: The top 5 players hold approximately xx% of the global market share in 2025 (estimated).
- Technological Innovation: Automation (e.g., automated guided vehicles, automated stacking cranes) is driving efficiency gains, while digitalization improves supply chain visibility.
- Regulatory Landscape: International Maritime Organization (IMO) regulations concerning emissions and safety standards impact operational costs and strategies.
- M&A Activity: An estimated xx M&A deals were recorded in the historical period (2019-2024), indicating a trend of consolidation.
- Competitive Substitutes: Rail and trucking are key competitors, especially for shorter distances.
Container Terminal Industry Growth Trends & Insights
The global container terminal industry is poised for significant expansion, projected to achieve a Compound Annual Growth Rate (CAGR) of [Insert Specific CAGR Percentage]% during the forecast period (2025-2033). Market size is estimated at [Insert Specific Market Size in Million Units] in 2025, fueled by the robust growth of global trade, substantial investments in port infrastructure modernization, and the widespread adoption of cutting-edge technologies. This transformation is driven by technological advancements such as autonomous container handling equipment, predictive maintenance through AI, and the integration of blockchain technology for enhanced supply chain transparency. Consumer demand for expedited delivery times and increased supply chain visibility are reshaping industry strategies, pushing for greater efficiency and real-time data integration. Market penetration of automated systems is expected to increase substantially, from [Insert Specific Percentage]% in 2025 to [Insert Specific Percentage]% by 2033, reflecting the industry's commitment to automation and optimization.
Dominant Regions, Countries, or Segments in Container Terminal Industry
Asia, particularly China, remains the dominant region in the container terminal industry, driven by strong economic growth, expanding manufacturing, and significant investments in port infrastructure. Within service segments, Stevedoring and Cargo Handling & Transportation account for the largest share, while by cargo type, Dry Cargo dominates.
- Key Drivers in Asia: Rapid industrialization, burgeoning e-commerce, and government initiatives promoting port development.
- Stevedoring & Cargo Handling Dominance: These segments represent the core operational activities of container terminals, commanding the largest revenue streams.
- Dry Cargo's Leading Role: This segment benefits from the high volume of manufactured goods traded globally.
- Regional Growth Potential: Africa and Latin America present significant growth opportunities due to developing economies and infrastructure improvements.
Container Terminal Industry Product Landscape
Modern container terminals provide a comprehensive suite of services, encompassing stevedoring, efficient cargo handling, secure storage solutions, and a range of value-added services tailored to specific client needs. Technological advancements are revolutionizing operations, with automated systems, real-time tracking capabilities, and sophisticated data analytics driving optimized workflows and improved overall efficiency. Leading terminals are differentiating themselves through unique selling propositions emphasizing speed, reliability, and advanced technological capabilities, including seamless digital integration with shippers and logistics partners.
Key Drivers, Barriers & Challenges in Container Terminal Industry
Key Drivers:
- Exponential growth in global trade volumes driven by e-commerce and globalization.
- Significant investments in modernizing port infrastructure to handle larger vessels and increased cargo volumes.
- Rapid technological advancements, including automation, digitization, and the Internet of Things (IoT) for enhanced operational efficiency and reduced costs.
- Government initiatives and public-private partnerships fostering sustainable port development and promoting trade.
- Increasing demand for efficient and transparent supply chains.
Challenges & Restraints:
- Potential for supply chain disruptions due to geopolitical instability, unforeseen events, and port congestion.
- Stringent environmental regulations aimed at minimizing emissions and promoting sustainable practices.
- Intense competition among existing players and the emergence of alternative transportation modes.
- High capital expenditures required for infrastructure upgrades, technology implementations, and adherence to environmental regulations.
- Cybersecurity threats and the need for robust data protection measures.
Emerging Opportunities in Container Terminal Industry
- Expansion into developing markets with growing trade volumes
- Development of specialized terminals for specific cargo types (e.g., refrigerated containers, hazardous materials)
- Integration of blockchain technology for enhanced supply chain transparency and security
- Leveraging data analytics to optimize operations and improve customer service
Growth Accelerators in the Container Terminal Industry
The continued growth of global trade, coupled with investments in technological advancements and strategic partnerships, will drive long-term expansion in the container terminal industry. Expansion into new markets and the adoption of sustainable practices will further fuel growth.
Key Players Shaping the Container Terminal Industry Market
- PSA International Pte Ltd
- International Container Terminal Services Inc
- SSA Marine
- Terminal Investment Limited (TIL)
- Evergreen Marine Corporation (EMC)
- Hutchison Port Holdings Trust
- APM Terminals Management BV
- Dubai Ports World (DPW)
- DP World PLC
- China Merchants Port Holdings Co Ltd
- Eurogate Container Terminal Ltd
- AP Moller Maersk
Notable Milestones in Container Terminal Industry Sector
- June 2022: AP Moller Maersk launched 'Maersk Coastal Connect' in New Zealand, boosting capacity by 250,000 TEU annually.
- June 2022: TecPlata S.A. (ICTSI) established a new weekly service between La Plata and Montevideo ports, expanding its reach in the Gulf Region, U.S. East Coast, Mediterranean and Northern Europe.
In-Depth Container Terminal Industry Market Outlook
The container terminal industry presents a compelling investment opportunity, with substantial growth prospects driven by the ongoing expansion of globalization, rapid technological advancements, and strategic infrastructure investments. Success in this dynamic market will hinge on companies' ability to adapt to evolving market conditions, embrace innovative technologies, prioritize sustainability initiatives, and cultivate strong customer relationships. The market is poised for sustained expansion throughout the forecast period, fueled by the continuous increase in global trade and the development of new infrastructure in emerging markets. The focus on efficiency, sustainability, and digitalization will be key differentiators for leading players.
Container Terminal Industry Segmentation
-
1. Service
- 1.1. Stevedoring
- 1.2. Cargo Handling & Transportation
- 1.3. Others
-
2. Cargo Type
- 2.1. Crude Oil
- 2.2. Dry Cargo
- 2.3. Other Liquid Cargo
Container Terminal Industry Segmentation By Geography
-
1. North America
- 1.1. US
- 1.2. Canada
- 1.3. Mexico
-
2. Europe
- 2.1. Germany
- 2.2. UK
- 2.3. France
- 2.4. Russia
- 2.5. Spain
- 2.6. Rest of Europe
-
3. Asia Pacific
- 3.1. India
- 3.2. China
- 3.3. Japan
- 3.4. Singapore
- 3.5. Malaysia
- 3.6. South Korea
- 3.7. Australia
- 3.8. Rest Of Asia Pacific
-
4. South America
- 4.1. Brazil
- 4.2. Argentina
- 4.3. Rest of South America
- 5. Middle East
-
6. UAE
- 6.1. Saudi Arabia
- 6.2. South Africa
- 6.3. Rest of Middle East
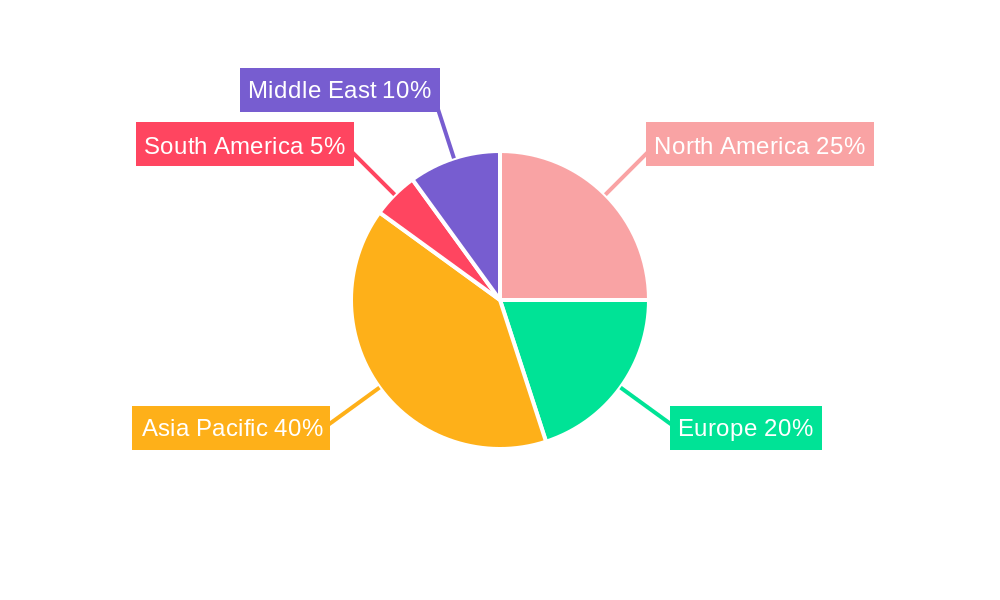
Container Terminal Industry Regional Market Share
Geographic Coverage of Container Terminal Industry
Container Terminal Industry REPORT HIGHLIGHTS
| Aspects | Details |
|---|---|
| Study Period | 2020-2034 |
| Base Year | 2025 |
| Estimated Year | 2026 |
| Forecast Period | 2026-2034 |
| Historical Period | 2020-2025 |
| Growth Rate | CAGR of 8.4% from 2020-2034 |
| Segmentation |
|
Table of Contents
- 1. Introduction
- 1.1. Research Scope
- 1.2. Market Segmentation
- 1.3. Research Objective
- 1.4. Definitions and Assumptions
- 2. Executive Summary
- 2.1. Market Snapshot
- 3. Market Dynamics
- 3.1. Market Drivers
- 3.2. Market Restrains
- 3.3. Market Trends
- 3.4. Market Opportunities
- 4. Market Factor Analysis
- 4.1. Porters Five Forces
- 4.1.1. Bargaining Power of Suppliers
- 4.1.2. Bargaining Power of Buyers
- 4.1.3. Threat of New Entrants
- 4.1.4. Threat of Substitutes
- 4.1.5. Competitive Rivalry
- 4.2. PESTEL analysis
- 4.3. BCG Analysis
- 4.3.1. Stars (High Growth, High Market Share)
- 4.3.2. Cash Cows (Low Growth, High Market Share)
- 4.3.3. Question Mark (High Growth, Low Market Share)
- 4.3.4. Dogs (Low Growth, Low Market Share)
- 4.4. Ansoff Matrix Analysis
- 4.5. Supply Chain Analysis
- 4.6. Regulatory Landscape
- 4.7. Current Market Potential and Opportunity Assessment (TAM–SAM–SOM Framework)
- 4.8. VDR Analyst Note
- 4.1. Porters Five Forces
- 5. Market Analysis, Insights and Forecast 2021-2033
- 5.1. Market Analysis, Insights and Forecast - by Service
- 5.1.1. Stevedoring
- 5.1.2. Cargo Handling & Transportation
- 5.1.3. Others
- 5.2. Market Analysis, Insights and Forecast - by Cargo Type
- 5.2.1. Crude Oil
- 5.2.2. Dry Cargo
- 5.2.3. Other Liquid Cargo
- 5.3. Market Analysis, Insights and Forecast - by Region
- 5.3.1. North America
- 5.3.2. Europe
- 5.3.3. Asia Pacific
- 5.3.4. South America
- 5.3.5. Middle East
- 5.3.6. UAE
- 5.1. Market Analysis, Insights and Forecast - by Service
- 6. Global Container Terminal Industry Analysis, Insights and Forecast, 2021-2033
- 6.1. Market Analysis, Insights and Forecast - by Service
- 6.1.1. Stevedoring
- 6.1.2. Cargo Handling & Transportation
- 6.1.3. Others
- 6.2. Market Analysis, Insights and Forecast - by Cargo Type
- 6.2.1. Crude Oil
- 6.2.2. Dry Cargo
- 6.2.3. Other Liquid Cargo
- 6.1. Market Analysis, Insights and Forecast - by Service
- 7. North America Container Terminal Industry Analysis, Insights and Forecast, 2021-2033
- 7.1. Market Analysis, Insights and Forecast - by Service
- 7.1.1. Stevedoring
- 7.1.2. Cargo Handling & Transportation
- 7.1.3. Others
- 7.2. Market Analysis, Insights and Forecast - by Cargo Type
- 7.2.1. Crude Oil
- 7.2.2. Dry Cargo
- 7.2.3. Other Liquid Cargo
- 7.1. Market Analysis, Insights and Forecast - by Service
- 8. Europe Container Terminal Industry Analysis, Insights and Forecast, 2021-2033
- 8.1. Market Analysis, Insights and Forecast - by Service
- 8.1.1. Stevedoring
- 8.1.2. Cargo Handling & Transportation
- 8.1.3. Others
- 8.2. Market Analysis, Insights and Forecast - by Cargo Type
- 8.2.1. Crude Oil
- 8.2.2. Dry Cargo
- 8.2.3. Other Liquid Cargo
- 8.1. Market Analysis, Insights and Forecast - by Service
- 9. Asia Pacific Container Terminal Industry Analysis, Insights and Forecast, 2021-2033
- 9.1. Market Analysis, Insights and Forecast - by Service
- 9.1.1. Stevedoring
- 9.1.2. Cargo Handling & Transportation
- 9.1.3. Others
- 9.2. Market Analysis, Insights and Forecast - by Cargo Type
- 9.2.1. Crude Oil
- 9.2.2. Dry Cargo
- 9.2.3. Other Liquid Cargo
- 9.1. Market Analysis, Insights and Forecast - by Service
- 10. South America Container Terminal Industry Analysis, Insights and Forecast, 2021-2033
- 10.1. Market Analysis, Insights and Forecast - by Service
- 10.1.1. Stevedoring
- 10.1.2. Cargo Handling & Transportation
- 10.1.3. Others
- 10.2. Market Analysis, Insights and Forecast - by Cargo Type
- 10.2.1. Crude Oil
- 10.2.2. Dry Cargo
- 10.2.3. Other Liquid Cargo
- 10.1. Market Analysis, Insights and Forecast - by Service
- 11. Middle East Container Terminal Industry Analysis, Insights and Forecast, 2021-2033
- 11.1. Market Analysis, Insights and Forecast - by Service
- 11.1.1. Stevedoring
- 11.1.2. Cargo Handling & Transportation
- 11.1.3. Others
- 11.2. Market Analysis, Insights and Forecast - by Cargo Type
- 11.2.1. Crude Oil
- 11.2.2. Dry Cargo
- 11.2.3. Other Liquid Cargo
- 11.1. Market Analysis, Insights and Forecast - by Service
- 12. UAE Container Terminal Industry Analysis, Insights and Forecast, 2021-2033
- 12.1. Market Analysis, Insights and Forecast - by Service
- 12.1.1. Stevedoring
- 12.1.2. Cargo Handling & Transportation
- 12.1.3. Others
- 12.2. Market Analysis, Insights and Forecast - by Cargo Type
- 12.2.1. Crude Oil
- 12.2.2. Dry Cargo
- 12.2.3. Other Liquid Cargo
- 12.1. Market Analysis, Insights and Forecast - by Service
- 13. Competitive Analysis
- 13.1. Company Profiles
- 13.1.1 PSA International Pte Ltd
- 13.1.1.1. Company Overview
- 13.1.1.2. Products
- 13.1.1.3. Company Financials
- 13.1.1.4. SWOT Analysis
- 13.1.2 International Container Terminal Services Inc
- 13.1.2.1. Company Overview
- 13.1.2.2. Products
- 13.1.2.3. Company Financials
- 13.1.2.4. SWOT Analysis
- 13.1.3 SSA Marine
- 13.1.3.1. Company Overview
- 13.1.3.2. Products
- 13.1.3.3. Company Financials
- 13.1.3.4. SWOT Analysis
- 13.1.4 Terminal Investment Limited (TIL
- 13.1.4.1. Company Overview
- 13.1.4.2. Products
- 13.1.4.3. Company Financials
- 13.1.4.4. SWOT Analysis
- 13.1.5 Evergreen Marine Corporation (EMC)
- 13.1.5.1. Company Overview
- 13.1.5.2. Products
- 13.1.5.3. Company Financials
- 13.1.5.4. SWOT Analysis
- 13.1.6 Hutchison Port Holdings Trust
- 13.1.6.1. Company Overview
- 13.1.6.2. Products
- 13.1.6.3. Company Financials
- 13.1.6.4. SWOT Analysis
- 13.1.7 APM Terminals Management BV**List Not Exhaustive
- 13.1.7.1. Company Overview
- 13.1.7.2. Products
- 13.1.7.3. Company Financials
- 13.1.7.4. SWOT Analysis
- 13.1.8 Dubai Ports World (DPW)
- 13.1.8.1. Company Overview
- 13.1.8.2. Products
- 13.1.8.3. Company Financials
- 13.1.8.4. SWOT Analysis
- 13.1.9 DP World PLC
- 13.1.9.1. Company Overview
- 13.1.9.2. Products
- 13.1.9.3. Company Financials
- 13.1.9.4. SWOT Analysis
- 13.1.10 China Merchants Port Holdings Co Ltd
- 13.1.10.1. Company Overview
- 13.1.10.2. Products
- 13.1.10.3. Company Financials
- 13.1.10.4. SWOT Analysis
- 13.1.11 Eurogate Container Terminal Ltd
- 13.1.11.1. Company Overview
- 13.1.11.2. Products
- 13.1.11.3. Company Financials
- 13.1.11.4. SWOT Analysis
- 13.1.12 AP Moller Maersk
- 13.1.12.1. Company Overview
- 13.1.12.2. Products
- 13.1.12.3. Company Financials
- 13.1.12.4. SWOT Analysis
- 13.1.1 PSA International Pte Ltd
- 13.2. Market Entropy
- 13.2.1 Company's Key Areas Served
- 13.2.2 Recent Developments
- 13.3. Company Market Share Analysis 2025
- 13.3.1 Top 5 Companies Market Share Analysis
- 13.3.2 Top 3 Companies Market Share Analysis
- 13.4. List of Potential Customers
- 14. Research Methodology
List of Figures
- Figure 1: Global Container Terminal Industry Revenue Breakdown (million, %) by Region 2025 & 2033
- Figure 2: North America Container Terminal Industry Revenue (million), by Service 2025 & 2033
- Figure 3: North America Container Terminal Industry Revenue Share (%), by Service 2025 & 2033
- Figure 4: North America Container Terminal Industry Revenue (million), by Cargo Type 2025 & 2033
- Figure 5: North America Container Terminal Industry Revenue Share (%), by Cargo Type 2025 & 2033
- Figure 6: North America Container Terminal Industry Revenue (million), by Country 2025 & 2033
- Figure 7: North America Container Terminal Industry Revenue Share (%), by Country 2025 & 2033
- Figure 8: Europe Container Terminal Industry Revenue (million), by Service 2025 & 2033
- Figure 9: Europe Container Terminal Industry Revenue Share (%), by Service 2025 & 2033
- Figure 10: Europe Container Terminal Industry Revenue (million), by Cargo Type 2025 & 2033
- Figure 11: Europe Container Terminal Industry Revenue Share (%), by Cargo Type 2025 & 2033
- Figure 12: Europe Container Terminal Industry Revenue (million), by Country 2025 & 2033
- Figure 13: Europe Container Terminal Industry Revenue Share (%), by Country 2025 & 2033
- Figure 14: Asia Pacific Container Terminal Industry Revenue (million), by Service 2025 & 2033
- Figure 15: Asia Pacific Container Terminal Industry Revenue Share (%), by Service 2025 & 2033
- Figure 16: Asia Pacific Container Terminal Industry Revenue (million), by Cargo Type 2025 & 2033
- Figure 17: Asia Pacific Container Terminal Industry Revenue Share (%), by Cargo Type 2025 & 2033
- Figure 18: Asia Pacific Container Terminal Industry Revenue (million), by Country 2025 & 2033
- Figure 19: Asia Pacific Container Terminal Industry Revenue Share (%), by Country 2025 & 2033
- Figure 20: South America Container Terminal Industry Revenue (million), by Service 2025 & 2033
- Figure 21: South America Container Terminal Industry Revenue Share (%), by Service 2025 & 2033
- Figure 22: South America Container Terminal Industry Revenue (million), by Cargo Type 2025 & 2033
- Figure 23: South America Container Terminal Industry Revenue Share (%), by Cargo Type 2025 & 2033
- Figure 24: South America Container Terminal Industry Revenue (million), by Country 2025 & 2033
- Figure 25: South America Container Terminal Industry Revenue Share (%), by Country 2025 & 2033
- Figure 26: Middle East Container Terminal Industry Revenue (million), by Service 2025 & 2033
- Figure 27: Middle East Container Terminal Industry Revenue Share (%), by Service 2025 & 2033
- Figure 28: Middle East Container Terminal Industry Revenue (million), by Cargo Type 2025 & 2033
- Figure 29: Middle East Container Terminal Industry Revenue Share (%), by Cargo Type 2025 & 2033
- Figure 30: Middle East Container Terminal Industry Revenue (million), by Country 2025 & 2033
- Figure 31: Middle East Container Terminal Industry Revenue Share (%), by Country 2025 & 2033
- Figure 32: UAE Container Terminal Industry Revenue (million), by Service 2025 & 2033
- Figure 33: UAE Container Terminal Industry Revenue Share (%), by Service 2025 & 2033
- Figure 34: UAE Container Terminal Industry Revenue (million), by Cargo Type 2025 & 2033
- Figure 35: UAE Container Terminal Industry Revenue Share (%), by Cargo Type 2025 & 2033
- Figure 36: UAE Container Terminal Industry Revenue (million), by Country 2025 & 2033
- Figure 37: UAE Container Terminal Industry Revenue Share (%), by Country 2025 & 2033
List of Tables
- Table 1: Global Container Terminal Industry Revenue million Forecast, by Service 2020 & 2033
- Table 2: Global Container Terminal Industry Revenue million Forecast, by Cargo Type 2020 & 2033
- Table 3: Global Container Terminal Industry Revenue million Forecast, by Region 2020 & 2033
- Table 4: Global Container Terminal Industry Revenue million Forecast, by Service 2020 & 2033
- Table 5: Global Container Terminal Industry Revenue million Forecast, by Cargo Type 2020 & 2033
- Table 6: Global Container Terminal Industry Revenue million Forecast, by Country 2020 & 2033
- Table 7: US Container Terminal Industry Revenue (million) Forecast, by Application 2020 & 2033
- Table 8: Canada Container Terminal Industry Revenue (million) Forecast, by Application 2020 & 2033
- Table 9: Mexico Container Terminal Industry Revenue (million) Forecast, by Application 2020 & 2033
- Table 10: Global Container Terminal Industry Revenue million Forecast, by Service 2020 & 2033
- Table 11: Global Container Terminal Industry Revenue million Forecast, by Cargo Type 2020 & 2033
- Table 12: Global Container Terminal Industry Revenue million Forecast, by Country 2020 & 2033
- Table 13: Germany Container Terminal Industry Revenue (million) Forecast, by Application 2020 & 2033
- Table 14: UK Container Terminal Industry Revenue (million) Forecast, by Application 2020 & 2033
- Table 15: France Container Terminal Industry Revenue (million) Forecast, by Application 2020 & 2033
- Table 16: Russia Container Terminal Industry Revenue (million) Forecast, by Application 2020 & 2033
- Table 17: Spain Container Terminal Industry Revenue (million) Forecast, by Application 2020 & 2033
- Table 18: Rest of Europe Container Terminal Industry Revenue (million) Forecast, by Application 2020 & 2033
- Table 19: Global Container Terminal Industry Revenue million Forecast, by Service 2020 & 2033
- Table 20: Global Container Terminal Industry Revenue million Forecast, by Cargo Type 2020 & 2033
- Table 21: Global Container Terminal Industry Revenue million Forecast, by Country 2020 & 2033
- Table 22: India Container Terminal Industry Revenue (million) Forecast, by Application 2020 & 2033
- Table 23: China Container Terminal Industry Revenue (million) Forecast, by Application 2020 & 2033
- Table 24: Japan Container Terminal Industry Revenue (million) Forecast, by Application 2020 & 2033
- Table 25: Singapore Container Terminal Industry Revenue (million) Forecast, by Application 2020 & 2033
- Table 26: Malaysia Container Terminal Industry Revenue (million) Forecast, by Application 2020 & 2033
- Table 27: South Korea Container Terminal Industry Revenue (million) Forecast, by Application 2020 & 2033
- Table 28: Australia Container Terminal Industry Revenue (million) Forecast, by Application 2020 & 2033
- Table 29: Rest Of Asia Pacific Container Terminal Industry Revenue (million) Forecast, by Application 2020 & 2033
- Table 30: Global Container Terminal Industry Revenue million Forecast, by Service 2020 & 2033
- Table 31: Global Container Terminal Industry Revenue million Forecast, by Cargo Type 2020 & 2033
- Table 32: Global Container Terminal Industry Revenue million Forecast, by Country 2020 & 2033
- Table 33: Brazil Container Terminal Industry Revenue (million) Forecast, by Application 2020 & 2033
- Table 34: Argentina Container Terminal Industry Revenue (million) Forecast, by Application 2020 & 2033
- Table 35: Rest of South America Container Terminal Industry Revenue (million) Forecast, by Application 2020 & 2033
- Table 36: Global Container Terminal Industry Revenue million Forecast, by Service 2020 & 2033
- Table 37: Global Container Terminal Industry Revenue million Forecast, by Cargo Type 2020 & 2033
- Table 38: Global Container Terminal Industry Revenue million Forecast, by Country 2020 & 2033
- Table 39: Global Container Terminal Industry Revenue million Forecast, by Service 2020 & 2033
- Table 40: Global Container Terminal Industry Revenue million Forecast, by Cargo Type 2020 & 2033
- Table 41: Global Container Terminal Industry Revenue million Forecast, by Country 2020 & 2033
- Table 42: Saudi Arabia Container Terminal Industry Revenue (million) Forecast, by Application 2020 & 2033
- Table 43: South Africa Container Terminal Industry Revenue (million) Forecast, by Application 2020 & 2033
- Table 44: Rest of Middle East Container Terminal Industry Revenue (million) Forecast, by Application 2020 & 2033
Frequently Asked Questions
1. What is the projected Compound Annual Growth Rate (CAGR) of the Container Terminal Industry?
The projected CAGR is approximately 8.4%.
2. Which companies are prominent players in the Container Terminal Industry?
Key companies in the market include PSA International Pte Ltd, International Container Terminal Services Inc, SSA Marine, Terminal Investment Limited (TIL, Evergreen Marine Corporation (EMC), Hutchison Port Holdings Trust, APM Terminals Management BV**List Not Exhaustive, Dubai Ports World (DPW), DP World PLC, China Merchants Port Holdings Co Ltd, Eurogate Container Terminal Ltd, AP Moller Maersk.
3. What are the main segments of the Container Terminal Industry?
The market segments include Service, Cargo Type.
4. Can you provide details about the market size?
The market size is estimated to be USD 1793.8 million as of 2022.
5. What are some drivers contributing to market growth?
Increase in global trade activites; Increase in infrastrustrure and construction.
6. What are the notable trends driving market growth?
Rise in Container Seaborne Trade is a Major Driver.
7. Are there any restraints impacting market growth?
Long distances and sometimes difficult terrain can contribute to increased transportation costs.
8. Can you provide examples of recent developments in the market?
On 15 June 2022, One of the leading player, AP Mollar Maersk announced it's expansion in New Zealand. Maersk is launching a new dedicated New Zealand coastal service - 'Maersk Coastal Connect', to enable a more resilient New Zealand supply chain and improve vessel schedule reliability. By deploying two 2,500 TEU container vessels, Maersk Nadi and Maersk Nansha on a weekly basis, five main ports in New Zealand, namely Timaru, Lyttelton, Nelson, Auckland and Tauranga will be called respectively in the service rotation, enhancing connectivity and providing easy access to Maersk's global network. The combined North to South and South to North capacity will reach 250,000 TEU each year. Maersk Coastal Connect will start on the 12th of July 2022. The service will be operated with New Zealand crew to support the local community and ensure continued to investment in New Zealand.
9. What pricing options are available for accessing the report?
Pricing options include single-user, multi-user, and enterprise licenses priced at USD 4750, USD 5250, and USD 8750 respectively.
10. Is the market size provided in terms of value or volume?
The market size is provided in terms of value, measured in million.
11. Are there any specific market keywords associated with the report?
Yes, the market keyword associated with the report is "Container Terminal Industry," which aids in identifying and referencing the specific market segment covered.
12. How do I determine which pricing option suits my needs best?
The pricing options vary based on user requirements and access needs. Individual users may opt for single-user licenses, while businesses requiring broader access may choose multi-user or enterprise licenses for cost-effective access to the report.
13. Are there any additional resources or data provided in the Container Terminal Industry report?
While the report offers comprehensive insights, it's advisable to review the specific contents or supplementary materials provided to ascertain if additional resources or data are available.
14. How can I stay updated on further developments or reports in the Container Terminal Industry?
To stay informed about further developments, trends, and reports in the Container Terminal Industry, consider subscribing to industry newsletters, following relevant companies and organizations, or regularly checking reputable industry news sources and publications.
Methodology
Step 1 - Identification of Relevant Samples Size from Population Database


Step 2 - Approaches for Defining Global Market Size (Value, Volume* & Price*)

Note*: In applicable scenarios
Step 3 - Data Sources
Primary Research
- Web Analytics
- Survey Reports
- Research Institute
- Latest Research Reports
- Opinion Leaders
Secondary Research
- Annual Reports
- White Paper
- Latest Press Release
- Industry Association
- Paid Database
- Investor Presentations

Step 4 - Data Triangulation
Involves using different sources of information in order to increase the validity of a study
These sources are likely to be stakeholders in a program - participants, other researchers, program staff, other community members, and so on.
Then we put all data in single framework & apply various statistical tools to find out the dynamic on the market.
During the analysis stage, feedback from the stakeholder groups would be compared to determine areas of agreement as well as areas of divergence