

Key Insights
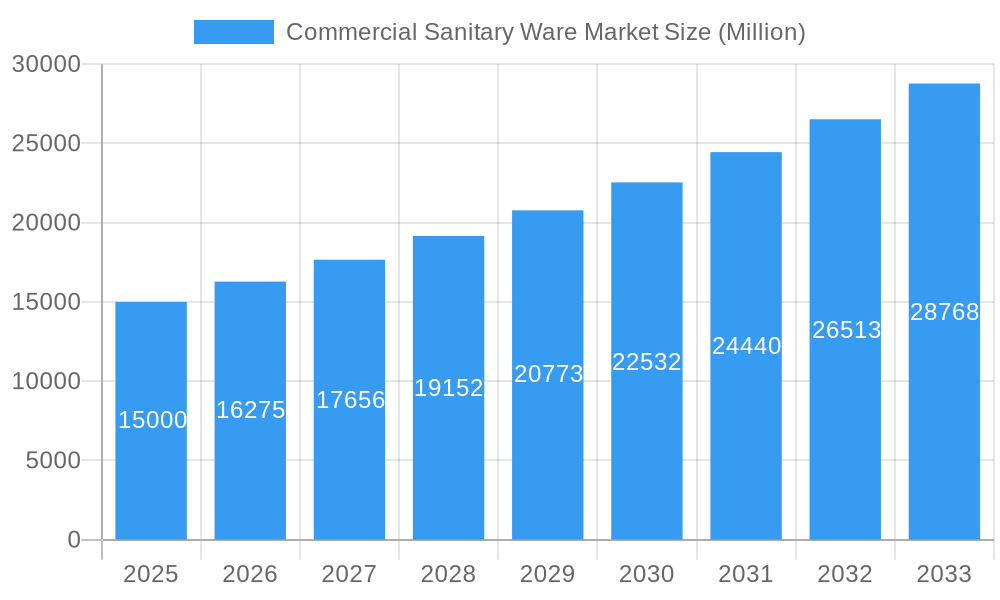
The global commercial sanitary ware market is poised for significant expansion, driven by escalating construction activities, particularly in burgeoning economies, and a heightened demand for hygienic, sustainable solutions in commercial environments. Projections indicate a robust Compound Annual Growth Rate (CAGR) of 7.2%, with the market anticipated to reach 32.47 billion by 2025. Key growth catalysts include increasing urbanization, rising disposable incomes, and a heightened emphasis on sanitation standards across sectors such as hospitality, healthcare, and corporate offices. Innovations in manufacturing technologies are enabling the production of durable, aesthetically appealing, and water-efficient sanitary ware, further propelling market growth. While ceramic wash closets and basins remain dominant, demand for specialized products like urinals is on the rise. North America and Europe currently lead market share, with Asia-Pacific projected for accelerated growth due to rapid infrastructure development and urbanization in China and India. Intense competition among established brands and emerging players is fostering product innovation and strategic pricing.
Commercial Sanitary Ware Market Market Size (In Billion)
Market growth is tempered by challenges such as volatile raw material costs, economic fluctuations impacting construction, and stringent environmental regulations concerning water usage and waste management.
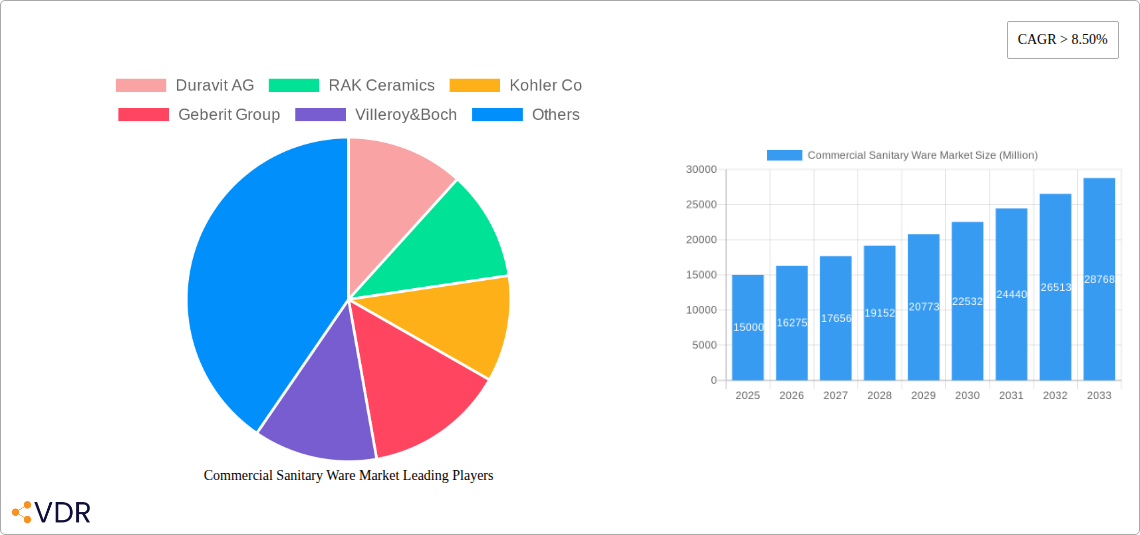
Commercial Sanitary Ware Market Company Market Share
The competitive arena features both multinational corporations and regional manufacturers. Leading brands capitalize on brand equity and extensive distribution, while smaller entities target niche markets with specialized products. A discernible trend towards sustainable and smart sanitary ware, incorporating water-saving features and sensor technology, is evident, driven by environmental consciousness and resource efficiency imperatives. Future market trajectory will be shaped by sustained infrastructure development, technological advancements enhancing product functionality and design, and the widespread adoption of sustainable manufacturing and supply chain practices. Government initiatives promoting green building standards and water conservation will significantly influence market dynamics. Comprehensive segmentation by technology, end-user, and product type offers diverse avenues for strategic market penetration and targeted marketing efforts. Regional market variations necessitate localized strategies to address specific consumer preferences and regulatory landscapes.
Commercial Sanitary Ware Market: A Comprehensive Market Research Report (2019-2033)
This comprehensive report provides an in-depth analysis of the global Commercial Sanitary Ware Market, encompassing market dynamics, growth trends, regional performance, competitive landscape, and future outlook. The study covers the period from 2019 to 2033, with 2025 serving as the base year. The report segments the market by technology (Slip Casting, Tape Casting, Pressure Casting, Others), end-user (Residential, Commercial), and product type (Ceramic Wash Closets, Ceramic Wash Basins, Ceramic Cisterns, Urinals, Others), offering granular insights into each segment's contribution to the overall market value, predicted to reach xx Million units by 2033.
Commercial Sanitary Ware Market Dynamics & Structure
The Commercial Sanitary Ware Market is characterized by a moderately concentrated landscape, with key players like Duravit AG, RAK Ceramics, Kohler Co, and Geberit Group holding significant market share. Market concentration is further influenced by mergers and acquisitions (M&A) activity, with xx M&A deals recorded between 2019 and 2024. Technological innovation, particularly in water-saving technologies and smart sanitary ware, is a major driver. Stringent regulatory frameworks concerning water conservation and hygiene standards in commercial spaces also significantly impact market growth. Competitive pressure from substitute products, such as composite materials, remains a factor.
- Market Concentration: Moderately concentrated, with top 5 players holding approximately xx% market share in 2024.
- Technological Innovation: Focus on water efficiency, smart features, and sustainable materials.
- Regulatory Landscape: Stringent regulations drive adoption of water-saving technologies.
- Competitive Substitutes: Growing competition from composite and other material-based sanitary ware.
- M&A Activity: xx M&A deals between 2019 and 2024, resulting in market consolidation.
- End-User Demographics: Increasing urbanization and commercial construction activity fuels demand.
Commercial Sanitary Ware Market Growth Trends & Insights
The Commercial Sanitary Ware Market experienced robust growth during the historical period (2019-2024), expanding at a Compound Annual Growth Rate (CAGR) of xx%. This growth is attributed to several factors, including rising urbanization, increasing commercial construction activities globally, and growing preference for improved hygiene and water conservation. The market penetration rate for advanced sanitary ware technologies like smart toilets and sensor-activated faucets is increasing steadily. Market size is expected to reach xx million units in 2025 and xx million units by 2033, driven by strong adoption rates in emerging economies and continuous technological advancements. Consumer behaviour is shifting towards products emphasizing sustainability and hygiene, further propelling market growth.
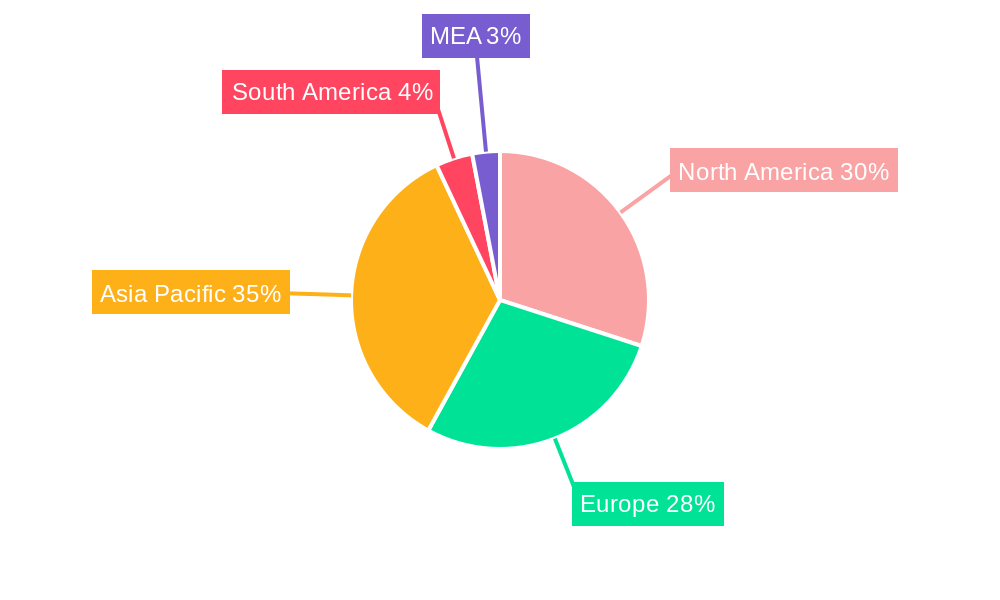
Dominant Regions, Countries, or Segments in Commercial Sanitary Ware Market
North America and Europe currently dominate the Commercial Sanitary Ware Market, accounting for approximately xx% of the global market share in 2024. However, the Asia-Pacific region is projected to witness the fastest growth during the forecast period (2025-2033), driven by rapid urbanization and infrastructure development in countries like China and India. Within the product segments, Ceramic Wash Closets and Ceramic Wash Basins dominate, collectively representing xx% of the market in 2024. In terms of technology, Slip Casting and Pressure Casting are the leading manufacturing processes.
- Leading Region: North America (xx% market share in 2024)
- Fastest-Growing Region: Asia-Pacific (Projected CAGR of xx% during 2025-2033)
- Dominant Product Segments: Ceramic Wash Closets and Ceramic Wash Basins (xx% combined market share in 2024)
- Key Growth Drivers: Rapid urbanization, infrastructure development, and rising disposable incomes in developing economies.
- Market Share by Technology: Slip Casting (xx%), Pressure Casting (xx%), Tape Casting (xx%), Others (xx%) in 2024
Commercial Sanitary Ware Market Product Landscape
The Commercial Sanitary Ware market showcases continuous product innovation, focusing on improved functionality, water efficiency, hygiene, and design aesthetics. Recent advancements include smart toilets with integrated features like heated seats, self-cleaning mechanisms, and automated flushing. Manufacturers are increasingly emphasizing sustainable and eco-friendly materials, along with sleek designs that enhance the overall aesthetic appeal of commercial spaces. Key performance metrics tracked include water consumption rates, durability, and ease of maintenance.
Key Drivers, Barriers & Challenges in Commercial Sanitary Ware Market
Key Drivers:
- Growing urbanization and commercial construction.
- Increasing demand for hygienic and water-efficient sanitary ware.
- Technological advancements leading to innovative product features.
- Favorable government policies and regulations promoting water conservation.
Key Challenges and Restraints:
- Fluctuations in raw material prices.
- Intense competition among established players and new entrants.
- Stringent environmental regulations.
- Supply chain disruptions affecting production and delivery. This resulted in a xx% increase in production costs in 2022.
Emerging Opportunities in Commercial Sanitary Ware Market
- Growing demand for smart and connected sanitary ware.
- Expansion into untapped markets in developing economies.
- Increasing focus on sustainable and eco-friendly products.
- Opportunities in designing customized solutions for specific commercial applications (hospitals, hotels, etc.).
Growth Accelerators in the Commercial Sanitary Ware Market Industry
Strategic partnerships, investments in R&D, and expansion into new geographical markets are key growth accelerators. Technological breakthroughs in water-saving technologies and smart features are enhancing product appeal and market penetration. Furthermore, manufacturers are focusing on building strong brand recognition and efficient distribution networks to consolidate their market positions and capture new opportunities.
Key Players Shaping the Commercial Sanitary Ware Market Market
- Duravit AG
- RAK Ceramics
- Kohler Co
- Geberit Group
- Villeroy&Boch
- HSIL Limited
- Duratex S A
- Roca Group
- Toto Ltd
- Somany Ceramics Limited
- LIXIL Corporation
- Saudi Ceramics
- Devon & Devon S p A
- Rovese
- Corona
- Eczacibasi
- Vitra
- Cera Sanitary Ware Ltd
- Ideal Standard International S A
Notable Milestones in Commercial Sanitary Ware Market Sector
- 2020: Introduction of a new water-saving toilet technology by Kohler Co.
- 2021: Merger between two major sanitary ware manufacturers in Europe.
- 2022: Launch of a smart toilet with integrated health monitoring features by Toto Ltd.
- 2023: Duravit AG invests heavily in sustainable manufacturing processes.
In-Depth Commercial Sanitary Ware Market Market Outlook
The Commercial Sanitary Ware Market is poised for sustained growth in the coming years, driven by ongoing urbanization, technological advancements, and increasing consumer preference for improved hygiene and water-saving solutions. Strategic partnerships and investments in R&D will further propel market growth. Manufacturers focusing on sustainable and innovative products will gain a competitive edge in this dynamic market. The forecast period (2025-2033) holds significant opportunities for market expansion and increased market penetration across various regions and segments.
Commercial Sanitary Ware Market Segmentation
- 1. Production Analysis
- 2. Consumption Analysis
- 3. Import Market Analysis (Value & Volume)
- 4. Export Market Analysis (Value & Volume)
- 5. Price Trend Analysis
Commercial Sanitary Ware Market Segmentation By Geography
-
1. North America
- 1.1. United States
- 1.2. Canada
- 1.3. Mexico
-
2. South America
- 2.1. Brazil
- 2.2. Argentina
- 2.3. Rest of South America
-
3. Europe
- 3.1. United Kingdom
- 3.2. Germany
- 3.3. France
- 3.4. Italy
- 3.5. Spain
- 3.6. Russia
- 3.7. Benelux
- 3.8. Nordics
- 3.9. Rest of Europe
-
4. Middle East & Africa
- 4.1. Turkey
- 4.2. Israel
- 4.3. GCC
- 4.4. North Africa
- 4.5. South Africa
- 4.6. Rest of Middle East & Africa
-
5. Asia Pacific
- 5.1. China
- 5.2. India
- 5.3. Japan
- 5.4. South Korea
- 5.5. ASEAN
- 5.6. Oceania
- 5.7. Rest of Asia Pacific
Commercial Sanitary Ware Market Regional Market Share
Geographic Coverage of Commercial Sanitary Ware Market
Commercial Sanitary Ware Market REPORT HIGHLIGHTS
| Aspects | Details |
|---|---|
| Study Period | 2020-2034 |
| Base Year | 2025 |
| Estimated Year | 2026 |
| Forecast Period | 2026-2034 |
| Historical Period | 2020-2025 |
| Growth Rate | CAGR of 7.2% from 2020-2034 |
| Segmentation |
|
Table of Contents
- 1. Introduction
- 1.1. Research Scope
- 1.2. Market Segmentation
- 1.3. Research Objective
- 1.4. Definitions and Assumptions
- 2. Executive Summary
- 2.1. Market Snapshot
- 3. Market Dynamics
- 3.1. Market Drivers
- 3.2. Market Restrains
- 3.3. Market Trends
- 3.4. Market Opportunities
- 4. Market Factor Analysis
- 4.1. Porters Five Forces
- 4.1.1. Bargaining Power of Suppliers
- 4.1.2. Bargaining Power of Buyers
- 4.1.3. Threat of New Entrants
- 4.1.4. Threat of Substitutes
- 4.1.5. Competitive Rivalry
- 4.2. PESTEL analysis
- 4.3. BCG Analysis
- 4.3.1. Stars (High Growth, High Market Share)
- 4.3.2. Cash Cows (Low Growth, High Market Share)
- 4.3.3. Question Mark (High Growth, Low Market Share)
- 4.3.4. Dogs (Low Growth, Low Market Share)
- 4.4. Ansoff Matrix Analysis
- 4.5. Supply Chain Analysis
- 4.6. Regulatory Landscape
- 4.7. Current Market Potential and Opportunity Assessment (TAM–SAM–SOM Framework)
- 4.8. VDR Analyst Note
- 4.1. Porters Five Forces
- 5. Market Analysis, Insights and Forecast 2021-2033
- 5.1. Market Analysis, Insights and Forecast - by Production Analysis
- 5.2. Market Analysis, Insights and Forecast - by Consumption Analysis
- 5.3. Market Analysis, Insights and Forecast - by Import Market Analysis (Value & Volume)
- 5.4. Market Analysis, Insights and Forecast - by Export Market Analysis (Value & Volume)
- 5.5. Market Analysis, Insights and Forecast - by Price Trend Analysis
- 5.6. Market Analysis, Insights and Forecast - by Region
- 5.6.1. North America
- 5.6.2. South America
- 5.6.3. Europe
- 5.6.4. Middle East & Africa
- 5.6.5. Asia Pacific
- 6. Global Commercial Sanitary Ware Market Analysis, Insights and Forecast, 2021-2033
- 6.1. Market Analysis, Insights and Forecast - by Production Analysis
- 6.2. Market Analysis, Insights and Forecast - by Consumption Analysis
- 6.3. Market Analysis, Insights and Forecast - by Import Market Analysis (Value & Volume)
- 6.4. Market Analysis, Insights and Forecast - by Export Market Analysis (Value & Volume)
- 6.5. Market Analysis, Insights and Forecast - by Price Trend Analysis
- 7. North America Commercial Sanitary Ware Market Analysis, Insights and Forecast, 2021-2033
- 7.1. Market Analysis, Insights and Forecast - by Production Analysis
- 7.2. Market Analysis, Insights and Forecast - by Consumption Analysis
- 7.3. Market Analysis, Insights and Forecast - by Import Market Analysis (Value & Volume)
- 7.4. Market Analysis, Insights and Forecast - by Export Market Analysis (Value & Volume)
- 7.5. Market Analysis, Insights and Forecast - by Price Trend Analysis
- 8. South America Commercial Sanitary Ware Market Analysis, Insights and Forecast, 2021-2033
- 8.1. Market Analysis, Insights and Forecast - by Production Analysis
- 8.2. Market Analysis, Insights and Forecast - by Consumption Analysis
- 8.3. Market Analysis, Insights and Forecast - by Import Market Analysis (Value & Volume)
- 8.4. Market Analysis, Insights and Forecast - by Export Market Analysis (Value & Volume)
- 8.5. Market Analysis, Insights and Forecast - by Price Trend Analysis
- 9. Europe Commercial Sanitary Ware Market Analysis, Insights and Forecast, 2021-2033
- 9.1. Market Analysis, Insights and Forecast - by Production Analysis
- 9.2. Market Analysis, Insights and Forecast - by Consumption Analysis
- 9.3. Market Analysis, Insights and Forecast - by Import Market Analysis (Value & Volume)
- 9.4. Market Analysis, Insights and Forecast - by Export Market Analysis (Value & Volume)
- 9.5. Market Analysis, Insights and Forecast - by Price Trend Analysis
- 10. Middle East & Africa Commercial Sanitary Ware Market Analysis, Insights and Forecast, 2021-2033
- 10.1. Market Analysis, Insights and Forecast - by Production Analysis
- 10.2. Market Analysis, Insights and Forecast - by Consumption Analysis
- 10.3. Market Analysis, Insights and Forecast - by Import Market Analysis (Value & Volume)
- 10.4. Market Analysis, Insights and Forecast - by Export Market Analysis (Value & Volume)
- 10.5. Market Analysis, Insights and Forecast - by Price Trend Analysis
- 11. Asia Pacific Commercial Sanitary Ware Market Analysis, Insights and Forecast, 2021-2033
- 11.1. Market Analysis, Insights and Forecast - by Production Analysis
- 11.2. Market Analysis, Insights and Forecast - by Consumption Analysis
- 11.3. Market Analysis, Insights and Forecast - by Import Market Analysis (Value & Volume)
- 11.4. Market Analysis, Insights and Forecast - by Export Market Analysis (Value & Volume)
- 11.5. Market Analysis, Insights and Forecast - by Price Trend Analysis
- 12. Competitive Analysis
- 12.1. Company Profiles
- 12.1.1 Duravit AG
- 12.1.1.1. Company Overview
- 12.1.1.2. Products
- 12.1.1.3. Company Financials
- 12.1.1.4. SWOT Analysis
- 12.1.2 RAK Ceramics
- 12.1.2.1. Company Overview
- 12.1.2.2. Products
- 12.1.2.3. Company Financials
- 12.1.2.4. SWOT Analysis
- 12.1.3 Kohler Co
- 12.1.3.1. Company Overview
- 12.1.3.2. Products
- 12.1.3.3. Company Financials
- 12.1.3.4. SWOT Analysis
- 12.1.4 Geberit Group
- 12.1.4.1. Company Overview
- 12.1.4.2. Products
- 12.1.4.3. Company Financials
- 12.1.4.4. SWOT Analysis
- 12.1.5 Villeroy&Boch
- 12.1.5.1. Company Overview
- 12.1.5.2. Products
- 12.1.5.3. Company Financials
- 12.1.5.4. SWOT Analysis
- 12.1.6 HSIL Limited
- 12.1.6.1. Company Overview
- 12.1.6.2. Products
- 12.1.6.3. Company Financials
- 12.1.6.4. SWOT Analysis
- 12.1.7 Duratex S A
- 12.1.7.1. Company Overview
- 12.1.7.2. Products
- 12.1.7.3. Company Financials
- 12.1.7.4. SWOT Analysis
- 12.1.8 Roca Group
- 12.1.8.1. Company Overview
- 12.1.8.2. Products
- 12.1.8.3. Company Financials
- 12.1.8.4. SWOT Analysis
- 12.1.9 Toto Ltd
- 12.1.9.1. Company Overview
- 12.1.9.2. Products
- 12.1.9.3. Company Financials
- 12.1.9.4. SWOT Analysis
- 12.1.10 Somany Ceramics Limited LIXIL Corporation Saudi CeramicsDevon & Devon S p A Rovese CoronaEczacibasiVitraCera Sanitary Ware Ltd and etc)*List Not Exhaustive
- 12.1.10.1. Company Overview
- 12.1.10.2. Products
- 12.1.10.3. Company Financials
- 12.1.10.4. SWOT Analysis
- 12.1.11 Ideal Standard International S A
- 12.1.11.1. Company Overview
- 12.1.11.2. Products
- 12.1.11.3. Company Financials
- 12.1.11.4. SWOT Analysis
- 12.1.1 Duravit AG
- 12.2. Market Entropy
- 12.2.1 Company's Key Areas Served
- 12.2.2 Recent Developments
- 12.3. Company Market Share Analysis 2025
- 12.3.1 Top 5 Companies Market Share Analysis
- 12.3.2 Top 3 Companies Market Share Analysis
- 12.4. List of Potential Customers
- 13. Research Methodology
List of Figures
- Figure 1: Global Commercial Sanitary Ware Market Revenue Breakdown (billion, %) by Region 2025 & 2033
- Figure 2: North America Commercial Sanitary Ware Market Revenue (billion), by Production Analysis 2025 & 2033
- Figure 3: North America Commercial Sanitary Ware Market Revenue Share (%), by Production Analysis 2025 & 2033
- Figure 4: North America Commercial Sanitary Ware Market Revenue (billion), by Consumption Analysis 2025 & 2033
- Figure 5: North America Commercial Sanitary Ware Market Revenue Share (%), by Consumption Analysis 2025 & 2033
- Figure 6: North America Commercial Sanitary Ware Market Revenue (billion), by Import Market Analysis (Value & Volume) 2025 & 2033
- Figure 7: North America Commercial Sanitary Ware Market Revenue Share (%), by Import Market Analysis (Value & Volume) 2025 & 2033
- Figure 8: North America Commercial Sanitary Ware Market Revenue (billion), by Export Market Analysis (Value & Volume) 2025 & 2033
- Figure 9: North America Commercial Sanitary Ware Market Revenue Share (%), by Export Market Analysis (Value & Volume) 2025 & 2033
- Figure 10: North America Commercial Sanitary Ware Market Revenue (billion), by Price Trend Analysis 2025 & 2033
- Figure 11: North America Commercial Sanitary Ware Market Revenue Share (%), by Price Trend Analysis 2025 & 2033
- Figure 12: North America Commercial Sanitary Ware Market Revenue (billion), by Country 2025 & 2033
- Figure 13: North America Commercial Sanitary Ware Market Revenue Share (%), by Country 2025 & 2033
- Figure 14: South America Commercial Sanitary Ware Market Revenue (billion), by Production Analysis 2025 & 2033
- Figure 15: South America Commercial Sanitary Ware Market Revenue Share (%), by Production Analysis 2025 & 2033
- Figure 16: South America Commercial Sanitary Ware Market Revenue (billion), by Consumption Analysis 2025 & 2033
- Figure 17: South America Commercial Sanitary Ware Market Revenue Share (%), by Consumption Analysis 2025 & 2033
- Figure 18: South America Commercial Sanitary Ware Market Revenue (billion), by Import Market Analysis (Value & Volume) 2025 & 2033
- Figure 19: South America Commercial Sanitary Ware Market Revenue Share (%), by Import Market Analysis (Value & Volume) 2025 & 2033
- Figure 20: South America Commercial Sanitary Ware Market Revenue (billion), by Export Market Analysis (Value & Volume) 2025 & 2033
- Figure 21: South America Commercial Sanitary Ware Market Revenue Share (%), by Export Market Analysis (Value & Volume) 2025 & 2033
- Figure 22: South America Commercial Sanitary Ware Market Revenue (billion), by Price Trend Analysis 2025 & 2033
- Figure 23: South America Commercial Sanitary Ware Market Revenue Share (%), by Price Trend Analysis 2025 & 2033
- Figure 24: South America Commercial Sanitary Ware Market Revenue (billion), by Country 2025 & 2033
- Figure 25: South America Commercial Sanitary Ware Market Revenue Share (%), by Country 2025 & 2033
- Figure 26: Europe Commercial Sanitary Ware Market Revenue (billion), by Production Analysis 2025 & 2033
- Figure 27: Europe Commercial Sanitary Ware Market Revenue Share (%), by Production Analysis 2025 & 2033
- Figure 28: Europe Commercial Sanitary Ware Market Revenue (billion), by Consumption Analysis 2025 & 2033
- Figure 29: Europe Commercial Sanitary Ware Market Revenue Share (%), by Consumption Analysis 2025 & 2033
- Figure 30: Europe Commercial Sanitary Ware Market Revenue (billion), by Import Market Analysis (Value & Volume) 2025 & 2033
- Figure 31: Europe Commercial Sanitary Ware Market Revenue Share (%), by Import Market Analysis (Value & Volume) 2025 & 2033
- Figure 32: Europe Commercial Sanitary Ware Market Revenue (billion), by Export Market Analysis (Value & Volume) 2025 & 2033
- Figure 33: Europe Commercial Sanitary Ware Market Revenue Share (%), by Export Market Analysis (Value & Volume) 2025 & 2033
- Figure 34: Europe Commercial Sanitary Ware Market Revenue (billion), by Price Trend Analysis 2025 & 2033
- Figure 35: Europe Commercial Sanitary Ware Market Revenue Share (%), by Price Trend Analysis 2025 & 2033
- Figure 36: Europe Commercial Sanitary Ware Market Revenue (billion), by Country 2025 & 2033
- Figure 37: Europe Commercial Sanitary Ware Market Revenue Share (%), by Country 2025 & 2033
- Figure 38: Middle East & Africa Commercial Sanitary Ware Market Revenue (billion), by Production Analysis 2025 & 2033
- Figure 39: Middle East & Africa Commercial Sanitary Ware Market Revenue Share (%), by Production Analysis 2025 & 2033
- Figure 40: Middle East & Africa Commercial Sanitary Ware Market Revenue (billion), by Consumption Analysis 2025 & 2033
- Figure 41: Middle East & Africa Commercial Sanitary Ware Market Revenue Share (%), by Consumption Analysis 2025 & 2033
- Figure 42: Middle East & Africa Commercial Sanitary Ware Market Revenue (billion), by Import Market Analysis (Value & Volume) 2025 & 2033
- Figure 43: Middle East & Africa Commercial Sanitary Ware Market Revenue Share (%), by Import Market Analysis (Value & Volume) 2025 & 2033
- Figure 44: Middle East & Africa Commercial Sanitary Ware Market Revenue (billion), by Export Market Analysis (Value & Volume) 2025 & 2033
- Figure 45: Middle East & Africa Commercial Sanitary Ware Market Revenue Share (%), by Export Market Analysis (Value & Volume) 2025 & 2033
- Figure 46: Middle East & Africa Commercial Sanitary Ware Market Revenue (billion), by Price Trend Analysis 2025 & 2033
- Figure 47: Middle East & Africa Commercial Sanitary Ware Market Revenue Share (%), by Price Trend Analysis 2025 & 2033
- Figure 48: Middle East & Africa Commercial Sanitary Ware Market Revenue (billion), by Country 2025 & 2033
- Figure 49: Middle East & Africa Commercial Sanitary Ware Market Revenue Share (%), by Country 2025 & 2033
- Figure 50: Asia Pacific Commercial Sanitary Ware Market Revenue (billion), by Production Analysis 2025 & 2033
- Figure 51: Asia Pacific Commercial Sanitary Ware Market Revenue Share (%), by Production Analysis 2025 & 2033
- Figure 52: Asia Pacific Commercial Sanitary Ware Market Revenue (billion), by Consumption Analysis 2025 & 2033
- Figure 53: Asia Pacific Commercial Sanitary Ware Market Revenue Share (%), by Consumption Analysis 2025 & 2033
- Figure 54: Asia Pacific Commercial Sanitary Ware Market Revenue (billion), by Import Market Analysis (Value & Volume) 2025 & 2033
- Figure 55: Asia Pacific Commercial Sanitary Ware Market Revenue Share (%), by Import Market Analysis (Value & Volume) 2025 & 2033
- Figure 56: Asia Pacific Commercial Sanitary Ware Market Revenue (billion), by Export Market Analysis (Value & Volume) 2025 & 2033
- Figure 57: Asia Pacific Commercial Sanitary Ware Market Revenue Share (%), by Export Market Analysis (Value & Volume) 2025 & 2033
- Figure 58: Asia Pacific Commercial Sanitary Ware Market Revenue (billion), by Price Trend Analysis 2025 & 2033
- Figure 59: Asia Pacific Commercial Sanitary Ware Market Revenue Share (%), by Price Trend Analysis 2025 & 2033
- Figure 60: Asia Pacific Commercial Sanitary Ware Market Revenue (billion), by Country 2025 & 2033
- Figure 61: Asia Pacific Commercial Sanitary Ware Market Revenue Share (%), by Country 2025 & 2033
List of Tables
- Table 1: Global Commercial Sanitary Ware Market Revenue billion Forecast, by Production Analysis 2020 & 2033
- Table 2: Global Commercial Sanitary Ware Market Revenue billion Forecast, by Consumption Analysis 2020 & 2033
- Table 3: Global Commercial Sanitary Ware Market Revenue billion Forecast, by Import Market Analysis (Value & Volume) 2020 & 2033
- Table 4: Global Commercial Sanitary Ware Market Revenue billion Forecast, by Export Market Analysis (Value & Volume) 2020 & 2033
- Table 5: Global Commercial Sanitary Ware Market Revenue billion Forecast, by Price Trend Analysis 2020 & 2033
- Table 6: Global Commercial Sanitary Ware Market Revenue billion Forecast, by Region 2020 & 2033
- Table 7: Global Commercial Sanitary Ware Market Revenue billion Forecast, by Production Analysis 2020 & 2033
- Table 8: Global Commercial Sanitary Ware Market Revenue billion Forecast, by Consumption Analysis 2020 & 2033
- Table 9: Global Commercial Sanitary Ware Market Revenue billion Forecast, by Import Market Analysis (Value & Volume) 2020 & 2033
- Table 10: Global Commercial Sanitary Ware Market Revenue billion Forecast, by Export Market Analysis (Value & Volume) 2020 & 2033
- Table 11: Global Commercial Sanitary Ware Market Revenue billion Forecast, by Price Trend Analysis 2020 & 2033
- Table 12: Global Commercial Sanitary Ware Market Revenue billion Forecast, by Country 2020 & 2033
- Table 13: United States Commercial Sanitary Ware Market Revenue (billion) Forecast, by Application 2020 & 2033
- Table 14: Canada Commercial Sanitary Ware Market Revenue (billion) Forecast, by Application 2020 & 2033
- Table 15: Mexico Commercial Sanitary Ware Market Revenue (billion) Forecast, by Application 2020 & 2033
- Table 16: Global Commercial Sanitary Ware Market Revenue billion Forecast, by Production Analysis 2020 & 2033
- Table 17: Global Commercial Sanitary Ware Market Revenue billion Forecast, by Consumption Analysis 2020 & 2033
- Table 18: Global Commercial Sanitary Ware Market Revenue billion Forecast, by Import Market Analysis (Value & Volume) 2020 & 2033
- Table 19: Global Commercial Sanitary Ware Market Revenue billion Forecast, by Export Market Analysis (Value & Volume) 2020 & 2033
- Table 20: Global Commercial Sanitary Ware Market Revenue billion Forecast, by Price Trend Analysis 2020 & 2033
- Table 21: Global Commercial Sanitary Ware Market Revenue billion Forecast, by Country 2020 & 2033
- Table 22: Brazil Commercial Sanitary Ware Market Revenue (billion) Forecast, by Application 2020 & 2033
- Table 23: Argentina Commercial Sanitary Ware Market Revenue (billion) Forecast, by Application 2020 & 2033
- Table 24: Rest of South America Commercial Sanitary Ware Market Revenue (billion) Forecast, by Application 2020 & 2033
- Table 25: Global Commercial Sanitary Ware Market Revenue billion Forecast, by Production Analysis 2020 & 2033
- Table 26: Global Commercial Sanitary Ware Market Revenue billion Forecast, by Consumption Analysis 2020 & 2033
- Table 27: Global Commercial Sanitary Ware Market Revenue billion Forecast, by Import Market Analysis (Value & Volume) 2020 & 2033
- Table 28: Global Commercial Sanitary Ware Market Revenue billion Forecast, by Export Market Analysis (Value & Volume) 2020 & 2033
- Table 29: Global Commercial Sanitary Ware Market Revenue billion Forecast, by Price Trend Analysis 2020 & 2033
- Table 30: Global Commercial Sanitary Ware Market Revenue billion Forecast, by Country 2020 & 2033
- Table 31: United Kingdom Commercial Sanitary Ware Market Revenue (billion) Forecast, by Application 2020 & 2033
- Table 32: Germany Commercial Sanitary Ware Market Revenue (billion) Forecast, by Application 2020 & 2033
- Table 33: France Commercial Sanitary Ware Market Revenue (billion) Forecast, by Application 2020 & 2033
- Table 34: Italy Commercial Sanitary Ware Market Revenue (billion) Forecast, by Application 2020 & 2033
- Table 35: Spain Commercial Sanitary Ware Market Revenue (billion) Forecast, by Application 2020 & 2033
- Table 36: Russia Commercial Sanitary Ware Market Revenue (billion) Forecast, by Application 2020 & 2033
- Table 37: Benelux Commercial Sanitary Ware Market Revenue (billion) Forecast, by Application 2020 & 2033
- Table 38: Nordics Commercial Sanitary Ware Market Revenue (billion) Forecast, by Application 2020 & 2033
- Table 39: Rest of Europe Commercial Sanitary Ware Market Revenue (billion) Forecast, by Application 2020 & 2033
- Table 40: Global Commercial Sanitary Ware Market Revenue billion Forecast, by Production Analysis 2020 & 2033
- Table 41: Global Commercial Sanitary Ware Market Revenue billion Forecast, by Consumption Analysis 2020 & 2033
- Table 42: Global Commercial Sanitary Ware Market Revenue billion Forecast, by Import Market Analysis (Value & Volume) 2020 & 2033
- Table 43: Global Commercial Sanitary Ware Market Revenue billion Forecast, by Export Market Analysis (Value & Volume) 2020 & 2033
- Table 44: Global Commercial Sanitary Ware Market Revenue billion Forecast, by Price Trend Analysis 2020 & 2033
- Table 45: Global Commercial Sanitary Ware Market Revenue billion Forecast, by Country 2020 & 2033
- Table 46: Turkey Commercial Sanitary Ware Market Revenue (billion) Forecast, by Application 2020 & 2033
- Table 47: Israel Commercial Sanitary Ware Market Revenue (billion) Forecast, by Application 2020 & 2033
- Table 48: GCC Commercial Sanitary Ware Market Revenue (billion) Forecast, by Application 2020 & 2033
- Table 49: North Africa Commercial Sanitary Ware Market Revenue (billion) Forecast, by Application 2020 & 2033
- Table 50: South Africa Commercial Sanitary Ware Market Revenue (billion) Forecast, by Application 2020 & 2033
- Table 51: Rest of Middle East & Africa Commercial Sanitary Ware Market Revenue (billion) Forecast, by Application 2020 & 2033
- Table 52: Global Commercial Sanitary Ware Market Revenue billion Forecast, by Production Analysis 2020 & 2033
- Table 53: Global Commercial Sanitary Ware Market Revenue billion Forecast, by Consumption Analysis 2020 & 2033
- Table 54: Global Commercial Sanitary Ware Market Revenue billion Forecast, by Import Market Analysis (Value & Volume) 2020 & 2033
- Table 55: Global Commercial Sanitary Ware Market Revenue billion Forecast, by Export Market Analysis (Value & Volume) 2020 & 2033
- Table 56: Global Commercial Sanitary Ware Market Revenue billion Forecast, by Price Trend Analysis 2020 & 2033
- Table 57: Global Commercial Sanitary Ware Market Revenue billion Forecast, by Country 2020 & 2033
- Table 58: China Commercial Sanitary Ware Market Revenue (billion) Forecast, by Application 2020 & 2033
- Table 59: India Commercial Sanitary Ware Market Revenue (billion) Forecast, by Application 2020 & 2033
- Table 60: Japan Commercial Sanitary Ware Market Revenue (billion) Forecast, by Application 2020 & 2033
- Table 61: South Korea Commercial Sanitary Ware Market Revenue (billion) Forecast, by Application 2020 & 2033
- Table 62: ASEAN Commercial Sanitary Ware Market Revenue (billion) Forecast, by Application 2020 & 2033
- Table 63: Oceania Commercial Sanitary Ware Market Revenue (billion) Forecast, by Application 2020 & 2033
- Table 64: Rest of Asia Pacific Commercial Sanitary Ware Market Revenue (billion) Forecast, by Application 2020 & 2033
Frequently Asked Questions
1. What is the projected Compound Annual Growth Rate (CAGR) of the Commercial Sanitary Ware Market?
The projected CAGR is approximately 7.2%.
2. Which companies are prominent players in the Commercial Sanitary Ware Market?
Key companies in the market include Duravit AG, RAK Ceramics, Kohler Co, Geberit Group, Villeroy&Boch, HSIL Limited, Duratex S A, Roca Group, Toto Ltd, Somany Ceramics Limited LIXIL Corporation Saudi CeramicsDevon & Devon S p A Rovese CoronaEczacibasiVitraCera Sanitary Ware Ltd and etc)*List Not Exhaustive, Ideal Standard International S A.
3. What are the main segments of the Commercial Sanitary Ware Market?
The market segments include Production Analysis, Consumption Analysis, Import Market Analysis (Value & Volume), Export Market Analysis (Value & Volume), Price Trend Analysis.
4. Can you provide details about the market size?
The market size is estimated to be USD 32.47 billion as of 2022.
5. What are some drivers contributing to market growth?
Increasing Household Disposable Income Drives the Market; Changing Lifestyles Drives the Market.
6. What are the notable trends driving market growth?
Residential Segment Dominates the Ceramic Sanitary Ware Market.
7. Are there any restraints impacting market growth?
Repairing Challenges; Infrastructure and Space Limitations.
8. Can you provide examples of recent developments in the market?
N/A
9. What pricing options are available for accessing the report?
Pricing options include single-user, multi-user, and enterprise licenses priced at USD 4750, USD 5250, and USD 8750 respectively.
10. Is the market size provided in terms of value or volume?
The market size is provided in terms of value, measured in billion.
11. Are there any specific market keywords associated with the report?
Yes, the market keyword associated with the report is "Commercial Sanitary Ware Market," which aids in identifying and referencing the specific market segment covered.
12. How do I determine which pricing option suits my needs best?
The pricing options vary based on user requirements and access needs. Individual users may opt for single-user licenses, while businesses requiring broader access may choose multi-user or enterprise licenses for cost-effective access to the report.
13. Are there any additional resources or data provided in the Commercial Sanitary Ware Market report?
While the report offers comprehensive insights, it's advisable to review the specific contents or supplementary materials provided to ascertain if additional resources or data are available.
14. How can I stay updated on further developments or reports in the Commercial Sanitary Ware Market?
To stay informed about further developments, trends, and reports in the Commercial Sanitary Ware Market, consider subscribing to industry newsletters, following relevant companies and organizations, or regularly checking reputable industry news sources and publications.
Methodology
Step 1 - Identification of Relevant Samples Size from Population Database


Step 2 - Approaches for Defining Global Market Size (Value, Volume* & Price*)

Note*: In applicable scenarios
Step 3 - Data Sources
Primary Research
- Web Analytics
- Survey Reports
- Research Institute
- Latest Research Reports
- Opinion Leaders
Secondary Research
- Annual Reports
- White Paper
- Latest Press Release
- Industry Association
- Paid Database
- Investor Presentations

Step 4 - Data Triangulation
Involves using different sources of information in order to increase the validity of a study
These sources are likely to be stakeholders in a program - participants, other researchers, program staff, other community members, and so on.
Then we put all data in single framework & apply various statistical tools to find out the dynamic on the market.
During the analysis stage, feedback from the stakeholder groups would be compared to determine areas of agreement as well as areas of divergence