

Key Insights
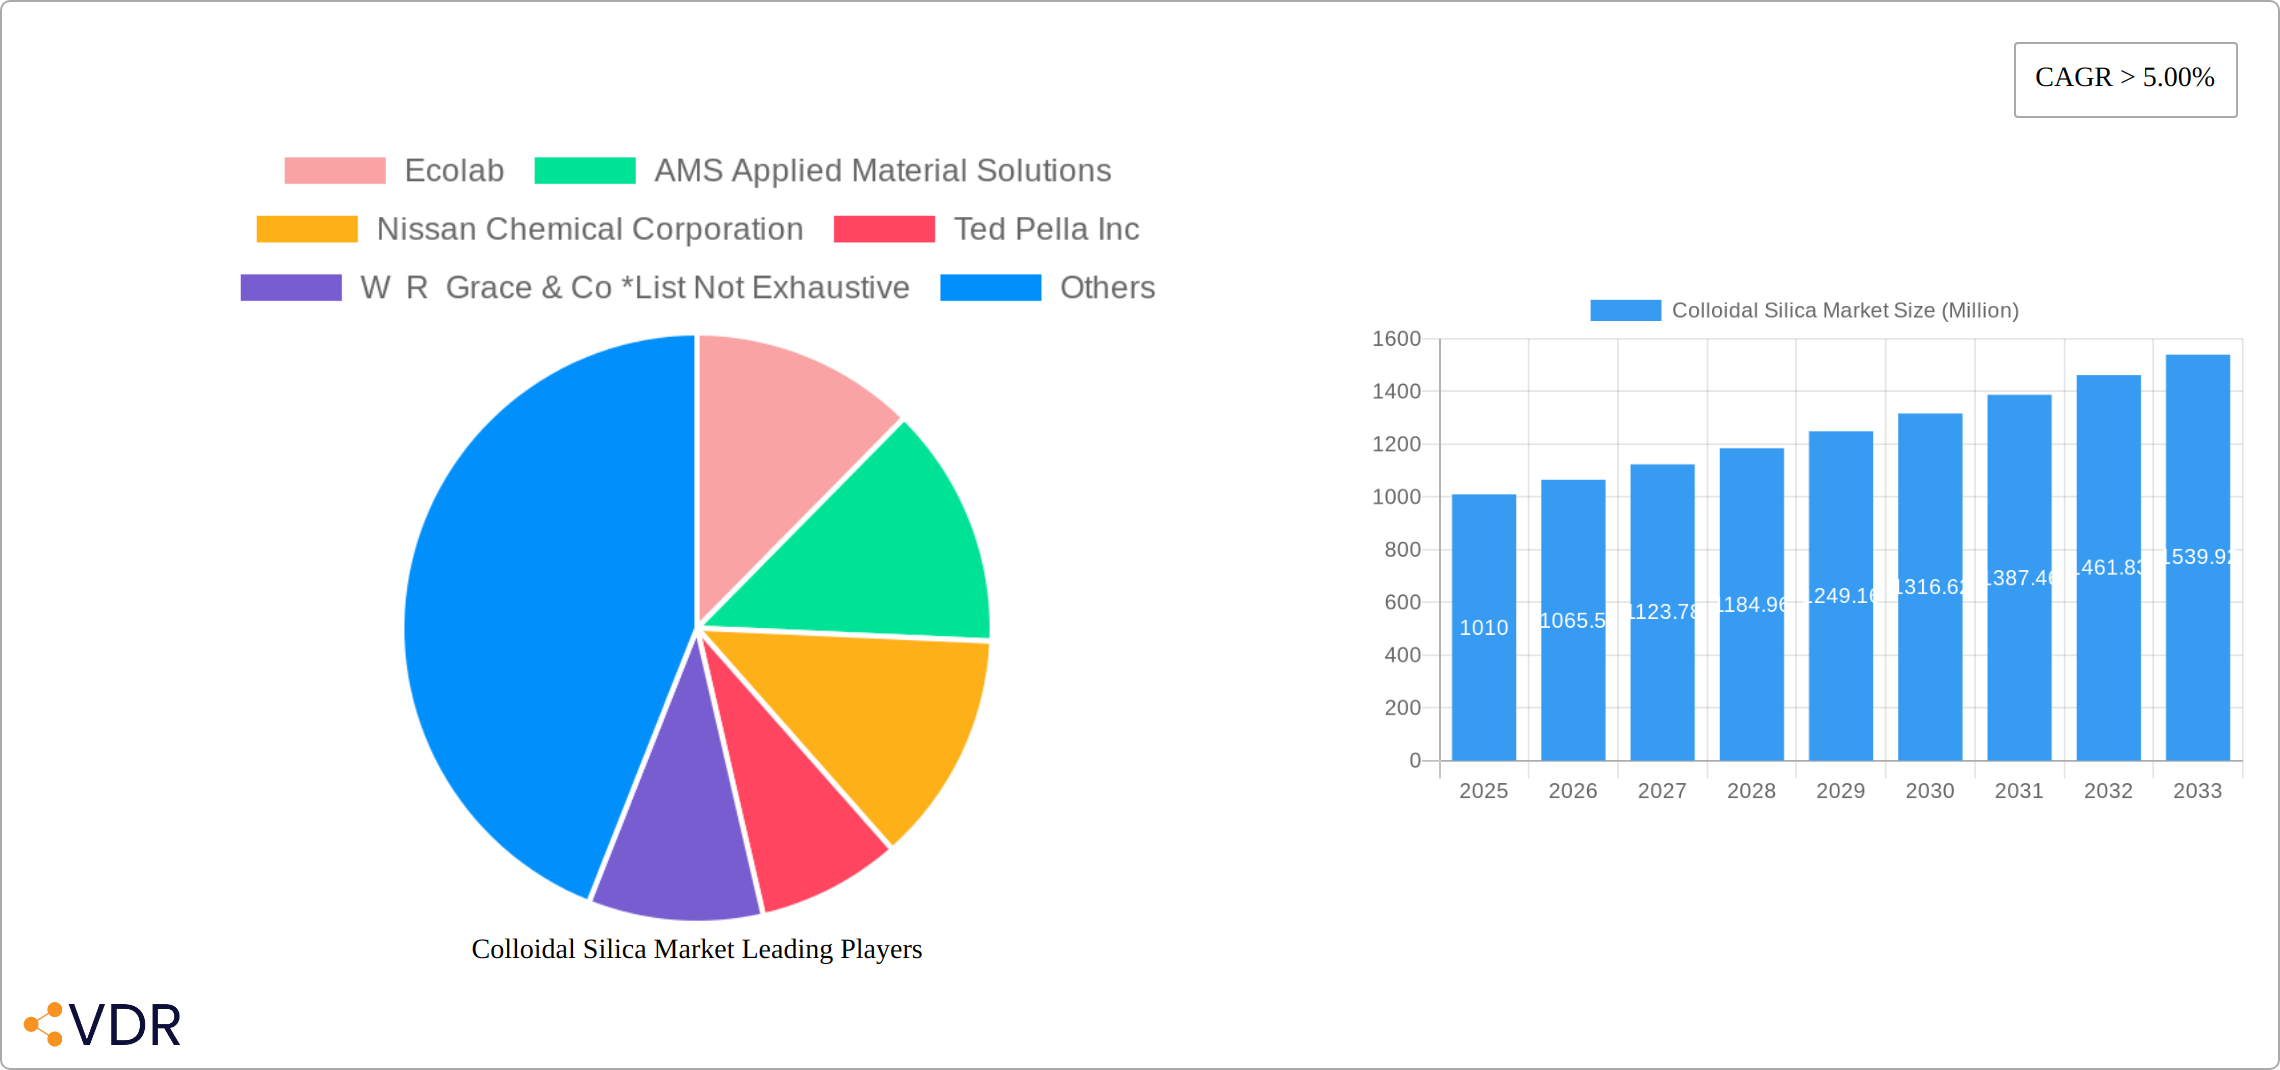
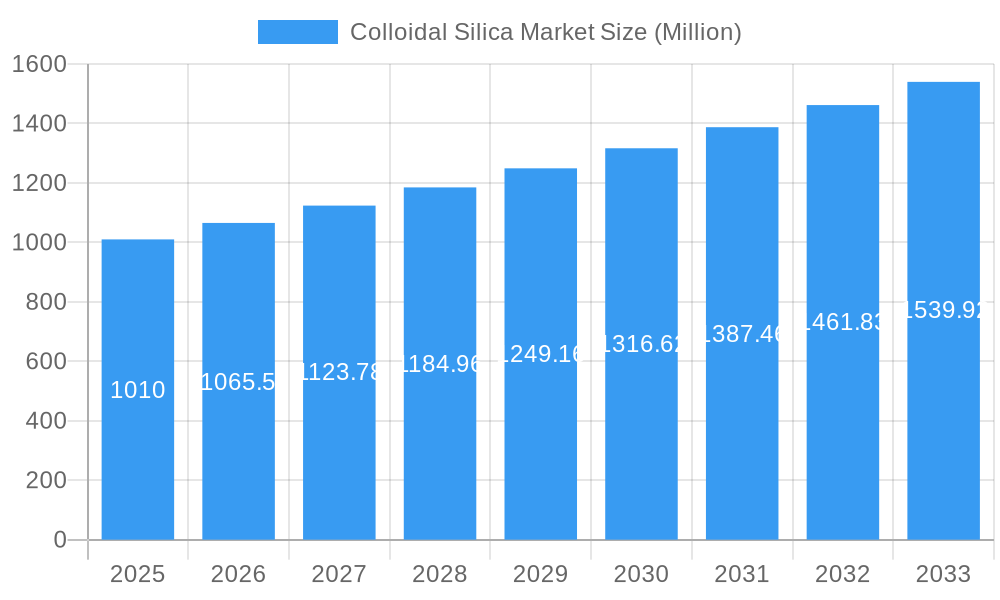
The global colloidal silica market, valued at approximately $1.01 billion in 2025, is projected to experience robust growth, exceeding a 5% compound annual growth rate (CAGR) through 2033. This expansion is driven by increasing demand across diverse end-use industries. The pulp and paper industry relies heavily on colloidal silica for its superior binding and coating properties, contributing significantly to market growth. Similarly, the paints and coatings sector leverages colloidal silica for rheology modification and enhanced performance characteristics. The chemical industry utilizes it as a crucial component in various processes, while the construction sector benefits from its use in concrete admixtures for improved strength and durability. Growth is further fueled by advancements in colloidal silica production techniques leading to higher purity and improved functionality, expanding applications in the electronics and semiconductors sectors. However, fluctuations in raw material prices and environmental concerns surrounding silica production represent key market restraints. The Asia-Pacific region, particularly China and India, is expected to dominate the market owing to rapid industrialization and expanding infrastructure development. North America and Europe are also significant markets, driven by established industrial sectors and a focus on technological advancements. Key players such as Ecolab, Cabot Corporation, and Evonik are actively involved in research and development, introducing innovative colloidal silica products to cater to the evolving market needs.
Colloidal Silica Market Market Size (In Billion)
The competitive landscape is characterized by a blend of established multinational corporations and regional players. Established players maintain a strong foothold through extensive distribution networks and brand recognition, while regional companies leverage cost advantages and localized expertise. The market is expected to witness strategic mergers and acquisitions, technological collaborations, and product diversification to cater to specific industry requirements. Future growth will depend on sustained demand from key end-use sectors, along with innovative applications of colloidal silica in emerging technologies. The market's resilience is bolstered by its essential role in several crucial industries, ensuring its continued growth trajectory in the coming years. Further research and development efforts in the field will be critical for sustainable development and mitigating potential environmental impacts.
Colloidal Silica Market Company Market Share
Colloidal Silica Market: A Comprehensive Report (2019-2033)
This comprehensive report provides an in-depth analysis of the Colloidal Silica Market, encompassing market dynamics, growth trends, regional segmentation, product landscape, key players, and future outlook. The study period covers 2019-2033, with 2025 as the base and estimated year. This report is essential for industry professionals, investors, and strategic decision-makers seeking to understand and capitalize on opportunities within this dynamic market. The report meticulously analyzes the parent market (Specialty Chemicals) and its child market (Colloidal Silica), providing a holistic view of the industry's current state and future trajectory. The market value is presented in Million USD.
Colloidal Silica Market Dynamics & Structure
The Colloidal Silica market is characterized by moderate concentration, with several key players holding significant market share. Technological innovation, particularly in enhancing particle size control and surface modification, drives market expansion. Stringent environmental regulations influence production methods and material composition, posing both challenges and opportunities. Competitive product substitutes, such as polymeric thickeners, exist, but colloidal silica's unique properties maintain its dominance in several applications. The market shows diverse end-user demographics, spanning construction, paints and coatings, and electronics. M&A activity has been moderate, with strategic acquisitions aimed at expanding product portfolios and geographical reach.
- Market Concentration: Moderately concentrated, with top 5 players holding approximately xx% market share in 2024.
- Technological Innovation: Focus on improving particle size distribution, surface functionalization, and cost-effective production methods.
- Regulatory Framework: Stringent environmental regulations impacting raw material sourcing and waste management.
- Competitive Substitutes: Polymeric thickeners and other rheological additives pose competitive pressure.
- End-User Demographics: Diverse, including construction, paints & coatings, electronics, and pulp & paper industries.
- M&A Trends: Moderate activity, with acquisitions driven by expansion into new markets and product diversification. An estimated xx M&A deals occurred between 2019-2024.
Colloidal Silica Market Growth Trends & Insights
The global colloidal silica market is experiencing robust growth, fueled by increasing demand across diverse end-use sectors. This dynamic market exhibited a considerable CAGR of [Insert Precise CAGR for 2019-2024]% during the historical period (2019-2024) and is projected to maintain a strong CAGR of [Insert Precise CAGR for 2025-2033]% during the forecast period (2025-2033), reaching an estimated value of [Insert Precise Value in Million USD] by 2033. This expansion is driven by several key factors, including:
- Booming Infrastructure Development: Significant investments in infrastructure projects, particularly in rapidly developing economies, are creating a substantial demand for high-performance construction materials incorporating colloidal silica.
- Growing Demand for High-Performance Materials: Across various industries, including electronics, coatings, and pharmaceuticals, there's a rising need for materials with enhanced properties, which colloidal silica effectively delivers.
- Technological Advancements: Ongoing innovations in colloidal silica synthesis are leading to improved product quality, enhanced functionalities, and expanded application possibilities. This includes advancements in particle size control, surface modification, and purity enhancement.
- Sustainability Concerns: The increasing consumer preference for sustainable and eco-friendly products is bolstering the demand for colloidal silica, known for its environmentally benign nature compared to some alternatives.
- Untapped Market Potential: Significant growth opportunities exist in emerging regions, where market penetration remains relatively low, offering substantial scope for expansion.
Dominant Regions, Countries, or Segments in Colloidal Silica Market
The Asia-Pacific region currently dominates the colloidal silica market, driven by rapid industrialization, extensive infrastructure development, and a booming construction sector. China and India are key contributors to this regional leadership. North America also holds a significant market share, supported by its established manufacturing base and robust demand from sectors like electronics and paints & coatings. Within end-user industries, the construction and paints & coatings sectors are major drivers of global demand, showcasing remarkable growth potential. More specifically:
- Asia-Pacific Key Drivers: Rapid industrialization, substantial infrastructure investments, increasing disposable incomes, and a growing middle class driving consumer demand.
- North America Key Drivers: Established manufacturing sector, high demand from electronics and coatings industries, focus on innovation and technological advancements.
- Dominant End-User Industries (2024): Construction ([Insert Precise Market Share]% market share), Paints & Coatings ([Insert Precise Market Share]% market share).
- High-Growth Potential Regions: Untapped markets in emerging economies, particularly in Africa and South America, offer significant future expansion potential.
Colloidal Silica Market Product Landscape
Colloidal silica products are available in various forms, including dispersions, sols, and powders, each tailored for specific applications. Recent innovations focus on improving particle size control, surface modification, and rheological properties. These advancements enhance the performance characteristics of colloidal silica in various applications, such as improved binding strength, increased viscosity, and enhanced durability. Unique selling propositions frequently highlight high purity, consistent particle size, and tailored surface modifications for optimal performance.
Key Drivers, Barriers & Challenges in Colloidal Silica Market
Key Drivers:
- Increasing demand from the construction and coatings industries.
- Technological advancements leading to improved product properties.
- Growth of the electronics and semiconductor sectors.
Challenges and Restraints:
- Fluctuations in raw material prices (silica sand).
- Stringent environmental regulations impacting production costs.
- Intense competition from substitute materials. This competitive pressure has resulted in a price decrease of xx% in the last 5 years.
Emerging Opportunities in Colloidal Silica Market
Emerging opportunities lie in expanding into untapped markets, such as specialized coatings for sustainable infrastructure and advanced applications in electronics and semiconductors. The development of novel colloidal silica-based materials with enhanced functionalities, such as self-healing properties and improved biocompatibility, also presents significant growth potential.
Growth Accelerators in the Colloidal Silica Market Industry
Several factors are accelerating growth within the colloidal silica market. These include:
- Strategic Partnerships & Collaborations: Increased collaborations between colloidal silica manufacturers and end-users are leading to the development of tailored solutions and optimized supply chains.
- Technological Advancements in Synthesis: Continued breakthroughs in synthesis methods are enabling the production of higher-quality colloidal silica with customized properties to meet specific application requirements.
- Geographical Expansion: Strategic expansion into new geographical regions, particularly emerging markets, is creating substantial opportunities for market growth and diversification.
- Product Diversification: Manufacturers are focusing on developing specialized colloidal silica products catering to niche applications, further expanding market reach.
Key Players Shaping the Colloidal Silica Market Market
- Ecolab
- AMS Applied Material Solutions
- Nissan Chemical Corporation
- Ted Pella Inc
- W R Grace & Co
- Cabot Corporation
- Nyacol
- FUSO CHEMICAL CO LTD
- Nouryon
- CWK Chemiewerk Bad Kstritz GmbH
- Linyi Kehan Silicon Products Co LTD
- Sterling Chemicals
- Jinan Yinfeng Silicon Products Co Ltd
- Akasel
- Evonik
Notable Milestones in Colloidal Silica Market Sector
- November 2021: Nouryon announced increased production capacity at its Green Bay facility to meet growing demand from the packaging and construction markets (completion expected in H2 2022).
- June 2020: W. R. Grace & Co. opened a new colloidal silica plant in Germany, expanding its market reach across the EMEA region.
- [Add other relevant milestones with dates and details]: Include other significant events such as new product launches, mergers and acquisitions, or regulatory changes impacting the market.
In-Depth Colloidal Silica Market Market Outlook
The Colloidal Silica market is poised for continued growth, driven by technological innovation, expanding applications, and increasing demand from key end-use sectors. Strategic investments in research and development, coupled with strategic partnerships, will be crucial for success in this dynamic market. The market's future potential is significant, offering attractive opportunities for both established players and new entrants.
Colloidal Silica Market Segmentation
-
1. End-user Industry
- 1.1. Pulp and Paper
- 1.2. Paints and Coatings
- 1.3. Chemicals
- 1.4. Construction
- 1.5. Metals and Metallurgy
- 1.6. Electronics and Semiconductors
- 1.7. Other End-user Industries
Colloidal Silica Market Segmentation By Geography
-
1. Asia Pacific
- 1.1. China
- 1.2. India
- 1.3. Japan
- 1.4. South Korea
- 1.5. Rest of Asia Pacific
-
2. North America
- 2.1. United States
- 2.2. Canada
- 2.3. Mexico
-
3. Europe
- 3.1. Germany
- 3.2. United Kingdom
- 3.3. Italy
- 3.4. France
- 3.5. Rest of Europe
-
4. South America
- 4.1. Brazil
- 4.2. Argentina
- 4.3. Rest of South America
-
5. Middle East and Africa
- 5.1. Saudi Arabia
- 5.2. South Africa
- 5.3. Rest of Middle East and Africa
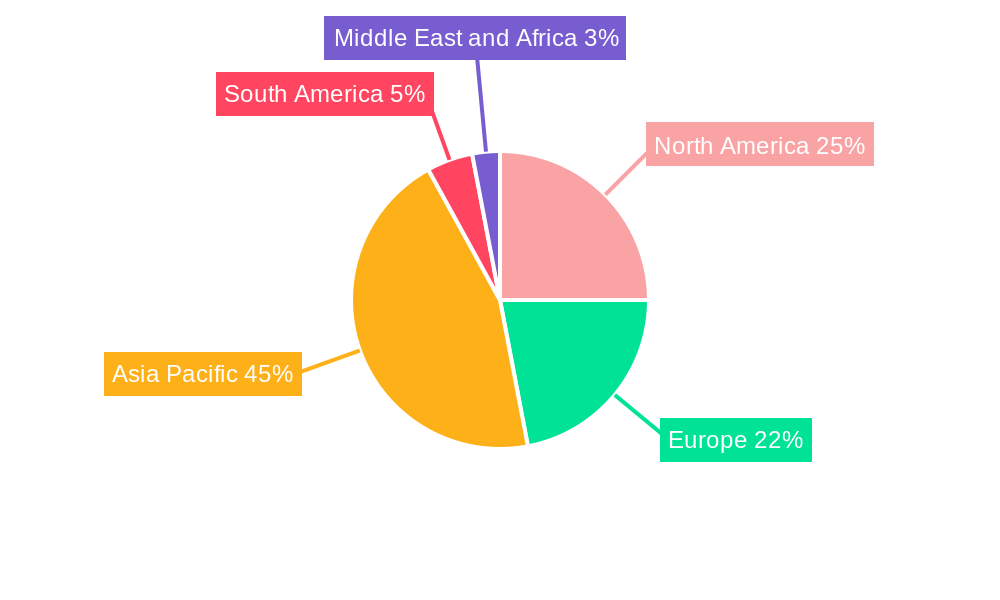
Colloidal Silica Market Regional Market Share
Geographic Coverage of Colloidal Silica Market
Colloidal Silica Market REPORT HIGHLIGHTS
| Aspects | Details |
|---|---|
| Study Period | 2020-2034 |
| Base Year | 2025 |
| Estimated Year | 2026 |
| Forecast Period | 2026-2034 |
| Historical Period | 2020-2025 |
| Growth Rate | CAGR of > 5.00% from 2020-2034 |
| Segmentation |
|
Table of Contents
- 1. Introduction
- 1.1. Research Scope
- 1.2. Market Segmentation
- 1.3. Research Objective
- 1.4. Definitions and Assumptions
- 2. Executive Summary
- 2.1. Market Snapshot
- 3. Market Dynamics
- 3.1. Market Drivers
- 3.2. Market Restrains
- 3.3. Market Trends
- 3.4. Market Opportunities
- 4. Market Factor Analysis
- 4.1. Porters Five Forces
- 4.1.1. Bargaining Power of Suppliers
- 4.1.2. Bargaining Power of Buyers
- 4.1.3. Threat of New Entrants
- 4.1.4. Threat of Substitutes
- 4.1.5. Competitive Rivalry
- 4.2. PESTEL analysis
- 4.3. BCG Analysis
- 4.3.1. Stars (High Growth, High Market Share)
- 4.3.2. Cash Cows (Low Growth, High Market Share)
- 4.3.3. Question Mark (High Growth, Low Market Share)
- 4.3.4. Dogs (Low Growth, Low Market Share)
- 4.4. Ansoff Matrix Analysis
- 4.5. Supply Chain Analysis
- 4.6. Regulatory Landscape
- 4.7. Current Market Potential and Opportunity Assessment (TAM–SAM–SOM Framework)
- 4.8. VDR Analyst Note
- 4.1. Porters Five Forces
- 5. Market Analysis, Insights and Forecast 2021-2033
- 5.1. Market Analysis, Insights and Forecast - by End-user Industry
- 5.1.1. Pulp and Paper
- 5.1.2. Paints and Coatings
- 5.1.3. Chemicals
- 5.1.4. Construction
- 5.1.5. Metals and Metallurgy
- 5.1.6. Electronics and Semiconductors
- 5.1.7. Other End-user Industries
- 5.2. Market Analysis, Insights and Forecast - by Region
- 5.2.1. Asia Pacific
- 5.2.2. North America
- 5.2.3. Europe
- 5.2.4. South America
- 5.2.5. Middle East and Africa
- 5.1. Market Analysis, Insights and Forecast - by End-user Industry
- 6. Global Colloidal Silica Market Analysis, Insights and Forecast, 2021-2033
- 6.1. Market Analysis, Insights and Forecast - by End-user Industry
- 6.1.1. Pulp and Paper
- 6.1.2. Paints and Coatings
- 6.1.3. Chemicals
- 6.1.4. Construction
- 6.1.5. Metals and Metallurgy
- 6.1.6. Electronics and Semiconductors
- 6.1.7. Other End-user Industries
- 6.1. Market Analysis, Insights and Forecast - by End-user Industry
- 7. Asia Pacific Colloidal Silica Market Analysis, Insights and Forecast, 2021-2033
- 7.1. Market Analysis, Insights and Forecast - by End-user Industry
- 7.1.1. Pulp and Paper
- 7.1.2. Paints and Coatings
- 7.1.3. Chemicals
- 7.1.4. Construction
- 7.1.5. Metals and Metallurgy
- 7.1.6. Electronics and Semiconductors
- 7.1.7. Other End-user Industries
- 7.1. Market Analysis, Insights and Forecast - by End-user Industry
- 8. North America Colloidal Silica Market Analysis, Insights and Forecast, 2021-2033
- 8.1. Market Analysis, Insights and Forecast - by End-user Industry
- 8.1.1. Pulp and Paper
- 8.1.2. Paints and Coatings
- 8.1.3. Chemicals
- 8.1.4. Construction
- 8.1.5. Metals and Metallurgy
- 8.1.6. Electronics and Semiconductors
- 8.1.7. Other End-user Industries
- 8.1. Market Analysis, Insights and Forecast - by End-user Industry
- 9. Europe Colloidal Silica Market Analysis, Insights and Forecast, 2021-2033
- 9.1. Market Analysis, Insights and Forecast - by End-user Industry
- 9.1.1. Pulp and Paper
- 9.1.2. Paints and Coatings
- 9.1.3. Chemicals
- 9.1.4. Construction
- 9.1.5. Metals and Metallurgy
- 9.1.6. Electronics and Semiconductors
- 9.1.7. Other End-user Industries
- 9.1. Market Analysis, Insights and Forecast - by End-user Industry
- 10. South America Colloidal Silica Market Analysis, Insights and Forecast, 2021-2033
- 10.1. Market Analysis, Insights and Forecast - by End-user Industry
- 10.1.1. Pulp and Paper
- 10.1.2. Paints and Coatings
- 10.1.3. Chemicals
- 10.1.4. Construction
- 10.1.5. Metals and Metallurgy
- 10.1.6. Electronics and Semiconductors
- 10.1.7. Other End-user Industries
- 10.1. Market Analysis, Insights and Forecast - by End-user Industry
- 11. Middle East and Africa Colloidal Silica Market Analysis, Insights and Forecast, 2021-2033
- 11.1. Market Analysis, Insights and Forecast - by End-user Industry
- 11.1.1. Pulp and Paper
- 11.1.2. Paints and Coatings
- 11.1.3. Chemicals
- 11.1.4. Construction
- 11.1.5. Metals and Metallurgy
- 11.1.6. Electronics and Semiconductors
- 11.1.7. Other End-user Industries
- 11.1. Market Analysis, Insights and Forecast - by End-user Industry
- 12. Competitive Analysis
- 12.1. Company Profiles
- 12.1.1 Ecolab
- 12.1.1.1. Company Overview
- 12.1.1.2. Products
- 12.1.1.3. Company Financials
- 12.1.1.4. SWOT Analysis
- 12.1.2 AMS Applied Material Solutions
- 12.1.2.1. Company Overview
- 12.1.2.2. Products
- 12.1.2.3. Company Financials
- 12.1.2.4. SWOT Analysis
- 12.1.3 Nissan Chemical Corporation
- 12.1.3.1. Company Overview
- 12.1.3.2. Products
- 12.1.3.3. Company Financials
- 12.1.3.4. SWOT Analysis
- 12.1.4 Ted Pella Inc
- 12.1.4.1. Company Overview
- 12.1.4.2. Products
- 12.1.4.3. Company Financials
- 12.1.4.4. SWOT Analysis
- 12.1.5 W R Grace & Co *List Not Exhaustive
- 12.1.5.1. Company Overview
- 12.1.5.2. Products
- 12.1.5.3. Company Financials
- 12.1.5.4. SWOT Analysis
- 12.1.6 Cabot Corporation
- 12.1.6.1. Company Overview
- 12.1.6.2. Products
- 12.1.6.3. Company Financials
- 12.1.6.4. SWOT Analysis
- 12.1.7 Nyacol
- 12.1.7.1. Company Overview
- 12.1.7.2. Products
- 12.1.7.3. Company Financials
- 12.1.7.4. SWOT Analysis
- 12.1.8 FUSO CHEMICAL CO LTD
- 12.1.8.1. Company Overview
- 12.1.8.2. Products
- 12.1.8.3. Company Financials
- 12.1.8.4. SWOT Analysis
- 12.1.9 Nouryan
- 12.1.9.1. Company Overview
- 12.1.9.2. Products
- 12.1.9.3. Company Financials
- 12.1.9.4. SWOT Analysis
- 12.1.10 CWK Chemiewerk Bad Kstritz GmbH
- 12.1.10.1. Company Overview
- 12.1.10.2. Products
- 12.1.10.3. Company Financials
- 12.1.10.4. SWOT Analysis
- 12.1.11 Linyi Kehan Silicon Products Co LTD
- 12.1.11.1. Company Overview
- 12.1.11.2. Products
- 12.1.11.3. Company Financials
- 12.1.11.4. SWOT Analysis
- 12.1.12 Sterling Chemicals
- 12.1.12.1. Company Overview
- 12.1.12.2. Products
- 12.1.12.3. Company Financials
- 12.1.12.4. SWOT Analysis
- 12.1.13 Jinan Yinfeng Silicon Products Co Ltd
- 12.1.13.1. Company Overview
- 12.1.13.2. Products
- 12.1.13.3. Company Financials
- 12.1.13.4. SWOT Analysis
- 12.1.14 Akasel
- 12.1.14.1. Company Overview
- 12.1.14.2. Products
- 12.1.14.3. Company Financials
- 12.1.14.4. SWOT Analysis
- 12.1.15 Evonik
- 12.1.15.1. Company Overview
- 12.1.15.2. Products
- 12.1.15.3. Company Financials
- 12.1.15.4. SWOT Analysis
- 12.1.1 Ecolab
- 12.2. Market Entropy
- 12.2.1 Company's Key Areas Served
- 12.2.2 Recent Developments
- 12.3. Company Market Share Analysis 2025
- 12.3.1 Top 5 Companies Market Share Analysis
- 12.3.2 Top 3 Companies Market Share Analysis
- 12.4. List of Potential Customers
- 13. Research Methodology
List of Figures
- Figure 1: Global Colloidal Silica Market Revenue Breakdown (Million, %) by Region 2025 & 2033
- Figure 2: Global Colloidal Silica Market Volume Breakdown (K Tons, %) by Region 2025 & 2033
- Figure 3: Asia Pacific Colloidal Silica Market Revenue (Million), by End-user Industry 2025 & 2033
- Figure 4: Asia Pacific Colloidal Silica Market Volume (K Tons), by End-user Industry 2025 & 2033
- Figure 5: Asia Pacific Colloidal Silica Market Revenue Share (%), by End-user Industry 2025 & 2033
- Figure 6: Asia Pacific Colloidal Silica Market Volume Share (%), by End-user Industry 2025 & 2033
- Figure 7: Asia Pacific Colloidal Silica Market Revenue (Million), by Country 2025 & 2033
- Figure 8: Asia Pacific Colloidal Silica Market Volume (K Tons), by Country 2025 & 2033
- Figure 9: Asia Pacific Colloidal Silica Market Revenue Share (%), by Country 2025 & 2033
- Figure 10: Asia Pacific Colloidal Silica Market Volume Share (%), by Country 2025 & 2033
- Figure 11: North America Colloidal Silica Market Revenue (Million), by End-user Industry 2025 & 2033
- Figure 12: North America Colloidal Silica Market Volume (K Tons), by End-user Industry 2025 & 2033
- Figure 13: North America Colloidal Silica Market Revenue Share (%), by End-user Industry 2025 & 2033
- Figure 14: North America Colloidal Silica Market Volume Share (%), by End-user Industry 2025 & 2033
- Figure 15: North America Colloidal Silica Market Revenue (Million), by Country 2025 & 2033
- Figure 16: North America Colloidal Silica Market Volume (K Tons), by Country 2025 & 2033
- Figure 17: North America Colloidal Silica Market Revenue Share (%), by Country 2025 & 2033
- Figure 18: North America Colloidal Silica Market Volume Share (%), by Country 2025 & 2033
- Figure 19: Europe Colloidal Silica Market Revenue (Million), by End-user Industry 2025 & 2033
- Figure 20: Europe Colloidal Silica Market Volume (K Tons), by End-user Industry 2025 & 2033
- Figure 21: Europe Colloidal Silica Market Revenue Share (%), by End-user Industry 2025 & 2033
- Figure 22: Europe Colloidal Silica Market Volume Share (%), by End-user Industry 2025 & 2033
- Figure 23: Europe Colloidal Silica Market Revenue (Million), by Country 2025 & 2033
- Figure 24: Europe Colloidal Silica Market Volume (K Tons), by Country 2025 & 2033
- Figure 25: Europe Colloidal Silica Market Revenue Share (%), by Country 2025 & 2033
- Figure 26: Europe Colloidal Silica Market Volume Share (%), by Country 2025 & 2033
- Figure 27: South America Colloidal Silica Market Revenue (Million), by End-user Industry 2025 & 2033
- Figure 28: South America Colloidal Silica Market Volume (K Tons), by End-user Industry 2025 & 2033
- Figure 29: South America Colloidal Silica Market Revenue Share (%), by End-user Industry 2025 & 2033
- Figure 30: South America Colloidal Silica Market Volume Share (%), by End-user Industry 2025 & 2033
- Figure 31: South America Colloidal Silica Market Revenue (Million), by Country 2025 & 2033
- Figure 32: South America Colloidal Silica Market Volume (K Tons), by Country 2025 & 2033
- Figure 33: South America Colloidal Silica Market Revenue Share (%), by Country 2025 & 2033
- Figure 34: South America Colloidal Silica Market Volume Share (%), by Country 2025 & 2033
- Figure 35: Middle East and Africa Colloidal Silica Market Revenue (Million), by End-user Industry 2025 & 2033
- Figure 36: Middle East and Africa Colloidal Silica Market Volume (K Tons), by End-user Industry 2025 & 2033
- Figure 37: Middle East and Africa Colloidal Silica Market Revenue Share (%), by End-user Industry 2025 & 2033
- Figure 38: Middle East and Africa Colloidal Silica Market Volume Share (%), by End-user Industry 2025 & 2033
- Figure 39: Middle East and Africa Colloidal Silica Market Revenue (Million), by Country 2025 & 2033
- Figure 40: Middle East and Africa Colloidal Silica Market Volume (K Tons), by Country 2025 & 2033
- Figure 41: Middle East and Africa Colloidal Silica Market Revenue Share (%), by Country 2025 & 2033
- Figure 42: Middle East and Africa Colloidal Silica Market Volume Share (%), by Country 2025 & 2033
List of Tables
- Table 1: Global Colloidal Silica Market Revenue Million Forecast, by End-user Industry 2020 & 2033
- Table 2: Global Colloidal Silica Market Volume K Tons Forecast, by End-user Industry 2020 & 2033
- Table 3: Global Colloidal Silica Market Revenue Million Forecast, by Region 2020 & 2033
- Table 4: Global Colloidal Silica Market Volume K Tons Forecast, by Region 2020 & 2033
- Table 5: Global Colloidal Silica Market Revenue Million Forecast, by End-user Industry 2020 & 2033
- Table 6: Global Colloidal Silica Market Volume K Tons Forecast, by End-user Industry 2020 & 2033
- Table 7: Global Colloidal Silica Market Revenue Million Forecast, by Country 2020 & 2033
- Table 8: Global Colloidal Silica Market Volume K Tons Forecast, by Country 2020 & 2033
- Table 9: China Colloidal Silica Market Revenue (Million) Forecast, by Application 2020 & 2033
- Table 10: China Colloidal Silica Market Volume (K Tons) Forecast, by Application 2020 & 2033
- Table 11: India Colloidal Silica Market Revenue (Million) Forecast, by Application 2020 & 2033
- Table 12: India Colloidal Silica Market Volume (K Tons) Forecast, by Application 2020 & 2033
- Table 13: Japan Colloidal Silica Market Revenue (Million) Forecast, by Application 2020 & 2033
- Table 14: Japan Colloidal Silica Market Volume (K Tons) Forecast, by Application 2020 & 2033
- Table 15: South Korea Colloidal Silica Market Revenue (Million) Forecast, by Application 2020 & 2033
- Table 16: South Korea Colloidal Silica Market Volume (K Tons) Forecast, by Application 2020 & 2033
- Table 17: Rest of Asia Pacific Colloidal Silica Market Revenue (Million) Forecast, by Application 2020 & 2033
- Table 18: Rest of Asia Pacific Colloidal Silica Market Volume (K Tons) Forecast, by Application 2020 & 2033
- Table 19: Global Colloidal Silica Market Revenue Million Forecast, by End-user Industry 2020 & 2033
- Table 20: Global Colloidal Silica Market Volume K Tons Forecast, by End-user Industry 2020 & 2033
- Table 21: Global Colloidal Silica Market Revenue Million Forecast, by Country 2020 & 2033
- Table 22: Global Colloidal Silica Market Volume K Tons Forecast, by Country 2020 & 2033
- Table 23: United States Colloidal Silica Market Revenue (Million) Forecast, by Application 2020 & 2033
- Table 24: United States Colloidal Silica Market Volume (K Tons) Forecast, by Application 2020 & 2033
- Table 25: Canada Colloidal Silica Market Revenue (Million) Forecast, by Application 2020 & 2033
- Table 26: Canada Colloidal Silica Market Volume (K Tons) Forecast, by Application 2020 & 2033
- Table 27: Mexico Colloidal Silica Market Revenue (Million) Forecast, by Application 2020 & 2033
- Table 28: Mexico Colloidal Silica Market Volume (K Tons) Forecast, by Application 2020 & 2033
- Table 29: Global Colloidal Silica Market Revenue Million Forecast, by End-user Industry 2020 & 2033
- Table 30: Global Colloidal Silica Market Volume K Tons Forecast, by End-user Industry 2020 & 2033
- Table 31: Global Colloidal Silica Market Revenue Million Forecast, by Country 2020 & 2033
- Table 32: Global Colloidal Silica Market Volume K Tons Forecast, by Country 2020 & 2033
- Table 33: Germany Colloidal Silica Market Revenue (Million) Forecast, by Application 2020 & 2033
- Table 34: Germany Colloidal Silica Market Volume (K Tons) Forecast, by Application 2020 & 2033
- Table 35: United Kingdom Colloidal Silica Market Revenue (Million) Forecast, by Application 2020 & 2033
- Table 36: United Kingdom Colloidal Silica Market Volume (K Tons) Forecast, by Application 2020 & 2033
- Table 37: Italy Colloidal Silica Market Revenue (Million) Forecast, by Application 2020 & 2033
- Table 38: Italy Colloidal Silica Market Volume (K Tons) Forecast, by Application 2020 & 2033
- Table 39: France Colloidal Silica Market Revenue (Million) Forecast, by Application 2020 & 2033
- Table 40: France Colloidal Silica Market Volume (K Tons) Forecast, by Application 2020 & 2033
- Table 41: Rest of Europe Colloidal Silica Market Revenue (Million) Forecast, by Application 2020 & 2033
- Table 42: Rest of Europe Colloidal Silica Market Volume (K Tons) Forecast, by Application 2020 & 2033
- Table 43: Global Colloidal Silica Market Revenue Million Forecast, by End-user Industry 2020 & 2033
- Table 44: Global Colloidal Silica Market Volume K Tons Forecast, by End-user Industry 2020 & 2033
- Table 45: Global Colloidal Silica Market Revenue Million Forecast, by Country 2020 & 2033
- Table 46: Global Colloidal Silica Market Volume K Tons Forecast, by Country 2020 & 2033
- Table 47: Brazil Colloidal Silica Market Revenue (Million) Forecast, by Application 2020 & 2033
- Table 48: Brazil Colloidal Silica Market Volume (K Tons) Forecast, by Application 2020 & 2033
- Table 49: Argentina Colloidal Silica Market Revenue (Million) Forecast, by Application 2020 & 2033
- Table 50: Argentina Colloidal Silica Market Volume (K Tons) Forecast, by Application 2020 & 2033
- Table 51: Rest of South America Colloidal Silica Market Revenue (Million) Forecast, by Application 2020 & 2033
- Table 52: Rest of South America Colloidal Silica Market Volume (K Tons) Forecast, by Application 2020 & 2033
- Table 53: Global Colloidal Silica Market Revenue Million Forecast, by End-user Industry 2020 & 2033
- Table 54: Global Colloidal Silica Market Volume K Tons Forecast, by End-user Industry 2020 & 2033
- Table 55: Global Colloidal Silica Market Revenue Million Forecast, by Country 2020 & 2033
- Table 56: Global Colloidal Silica Market Volume K Tons Forecast, by Country 2020 & 2033
- Table 57: Saudi Arabia Colloidal Silica Market Revenue (Million) Forecast, by Application 2020 & 2033
- Table 58: Saudi Arabia Colloidal Silica Market Volume (K Tons) Forecast, by Application 2020 & 2033
- Table 59: South Africa Colloidal Silica Market Revenue (Million) Forecast, by Application 2020 & 2033
- Table 60: South Africa Colloidal Silica Market Volume (K Tons) Forecast, by Application 2020 & 2033
- Table 61: Rest of Middle East and Africa Colloidal Silica Market Revenue (Million) Forecast, by Application 2020 & 2033
- Table 62: Rest of Middle East and Africa Colloidal Silica Market Volume (K Tons) Forecast, by Application 2020 & 2033
Frequently Asked Questions
1. What is the projected Compound Annual Growth Rate (CAGR) of the Colloidal Silica Market?
The projected CAGR is approximately > 5.00%.
2. Which companies are prominent players in the Colloidal Silica Market?
Key companies in the market include Ecolab, AMS Applied Material Solutions, Nissan Chemical Corporation, Ted Pella Inc, W R Grace & Co *List Not Exhaustive, Cabot Corporation, Nyacol, FUSO CHEMICAL CO LTD, Nouryan, CWK Chemiewerk Bad Kstritz GmbH, Linyi Kehan Silicon Products Co LTD, Sterling Chemicals, Jinan Yinfeng Silicon Products Co Ltd, Akasel, Evonik.
3. What are the main segments of the Colloidal Silica Market?
The market segments include End-user Industry.
4. Can you provide details about the market size?
The market size is estimated to be USD 1010 Million as of 2022.
5. What are some drivers contributing to market growth?
Rising Demand for Concrete and Cements in the Construction Industry Globally; Increasing Demand for Silicon wafers for Production of Integrated Circuits in Electronic Devices.
6. What are the notable trends driving market growth?
Increasing Usage in the Construction Industry.
7. Are there any restraints impacting market growth?
Slow Drying Properties of Colloidal Silica; Other Restraints.
8. Can you provide examples of recent developments in the market?
In November 2021, Nouryon announced to increase the production capacity of the colloidal silica manufacturing facility, based in Green Bay, Wisconsin, U.S.A. The increased production capacity will help in meeting demands for packaging and construction end markets. The construction is expected to complete in the second half of 2022.
9. What pricing options are available for accessing the report?
Pricing options include single-user, multi-user, and enterprise licenses priced at USD 4750, USD 5250, and USD 8750 respectively.
10. Is the market size provided in terms of value or volume?
The market size is provided in terms of value, measured in Million and volume, measured in K Tons.
11. Are there any specific market keywords associated with the report?
Yes, the market keyword associated with the report is "Colloidal Silica Market," which aids in identifying and referencing the specific market segment covered.
12. How do I determine which pricing option suits my needs best?
The pricing options vary based on user requirements and access needs. Individual users may opt for single-user licenses, while businesses requiring broader access may choose multi-user or enterprise licenses for cost-effective access to the report.
13. Are there any additional resources or data provided in the Colloidal Silica Market report?
While the report offers comprehensive insights, it's advisable to review the specific contents or supplementary materials provided to ascertain if additional resources or data are available.
14. How can I stay updated on further developments or reports in the Colloidal Silica Market?
To stay informed about further developments, trends, and reports in the Colloidal Silica Market, consider subscribing to industry newsletters, following relevant companies and organizations, or regularly checking reputable industry news sources and publications.
Methodology
Step 1 - Identification of Relevant Samples Size from Population Database


Step 2 - Approaches for Defining Global Market Size (Value, Volume* & Price*)

Note*: In applicable scenarios
Step 3 - Data Sources
Primary Research
- Web Analytics
- Survey Reports
- Research Institute
- Latest Research Reports
- Opinion Leaders
Secondary Research
- Annual Reports
- White Paper
- Latest Press Release
- Industry Association
- Paid Database
- Investor Presentations

Step 4 - Data Triangulation
Involves using different sources of information in order to increase the validity of a study
These sources are likely to be stakeholders in a program - participants, other researchers, program staff, other community members, and so on.
Then we put all data in single framework & apply various statistical tools to find out the dynamic on the market.
During the analysis stage, feedback from the stakeholder groups would be compared to determine areas of agreement as well as areas of divergence