

Key Insights
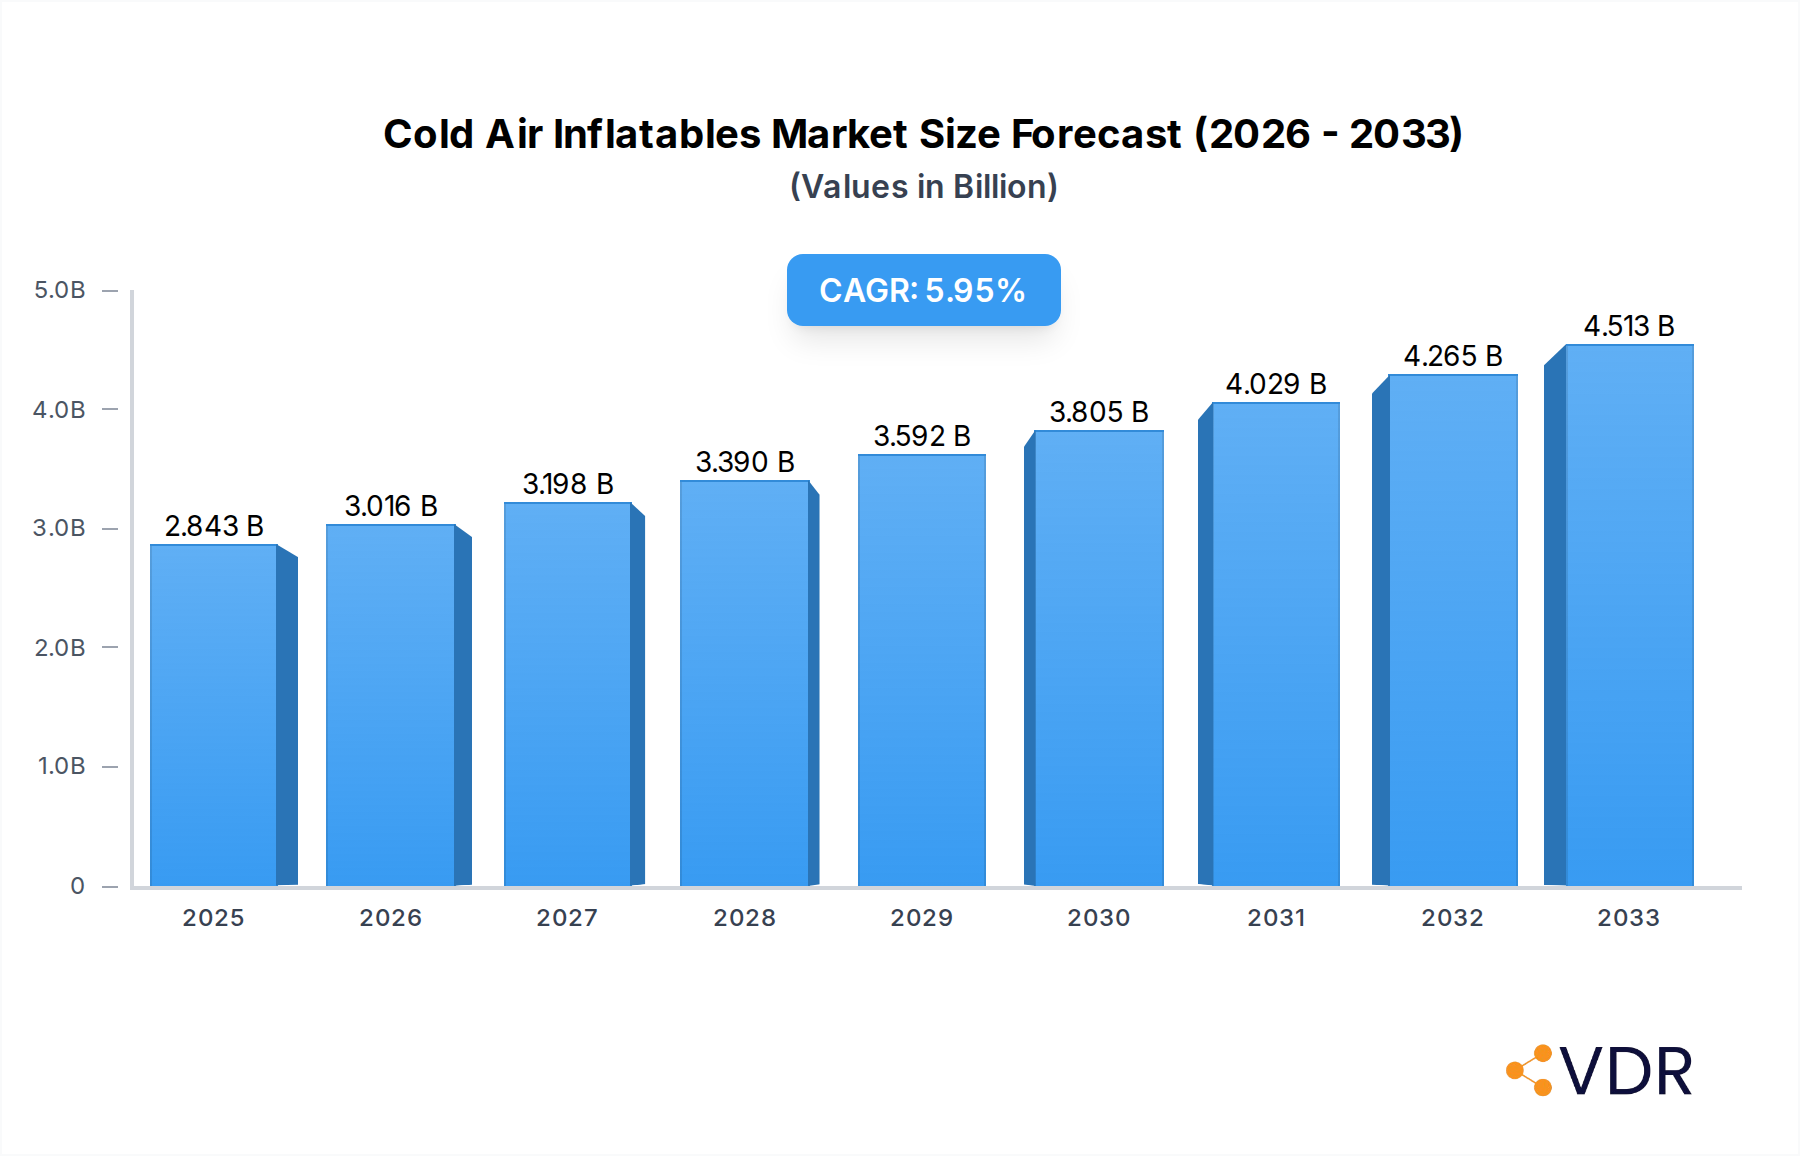
The global Cold Air Inflatables market is poised for substantial growth, projected to reach an impressive USD 2843 million by 2025. This expansion is fueled by a consistent Compound Annual Growth Rate (CAGR) of 6.1% throughout the forecast period of 2025-2033. A primary driver for this market's ascent is the increasing adoption of cold air inflatables in commercial applications, ranging from eye-catching advertising and promotional events to enhancing retail displays. The entertainment sector also significantly contributes, with giant inflatables becoming a staple at festivals, theme parks, and private events, offering immersive and engaging experiences for consumers. The versatility in design, encompassing everything from colossal advertising blimps to custom-shaped attractions, caters to a broad spectrum of marketing and entertainment needs, thus broadening its market appeal and driving demand.

Cold Air Inflatables Market Size (In Billion)
The market's positive trajectory is further supported by emerging trends such as the integration of smart technologies for enhanced interactivity and safety in inflatables, alongside a growing consumer preference for experiential marketing. While the market enjoys robust growth, certain factors may present challenges. The initial investment cost for large-scale or highly customized inflatables can be a restraining factor for smaller businesses. Additionally, logistical considerations, including storage and transportation of these often bulky items, require careful planning. Nevertheless, the continuous innovation in materials and design, coupled with the inherent visual impact and cost-effectiveness of inflatables compared to some traditional advertising methods, are expected to propel the market forward. Key players like Boulder Blimp, Air Ad Promotions, and Inflatable Design Group are actively shaping the market landscape through their innovative offerings and strategic expansions across various regions, particularly in North America and Europe, and increasingly in the burgeoning Asia Pacific market.
Cold Air Inflatables Company Market Share
Cold Air Inflatables Market Dynamics & Structure
The global cold air inflatables market, a dynamic sector characterized by vibrant visual marketing and immersive entertainment solutions, exhibits a moderately concentrated structure. Leading entities such as Boulder Blimp, Air Ad Promotions, Inflatable Design Group, Windship Inflatables, Inflatable Images, Pioneer Balloon, ULTRAMAGIC, and Airquee are actively shaping its trajectory. Technological innovation, particularly in materials science for enhanced durability and flame retardancy, and advanced design software for complex shapes, serves as a primary driver. Regulatory frameworks, often focusing on safety standards for public use and material certifications, present a foundational aspect of market operation. Competitive product substitutes, including traditional signage, static displays, and digital advertising, present a constant challenge, necessitating superior engagement and cost-effectiveness from inflatable solutions. End-user demographics are diverse, spanning commercial advertisers seeking impactful branding, event organizers requiring temporary structures and attractions, and entertainment providers aiming for unique guest experiences. Mergers and acquisitions (M&A) trends are emerging as companies seek to expand their product portfolios, geographical reach, and manufacturing capabilities. For instance, the past few years have seen a moderate volume of strategic acquisitions, with an estimated XX M&A deals valued at over $XX million in aggregate, indicating a consolidating yet expanding industry.
- Market Concentration: Moderately concentrated with key players dominating specialized segments.
- Technological Innovation Drivers: Advanced materials, UV-resistant coatings, energy-efficient inflation systems, and digital printing capabilities.
- Regulatory Frameworks: Emphasis on safety certifications (e.g., NFPA 701), material compliance, and local permitting for public installations.
- Competitive Product Substitutes: Traditional signage, digital billboards, event tents, and temporary architectural structures.
- End-User Demographics: Commercial advertisers, festival organizers, theme parks, educational institutions, and promotional agencies.
- M&A Trends: Driven by a desire for expanded product offerings, market share consolidation, and integration of advanced manufacturing technologies.
Cold Air Inflatables Growth Trends & Insights
The global cold air inflatables market is poised for robust expansion, projecting a significant market size evolution. Driven by increasing demand for eye-catching promotional tools and immersive entertainment experiences, the market is expected to witness a Compound Annual Growth Rate (CAGR) of approximately XX% during the forecast period of 2025–2033. Adoption rates are on an upward trajectory, particularly within the commercial and entertainment segments, as businesses increasingly recognize the cost-effectiveness and high visual impact of inflatables for brand visibility and event engagement. Technological disruptions, such as the integration of LED lighting for enhanced nighttime visibility and interactive features, are further fueling adoption. Consumer behavior shifts towards experiential marketing and memorable brand interactions are a pivotal factor, with cold air inflatables offering a tangible and engaging way to connect with audiences. The market penetration of specialized inflatable types, like giant inflatables and unique special shapes, is expected to deepen as customization capabilities become more sophisticated and accessible.
The market size for cold air inflatables, standing at an estimated $XXX million in the base year of 2025, is forecast to reach an impressive $XXX million by 2033. This growth is underpinned by several key trends. In the commercial sector, businesses are leveraging inflatables for product launches, grand openings, and promotional campaigns, appreciating their portability, reusability, and ability to capture attention in crowded urban environments. The entertainment industry is a major consumer, utilizing inflatables for inflatable theme parks, obstacle courses, sporting events, and festivals, creating unique attractions that draw large crowds.
Technological advancements are playing a crucial role in shaping market dynamics. The development of more durable, lightweight, and weather-resistant materials, such as high-tenacity PVC and TPU, has extended the lifespan and applicability of cold air inflatables, making them suitable for a wider range of environmental conditions. Innovations in digital printing technology allow for highly detailed and vibrant graphics, enabling brands to reproduce their logos and marketing messages with exceptional accuracy and visual appeal. Furthermore, the integration of advanced inflation systems has improved efficiency and reliability, while new design software facilitates the creation of increasingly complex and imaginative shapes.
Consumer preferences are also evolving, with a growing emphasis on experiential marketing. Cold air inflatables provide an unparalleled opportunity for brands to create memorable, interactive experiences that foster deeper customer engagement and brand loyalty. This shift is evident in the rise of temporary inflatable attractions and brand activations that offer unique photo opportunities and immersive environments. The increasing demand for customized solutions, catering to specific brand identities and event themes, is driving innovation in design and manufacturing.
Looking at the adoption rates, the commercial application segment, which accounted for an estimated XX% of the market in 2025, is projected to continue its strong growth, driven by the need for effective outdoor advertising and event marketing. The entertainment segment, representing an estimated XX% in 2025, is also expected to see substantial growth as the demand for unique leisure activities and event attractions rises globally. The market penetration of specialized inflatable types, particularly Giant Inflatables and Special Shape inflatables, is expected to increase as their perceived value in terms of brand impact and engagement potential becomes more widely recognized.
Dominant Regions, Countries, or Segments in Cold Air Inflatables
North America is currently the dominant region in the global cold air inflatables market, driven by a robust commercial advertising landscape and a thriving entertainment industry. The region's strong economic policies, coupled with significant investment in marketing and experiential events, create a fertile ground for inflatable solutions. Key countries within North America, particularly the United States, exhibit high adoption rates across both commercial and entertainment applications. The commercial segment, representing an estimated XX% of the regional market in 2025, benefits from a vast number of businesses seeking innovative ways to enhance brand visibility and attract foot traffic. This includes extensive use of giant inflatables for trade shows, product launches, and roadside advertising.
The entertainment application segment, accounting for approximately XX% of the North American market in 2025, is a significant growth driver. This is fueled by the proliferation of inflatable theme parks, water parks, and sporting events that rely heavily on these structures for attractions and immersive experiences. The demand for special shape inflatables, such as custom-designed mascots and themed structures, is particularly high in this segment, as organizers aim to create unique and memorable events. Infrastructure development, including the construction of new event venues and recreational facilities, further supports the growth of the cold air inflatables market in North America.
The Giant Inflatables type segment is a major contributor to the overall market dominance in North America, capturing an estimated XX% of the market share in 2025. These colossal structures, often exceeding 20 feet in height, are unparalleled in their ability to command attention and create a powerful brand presence. Their application spans from static advertising at festivals and sports stadiums to dynamic displays at corporate events and product activations. The visual impact and memorability associated with giant inflatables make them a preferred choice for businesses aiming for maximum brand recall.
The Commercial application segment within North America is expected to witness a CAGR of XX% from 2025 to 2033, driven by increasing marketing budgets and the need for differentiated advertising strategies. The ease of deployment, reusability, and cost-effectiveness compared to traditional advertising methods make cold air inflatables an attractive option for a wide range of businesses, from retail giants to local enterprises. The flexibility to customize designs to match specific brand aesthetics and promotional messages further enhances their appeal.
In terms of growth potential, while North America currently leads, the Asia-Pacific region is emerging as a significant growth frontier. Rapid economic development, increasing disposable incomes, and a growing middle class are fueling demand for entertainment and promotional activities. Countries like China and India present vast untapped markets with a rising awareness of experiential marketing techniques. The adoption of cold air inflatables is expected to accelerate in these regions as local businesses and event organizers recognize their potential for impactful brand communication and engaging entertainment.
Cold Air Inflatables Product Landscape
The cold air inflatables product landscape is characterized by continuous innovation in design, materials, and functionality. Key product categories include Giant Inflatables, designed for maximum visual impact and brand presence, often custom-shaped to represent mascots, products, or iconic structures. Special Shape inflatables offer bespoke solutions, catering to unique event themes or brand narratives, allowing for unparalleled creative expression. The 'Others' category encompasses a broad range of products such as inflatable arches, air dancers, promotional characters, and temporary event structures. Advancements in UV-resistant coatings and flame-retardant materials enhance durability and safety, while integrated LED lighting systems provide striking visual appeal for nighttime events. Unique selling propositions lie in their ability to be rapidly deployed, deflated, and transported, offering unparalleled flexibility and cost-effectiveness for temporary branding and entertainment needs.
Key Drivers, Barriers & Challenges in Cold Air Inflatables
Key Drivers:
- Growing Demand for Experiential Marketing: Businesses are increasingly investing in immersive brand experiences to engage consumers, with inflatables offering a unique and cost-effective solution.
- Cost-Effectiveness and Reusability: Inflatables provide a high return on investment due to their durability, reusability, and lower production costs compared to many traditional advertising mediums.
- Versatility in Applications: Their adaptability across commercial promotions, entertainment events, festivals, and sports ensures a broad and consistent demand.
- Technological Advancements: Innovations in materials (e.g., stronger, lighter fabrics) and digital printing enable more intricate designs and enhanced visual appeal, driving adoption.
Barriers & Challenges:
- Weather Dependency: Performance can be affected by adverse weather conditions such as strong winds, heavy rain, or extreme temperatures, requiring careful installation and management.
- Regulatory Compliance: Navigating local permits and safety regulations for public installations can be complex and time-consuming.
- Supply Chain Disruptions: Reliance on specific raw materials and manufacturing processes can lead to vulnerabilities in the supply chain, impacting lead times and costs.
- Competition from Digital Advertising: The ever-growing digital advertising space presents a constant challenge for market share, requiring inflatables to demonstrate clear advantages in physical engagement.
Emerging Opportunities in Cold Air Inflatables
Emerging opportunities in the cold air inflatables market lie in the expansion of interactive and tech-integrated inflatables. The integration of augmented reality (AR) overlays triggered by specific inflatable designs presents a novel way to blend physical and digital experiences, enhancing engagement and data capture. Untapped markets in developing economies, particularly in regions with a burgeoning middle class and increasing disposable income, offer significant growth potential as awareness of experiential marketing grows. Innovative applications in educational settings, such as creating immersive learning environments or interactive exhibits, also represent a nascent but promising avenue. The growing trend of sustainable events is also creating opportunities for manufacturers offering eco-friendly inflatable materials and energy-efficient inflation solutions.
Growth Accelerators in the Cold Air Inflatables Industry
Several factors are accelerating long-term growth in the cold air inflatables industry. Continuous technological breakthroughs in material science, leading to lighter, stronger, and more eco-friendly inflatable fabrics, are expanding application possibilities and enhancing product lifespan. Strategic partnerships between inflatable manufacturers and event management companies, as well as marketing agencies, are crucial for expanding market reach and developing integrated promotional campaigns. Furthermore, market expansion strategies focusing on emerging economies and niche applications, such as personalized inflatables for smaller businesses or specific sports events, will drive sustained growth. The increasing adoption of customization services, allowing clients to create unique, brand-specific designs, is a significant catalyst for higher value sales and customer loyalty.
Key Players Shaping the Cold Air Inflatables Market
- Boulder Blimp
- Air Ad Promotions
- Inflatable Design Group
- Windship Inflatables
- Inflatable Images
- Pioneer Balloon
- ULTRAMAGIC
- Airquee
Notable Milestones in Cold Air Inflatables Sector
- 2019: Increased adoption of digital printing for highly detailed graphics, boosting customization options.
- 2020: Enhanced focus on safety certifications and flame-retardant materials due to evolving event regulations.
- 2021: Introduction of energy-efficient, low-noise inflation systems to reduce operational costs and environmental impact.
- 2022: Significant growth in demand for custom-shaped inflatables for product launches and brand activations.
- 2023: Emerging trend of integrating LED lighting for enhanced visual appeal and nighttime event illumination.
- 2024: Increased M&A activity as larger players seek to consolidate market share and expand product portfolios.
In-Depth Cold Air Inflatables Market Outlook
The future outlook for the cold air inflatables market is exceptionally bright, driven by persistent demand for impactful promotional tools and engaging entertainment solutions. Growth accelerators such as advancements in sustainable materials, the integration of smart technologies for interactive experiences, and expanding market penetration in developing regions will propel the industry forward. Strategic collaborations with diverse industry stakeholders and a continued focus on bespoke design and unparalleled visual branding will ensure sustained market expansion. The market is well-positioned to capitalize on the growing consumer preference for experiential marketing and memorable brand interactions, projecting significant growth and innovation in the coming years.
Cold Air Inflatables Segmentation
-
1. Application
- 1.1. Commercial
- 1.2. Entertainment
-
2. Types
- 2.1. Gaint Inflatables
- 2.2. Special Shape
- 2.3. Others
Cold Air Inflatables Segmentation By Geography
-
1. North America
- 1.1. United States
- 1.2. Canada
- 1.3. Mexico
-
2. South America
- 2.1. Brazil
- 2.2. Argentina
- 2.3. Rest of South America
-
3. Europe
- 3.1. United Kingdom
- 3.2. Germany
- 3.3. France
- 3.4. Italy
- 3.5. Spain
- 3.6. Russia
- 3.7. Benelux
- 3.8. Nordics
- 3.9. Rest of Europe
-
4. Middle East & Africa
- 4.1. Turkey
- 4.2. Israel
- 4.3. GCC
- 4.4. North Africa
- 4.5. South Africa
- 4.6. Rest of Middle East & Africa
-
5. Asia Pacific
- 5.1. China
- 5.2. India
- 5.3. Japan
- 5.4. South Korea
- 5.5. ASEAN
- 5.6. Oceania
- 5.7. Rest of Asia Pacific
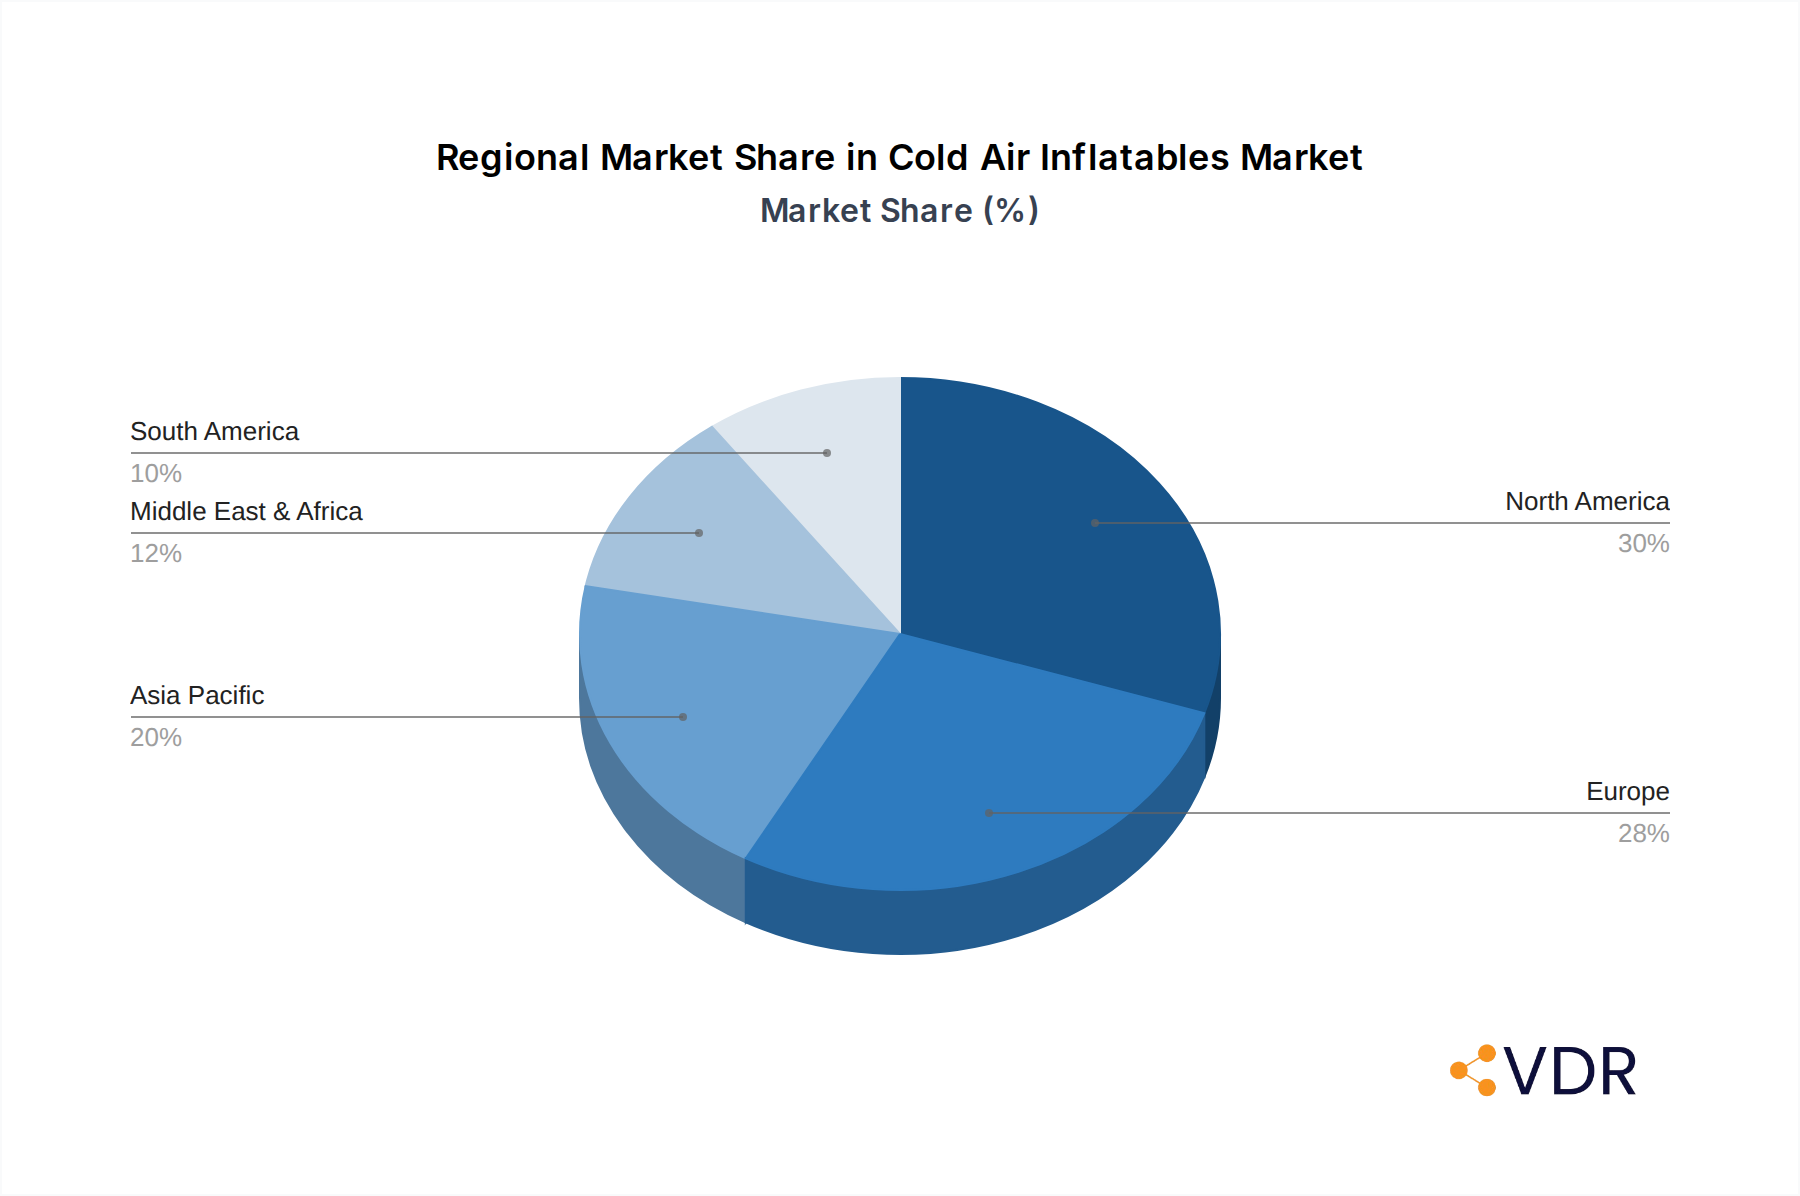
Cold Air Inflatables Regional Market Share
Geographic Coverage of Cold Air Inflatables
Cold Air Inflatables REPORT HIGHLIGHTS
| Aspects | Details |
|---|---|
| Study Period | 2020-2034 |
| Base Year | 2025 |
| Estimated Year | 2026 |
| Forecast Period | 2026-2034 |
| Historical Period | 2020-2025 |
| Growth Rate | CAGR of 6.1% from 2020-2034 |
| Segmentation |
|
Table of Contents
- 1. Introduction
- 1.1. Research Scope
- 1.2. Market Segmentation
- 1.3. Research Methodology
- 1.4. Definitions and Assumptions
- 2. Executive Summary
- 2.1. Introduction
- 3. Market Dynamics
- 3.1. Introduction
- 3.2. Market Drivers
- 3.3. Market Restrains
- 3.4. Market Trends
- 4. Market Factor Analysis
- 4.1. Porters Five Forces
- 4.2. Supply/Value Chain
- 4.3. PESTEL analysis
- 4.4. Market Entropy
- 4.5. Patent/Trademark Analysis
- 5. Global Cold Air Inflatables Analysis, Insights and Forecast, 2020-2032
- 5.1. Market Analysis, Insights and Forecast - by Application
- 5.1.1. Commercial
- 5.1.2. Entertainment
- 5.2. Market Analysis, Insights and Forecast - by Types
- 5.2.1. Gaint Inflatables
- 5.2.2. Special Shape
- 5.2.3. Others
- 5.3. Market Analysis, Insights and Forecast - by Region
- 5.3.1. North America
- 5.3.2. South America
- 5.3.3. Europe
- 5.3.4. Middle East & Africa
- 5.3.5. Asia Pacific
- 5.1. Market Analysis, Insights and Forecast - by Application
- 6. North America Cold Air Inflatables Analysis, Insights and Forecast, 2020-2032
- 6.1. Market Analysis, Insights and Forecast - by Application
- 6.1.1. Commercial
- 6.1.2. Entertainment
- 6.2. Market Analysis, Insights and Forecast - by Types
- 6.2.1. Gaint Inflatables
- 6.2.2. Special Shape
- 6.2.3. Others
- 6.1. Market Analysis, Insights and Forecast - by Application
- 7. South America Cold Air Inflatables Analysis, Insights and Forecast, 2020-2032
- 7.1. Market Analysis, Insights and Forecast - by Application
- 7.1.1. Commercial
- 7.1.2. Entertainment
- 7.2. Market Analysis, Insights and Forecast - by Types
- 7.2.1. Gaint Inflatables
- 7.2.2. Special Shape
- 7.2.3. Others
- 7.1. Market Analysis, Insights and Forecast - by Application
- 8. Europe Cold Air Inflatables Analysis, Insights and Forecast, 2020-2032
- 8.1. Market Analysis, Insights and Forecast - by Application
- 8.1.1. Commercial
- 8.1.2. Entertainment
- 8.2. Market Analysis, Insights and Forecast - by Types
- 8.2.1. Gaint Inflatables
- 8.2.2. Special Shape
- 8.2.3. Others
- 8.1. Market Analysis, Insights and Forecast - by Application
- 9. Middle East & Africa Cold Air Inflatables Analysis, Insights and Forecast, 2020-2032
- 9.1. Market Analysis, Insights and Forecast - by Application
- 9.1.1. Commercial
- 9.1.2. Entertainment
- 9.2. Market Analysis, Insights and Forecast - by Types
- 9.2.1. Gaint Inflatables
- 9.2.2. Special Shape
- 9.2.3. Others
- 9.1. Market Analysis, Insights and Forecast - by Application
- 10. Asia Pacific Cold Air Inflatables Analysis, Insights and Forecast, 2020-2032
- 10.1. Market Analysis, Insights and Forecast - by Application
- 10.1.1. Commercial
- 10.1.2. Entertainment
- 10.2. Market Analysis, Insights and Forecast - by Types
- 10.2.1. Gaint Inflatables
- 10.2.2. Special Shape
- 10.2.3. Others
- 10.1. Market Analysis, Insights and Forecast - by Application
- 11. Competitive Analysis
- 11.1. Global Market Share Analysis 2025
- 11.2. Company Profiles
- 11.2.1 Boulder Blimp
- 11.2.1.1. Overview
- 11.2.1.2. Products
- 11.2.1.3. SWOT Analysis
- 11.2.1.4. Recent Developments
- 11.2.1.5. Financials (Based on Availability)
- 11.2.2 Air Ad Promotions
- 11.2.2.1. Overview
- 11.2.2.2. Products
- 11.2.2.3. SWOT Analysis
- 11.2.2.4. Recent Developments
- 11.2.2.5. Financials (Based on Availability)
- 11.2.3 Inflatable Design Group
- 11.2.3.1. Overview
- 11.2.3.2. Products
- 11.2.3.3. SWOT Analysis
- 11.2.3.4. Recent Developments
- 11.2.3.5. Financials (Based on Availability)
- 11.2.4 Windship Inflatables
- 11.2.4.1. Overview
- 11.2.4.2. Products
- 11.2.4.3. SWOT Analysis
- 11.2.4.4. Recent Developments
- 11.2.4.5. Financials (Based on Availability)
- 11.2.5 Inflatable Images
- 11.2.5.1. Overview
- 11.2.5.2. Products
- 11.2.5.3. SWOT Analysis
- 11.2.5.4. Recent Developments
- 11.2.5.5. Financials (Based on Availability)
- 11.2.6 Pioneer Balloon
- 11.2.6.1. Overview
- 11.2.6.2. Products
- 11.2.6.3. SWOT Analysis
- 11.2.6.4. Recent Developments
- 11.2.6.5. Financials (Based on Availability)
- 11.2.7 ULTRAMAGIC
- 11.2.7.1. Overview
- 11.2.7.2. Products
- 11.2.7.3. SWOT Analysis
- 11.2.7.4. Recent Developments
- 11.2.7.5. Financials (Based on Availability)
- 11.2.8 Airquee
- 11.2.8.1. Overview
- 11.2.8.2. Products
- 11.2.8.3. SWOT Analysis
- 11.2.8.4. Recent Developments
- 11.2.8.5. Financials (Based on Availability)
- 11.2.1 Boulder Blimp
List of Figures
- Figure 1: Global Cold Air Inflatables Revenue Breakdown (million, %) by Region 2025 & 2033
- Figure 2: Global Cold Air Inflatables Volume Breakdown (K, %) by Region 2025 & 2033
- Figure 3: North America Cold Air Inflatables Revenue (million), by Application 2025 & 2033
- Figure 4: North America Cold Air Inflatables Volume (K), by Application 2025 & 2033
- Figure 5: North America Cold Air Inflatables Revenue Share (%), by Application 2025 & 2033
- Figure 6: North America Cold Air Inflatables Volume Share (%), by Application 2025 & 2033
- Figure 7: North America Cold Air Inflatables Revenue (million), by Types 2025 & 2033
- Figure 8: North America Cold Air Inflatables Volume (K), by Types 2025 & 2033
- Figure 9: North America Cold Air Inflatables Revenue Share (%), by Types 2025 & 2033
- Figure 10: North America Cold Air Inflatables Volume Share (%), by Types 2025 & 2033
- Figure 11: North America Cold Air Inflatables Revenue (million), by Country 2025 & 2033
- Figure 12: North America Cold Air Inflatables Volume (K), by Country 2025 & 2033
- Figure 13: North America Cold Air Inflatables Revenue Share (%), by Country 2025 & 2033
- Figure 14: North America Cold Air Inflatables Volume Share (%), by Country 2025 & 2033
- Figure 15: South America Cold Air Inflatables Revenue (million), by Application 2025 & 2033
- Figure 16: South America Cold Air Inflatables Volume (K), by Application 2025 & 2033
- Figure 17: South America Cold Air Inflatables Revenue Share (%), by Application 2025 & 2033
- Figure 18: South America Cold Air Inflatables Volume Share (%), by Application 2025 & 2033
- Figure 19: South America Cold Air Inflatables Revenue (million), by Types 2025 & 2033
- Figure 20: South America Cold Air Inflatables Volume (K), by Types 2025 & 2033
- Figure 21: South America Cold Air Inflatables Revenue Share (%), by Types 2025 & 2033
- Figure 22: South America Cold Air Inflatables Volume Share (%), by Types 2025 & 2033
- Figure 23: South America Cold Air Inflatables Revenue (million), by Country 2025 & 2033
- Figure 24: South America Cold Air Inflatables Volume (K), by Country 2025 & 2033
- Figure 25: South America Cold Air Inflatables Revenue Share (%), by Country 2025 & 2033
- Figure 26: South America Cold Air Inflatables Volume Share (%), by Country 2025 & 2033
- Figure 27: Europe Cold Air Inflatables Revenue (million), by Application 2025 & 2033
- Figure 28: Europe Cold Air Inflatables Volume (K), by Application 2025 & 2033
- Figure 29: Europe Cold Air Inflatables Revenue Share (%), by Application 2025 & 2033
- Figure 30: Europe Cold Air Inflatables Volume Share (%), by Application 2025 & 2033
- Figure 31: Europe Cold Air Inflatables Revenue (million), by Types 2025 & 2033
- Figure 32: Europe Cold Air Inflatables Volume (K), by Types 2025 & 2033
- Figure 33: Europe Cold Air Inflatables Revenue Share (%), by Types 2025 & 2033
- Figure 34: Europe Cold Air Inflatables Volume Share (%), by Types 2025 & 2033
- Figure 35: Europe Cold Air Inflatables Revenue (million), by Country 2025 & 2033
- Figure 36: Europe Cold Air Inflatables Volume (K), by Country 2025 & 2033
- Figure 37: Europe Cold Air Inflatables Revenue Share (%), by Country 2025 & 2033
- Figure 38: Europe Cold Air Inflatables Volume Share (%), by Country 2025 & 2033
- Figure 39: Middle East & Africa Cold Air Inflatables Revenue (million), by Application 2025 & 2033
- Figure 40: Middle East & Africa Cold Air Inflatables Volume (K), by Application 2025 & 2033
- Figure 41: Middle East & Africa Cold Air Inflatables Revenue Share (%), by Application 2025 & 2033
- Figure 42: Middle East & Africa Cold Air Inflatables Volume Share (%), by Application 2025 & 2033
- Figure 43: Middle East & Africa Cold Air Inflatables Revenue (million), by Types 2025 & 2033
- Figure 44: Middle East & Africa Cold Air Inflatables Volume (K), by Types 2025 & 2033
- Figure 45: Middle East & Africa Cold Air Inflatables Revenue Share (%), by Types 2025 & 2033
- Figure 46: Middle East & Africa Cold Air Inflatables Volume Share (%), by Types 2025 & 2033
- Figure 47: Middle East & Africa Cold Air Inflatables Revenue (million), by Country 2025 & 2033
- Figure 48: Middle East & Africa Cold Air Inflatables Volume (K), by Country 2025 & 2033
- Figure 49: Middle East & Africa Cold Air Inflatables Revenue Share (%), by Country 2025 & 2033
- Figure 50: Middle East & Africa Cold Air Inflatables Volume Share (%), by Country 2025 & 2033
- Figure 51: Asia Pacific Cold Air Inflatables Revenue (million), by Application 2025 & 2033
- Figure 52: Asia Pacific Cold Air Inflatables Volume (K), by Application 2025 & 2033
- Figure 53: Asia Pacific Cold Air Inflatables Revenue Share (%), by Application 2025 & 2033
- Figure 54: Asia Pacific Cold Air Inflatables Volume Share (%), by Application 2025 & 2033
- Figure 55: Asia Pacific Cold Air Inflatables Revenue (million), by Types 2025 & 2033
- Figure 56: Asia Pacific Cold Air Inflatables Volume (K), by Types 2025 & 2033
- Figure 57: Asia Pacific Cold Air Inflatables Revenue Share (%), by Types 2025 & 2033
- Figure 58: Asia Pacific Cold Air Inflatables Volume Share (%), by Types 2025 & 2033
- Figure 59: Asia Pacific Cold Air Inflatables Revenue (million), by Country 2025 & 2033
- Figure 60: Asia Pacific Cold Air Inflatables Volume (K), by Country 2025 & 2033
- Figure 61: Asia Pacific Cold Air Inflatables Revenue Share (%), by Country 2025 & 2033
- Figure 62: Asia Pacific Cold Air Inflatables Volume Share (%), by Country 2025 & 2033
List of Tables
- Table 1: Global Cold Air Inflatables Revenue million Forecast, by Application 2020 & 2033
- Table 2: Global Cold Air Inflatables Volume K Forecast, by Application 2020 & 2033
- Table 3: Global Cold Air Inflatables Revenue million Forecast, by Types 2020 & 2033
- Table 4: Global Cold Air Inflatables Volume K Forecast, by Types 2020 & 2033
- Table 5: Global Cold Air Inflatables Revenue million Forecast, by Region 2020 & 2033
- Table 6: Global Cold Air Inflatables Volume K Forecast, by Region 2020 & 2033
- Table 7: Global Cold Air Inflatables Revenue million Forecast, by Application 2020 & 2033
- Table 8: Global Cold Air Inflatables Volume K Forecast, by Application 2020 & 2033
- Table 9: Global Cold Air Inflatables Revenue million Forecast, by Types 2020 & 2033
- Table 10: Global Cold Air Inflatables Volume K Forecast, by Types 2020 & 2033
- Table 11: Global Cold Air Inflatables Revenue million Forecast, by Country 2020 & 2033
- Table 12: Global Cold Air Inflatables Volume K Forecast, by Country 2020 & 2033
- Table 13: United States Cold Air Inflatables Revenue (million) Forecast, by Application 2020 & 2033
- Table 14: United States Cold Air Inflatables Volume (K) Forecast, by Application 2020 & 2033
- Table 15: Canada Cold Air Inflatables Revenue (million) Forecast, by Application 2020 & 2033
- Table 16: Canada Cold Air Inflatables Volume (K) Forecast, by Application 2020 & 2033
- Table 17: Mexico Cold Air Inflatables Revenue (million) Forecast, by Application 2020 & 2033
- Table 18: Mexico Cold Air Inflatables Volume (K) Forecast, by Application 2020 & 2033
- Table 19: Global Cold Air Inflatables Revenue million Forecast, by Application 2020 & 2033
- Table 20: Global Cold Air Inflatables Volume K Forecast, by Application 2020 & 2033
- Table 21: Global Cold Air Inflatables Revenue million Forecast, by Types 2020 & 2033
- Table 22: Global Cold Air Inflatables Volume K Forecast, by Types 2020 & 2033
- Table 23: Global Cold Air Inflatables Revenue million Forecast, by Country 2020 & 2033
- Table 24: Global Cold Air Inflatables Volume K Forecast, by Country 2020 & 2033
- Table 25: Brazil Cold Air Inflatables Revenue (million) Forecast, by Application 2020 & 2033
- Table 26: Brazil Cold Air Inflatables Volume (K) Forecast, by Application 2020 & 2033
- Table 27: Argentina Cold Air Inflatables Revenue (million) Forecast, by Application 2020 & 2033
- Table 28: Argentina Cold Air Inflatables Volume (K) Forecast, by Application 2020 & 2033
- Table 29: Rest of South America Cold Air Inflatables Revenue (million) Forecast, by Application 2020 & 2033
- Table 30: Rest of South America Cold Air Inflatables Volume (K) Forecast, by Application 2020 & 2033
- Table 31: Global Cold Air Inflatables Revenue million Forecast, by Application 2020 & 2033
- Table 32: Global Cold Air Inflatables Volume K Forecast, by Application 2020 & 2033
- Table 33: Global Cold Air Inflatables Revenue million Forecast, by Types 2020 & 2033
- Table 34: Global Cold Air Inflatables Volume K Forecast, by Types 2020 & 2033
- Table 35: Global Cold Air Inflatables Revenue million Forecast, by Country 2020 & 2033
- Table 36: Global Cold Air Inflatables Volume K Forecast, by Country 2020 & 2033
- Table 37: United Kingdom Cold Air Inflatables Revenue (million) Forecast, by Application 2020 & 2033
- Table 38: United Kingdom Cold Air Inflatables Volume (K) Forecast, by Application 2020 & 2033
- Table 39: Germany Cold Air Inflatables Revenue (million) Forecast, by Application 2020 & 2033
- Table 40: Germany Cold Air Inflatables Volume (K) Forecast, by Application 2020 & 2033
- Table 41: France Cold Air Inflatables Revenue (million) Forecast, by Application 2020 & 2033
- Table 42: France Cold Air Inflatables Volume (K) Forecast, by Application 2020 & 2033
- Table 43: Italy Cold Air Inflatables Revenue (million) Forecast, by Application 2020 & 2033
- Table 44: Italy Cold Air Inflatables Volume (K) Forecast, by Application 2020 & 2033
- Table 45: Spain Cold Air Inflatables Revenue (million) Forecast, by Application 2020 & 2033
- Table 46: Spain Cold Air Inflatables Volume (K) Forecast, by Application 2020 & 2033
- Table 47: Russia Cold Air Inflatables Revenue (million) Forecast, by Application 2020 & 2033
- Table 48: Russia Cold Air Inflatables Volume (K) Forecast, by Application 2020 & 2033
- Table 49: Benelux Cold Air Inflatables Revenue (million) Forecast, by Application 2020 & 2033
- Table 50: Benelux Cold Air Inflatables Volume (K) Forecast, by Application 2020 & 2033
- Table 51: Nordics Cold Air Inflatables Revenue (million) Forecast, by Application 2020 & 2033
- Table 52: Nordics Cold Air Inflatables Volume (K) Forecast, by Application 2020 & 2033
- Table 53: Rest of Europe Cold Air Inflatables Revenue (million) Forecast, by Application 2020 & 2033
- Table 54: Rest of Europe Cold Air Inflatables Volume (K) Forecast, by Application 2020 & 2033
- Table 55: Global Cold Air Inflatables Revenue million Forecast, by Application 2020 & 2033
- Table 56: Global Cold Air Inflatables Volume K Forecast, by Application 2020 & 2033
- Table 57: Global Cold Air Inflatables Revenue million Forecast, by Types 2020 & 2033
- Table 58: Global Cold Air Inflatables Volume K Forecast, by Types 2020 & 2033
- Table 59: Global Cold Air Inflatables Revenue million Forecast, by Country 2020 & 2033
- Table 60: Global Cold Air Inflatables Volume K Forecast, by Country 2020 & 2033
- Table 61: Turkey Cold Air Inflatables Revenue (million) Forecast, by Application 2020 & 2033
- Table 62: Turkey Cold Air Inflatables Volume (K) Forecast, by Application 2020 & 2033
- Table 63: Israel Cold Air Inflatables Revenue (million) Forecast, by Application 2020 & 2033
- Table 64: Israel Cold Air Inflatables Volume (K) Forecast, by Application 2020 & 2033
- Table 65: GCC Cold Air Inflatables Revenue (million) Forecast, by Application 2020 & 2033
- Table 66: GCC Cold Air Inflatables Volume (K) Forecast, by Application 2020 & 2033
- Table 67: North Africa Cold Air Inflatables Revenue (million) Forecast, by Application 2020 & 2033
- Table 68: North Africa Cold Air Inflatables Volume (K) Forecast, by Application 2020 & 2033
- Table 69: South Africa Cold Air Inflatables Revenue (million) Forecast, by Application 2020 & 2033
- Table 70: South Africa Cold Air Inflatables Volume (K) Forecast, by Application 2020 & 2033
- Table 71: Rest of Middle East & Africa Cold Air Inflatables Revenue (million) Forecast, by Application 2020 & 2033
- Table 72: Rest of Middle East & Africa Cold Air Inflatables Volume (K) Forecast, by Application 2020 & 2033
- Table 73: Global Cold Air Inflatables Revenue million Forecast, by Application 2020 & 2033
- Table 74: Global Cold Air Inflatables Volume K Forecast, by Application 2020 & 2033
- Table 75: Global Cold Air Inflatables Revenue million Forecast, by Types 2020 & 2033
- Table 76: Global Cold Air Inflatables Volume K Forecast, by Types 2020 & 2033
- Table 77: Global Cold Air Inflatables Revenue million Forecast, by Country 2020 & 2033
- Table 78: Global Cold Air Inflatables Volume K Forecast, by Country 2020 & 2033
- Table 79: China Cold Air Inflatables Revenue (million) Forecast, by Application 2020 & 2033
- Table 80: China Cold Air Inflatables Volume (K) Forecast, by Application 2020 & 2033
- Table 81: India Cold Air Inflatables Revenue (million) Forecast, by Application 2020 & 2033
- Table 82: India Cold Air Inflatables Volume (K) Forecast, by Application 2020 & 2033
- Table 83: Japan Cold Air Inflatables Revenue (million) Forecast, by Application 2020 & 2033
- Table 84: Japan Cold Air Inflatables Volume (K) Forecast, by Application 2020 & 2033
- Table 85: South Korea Cold Air Inflatables Revenue (million) Forecast, by Application 2020 & 2033
- Table 86: South Korea Cold Air Inflatables Volume (K) Forecast, by Application 2020 & 2033
- Table 87: ASEAN Cold Air Inflatables Revenue (million) Forecast, by Application 2020 & 2033
- Table 88: ASEAN Cold Air Inflatables Volume (K) Forecast, by Application 2020 & 2033
- Table 89: Oceania Cold Air Inflatables Revenue (million) Forecast, by Application 2020 & 2033
- Table 90: Oceania Cold Air Inflatables Volume (K) Forecast, by Application 2020 & 2033
- Table 91: Rest of Asia Pacific Cold Air Inflatables Revenue (million) Forecast, by Application 2020 & 2033
- Table 92: Rest of Asia Pacific Cold Air Inflatables Volume (K) Forecast, by Application 2020 & 2033
Frequently Asked Questions
1. What is the projected Compound Annual Growth Rate (CAGR) of the Cold Air Inflatables?
The projected CAGR is approximately 6.1%.
2. Which companies are prominent players in the Cold Air Inflatables?
Key companies in the market include Boulder Blimp, Air Ad Promotions, Inflatable Design Group, Windship Inflatables, Inflatable Images, Pioneer Balloon, ULTRAMAGIC, Airquee.
3. What are the main segments of the Cold Air Inflatables?
The market segments include Application, Types.
4. Can you provide details about the market size?
The market size is estimated to be USD 2843 million as of 2022.
5. What are some drivers contributing to market growth?
N/A
6. What are the notable trends driving market growth?
N/A
7. Are there any restraints impacting market growth?
N/A
8. Can you provide examples of recent developments in the market?
N/A
9. What pricing options are available for accessing the report?
Pricing options include single-user, multi-user, and enterprise licenses priced at USD 3950.00, USD 5925.00, and USD 7900.00 respectively.
10. Is the market size provided in terms of value or volume?
The market size is provided in terms of value, measured in million and volume, measured in K.
11. Are there any specific market keywords associated with the report?
Yes, the market keyword associated with the report is "Cold Air Inflatables," which aids in identifying and referencing the specific market segment covered.
12. How do I determine which pricing option suits my needs best?
The pricing options vary based on user requirements and access needs. Individual users may opt for single-user licenses, while businesses requiring broader access may choose multi-user or enterprise licenses for cost-effective access to the report.
13. Are there any additional resources or data provided in the Cold Air Inflatables report?
While the report offers comprehensive insights, it's advisable to review the specific contents or supplementary materials provided to ascertain if additional resources or data are available.
14. How can I stay updated on further developments or reports in the Cold Air Inflatables?
To stay informed about further developments, trends, and reports in the Cold Air Inflatables, consider subscribing to industry newsletters, following relevant companies and organizations, or regularly checking reputable industry news sources and publications.
Methodology
Step 1 - Identification of Relevant Samples Size from Population Database


Step 2 - Approaches for Defining Global Market Size (Value, Volume* & Price*)

Note*: In applicable scenarios
Step 3 - Data Sources
Primary Research
- Web Analytics
- Survey Reports
- Research Institute
- Latest Research Reports
- Opinion Leaders
Secondary Research
- Annual Reports
- White Paper
- Latest Press Release
- Industry Association
- Paid Database
- Investor Presentations

Step 4 - Data Triangulation
Involves using different sources of information in order to increase the validity of a study
These sources are likely to be stakeholders in a program - participants, other researchers, program staff, other community members, and so on.
Then we put all data in single framework & apply various statistical tools to find out the dynamic on the market.
During the analysis stage, feedback from the stakeholder groups would be compared to determine areas of agreement as well as areas of divergence