


Key Insights
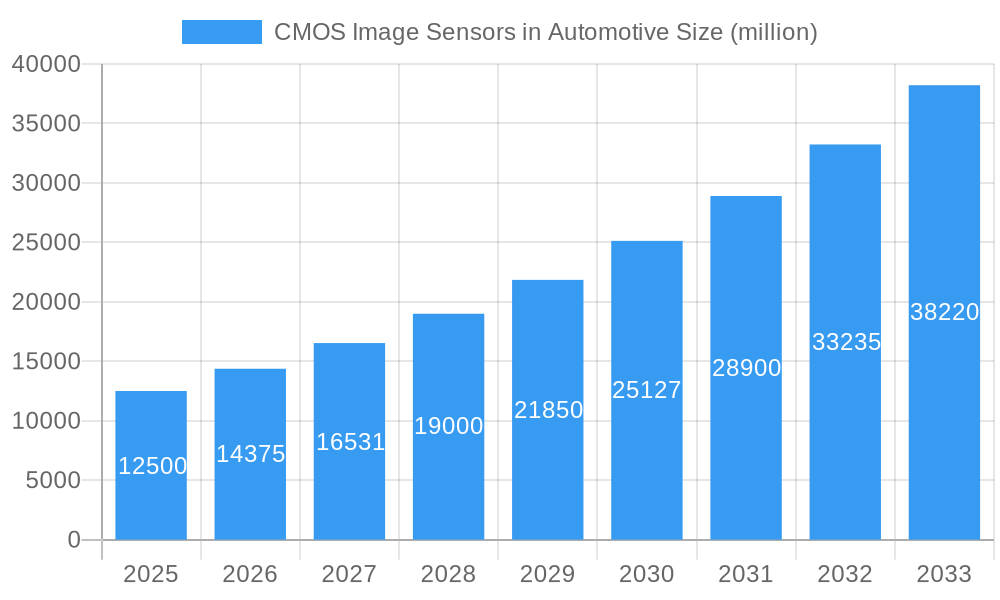
The global CMOS Image Sensor market within the automotive sector is experiencing robust growth, projected to reach a substantial market size of approximately $12,500 million by 2025. This expansion is driven by a Compound Annual Growth Rate (CAGR) of around 15%, indicating strong and consistent demand for advanced imaging solutions in vehicles. The primary drivers fueling this surge include the escalating adoption of Advanced Driver-Assistance Systems (ADAS) for enhanced safety, the increasing prevalence of autonomous driving technologies, and the growing consumer demand for sophisticated in-car infotainment and monitoring features. As vehicle complexity increases and regulatory mandates for safety features become more stringent, the need for high-performance CMOS image sensors, capable of delivering superior image quality in diverse lighting and environmental conditions, will only intensify.
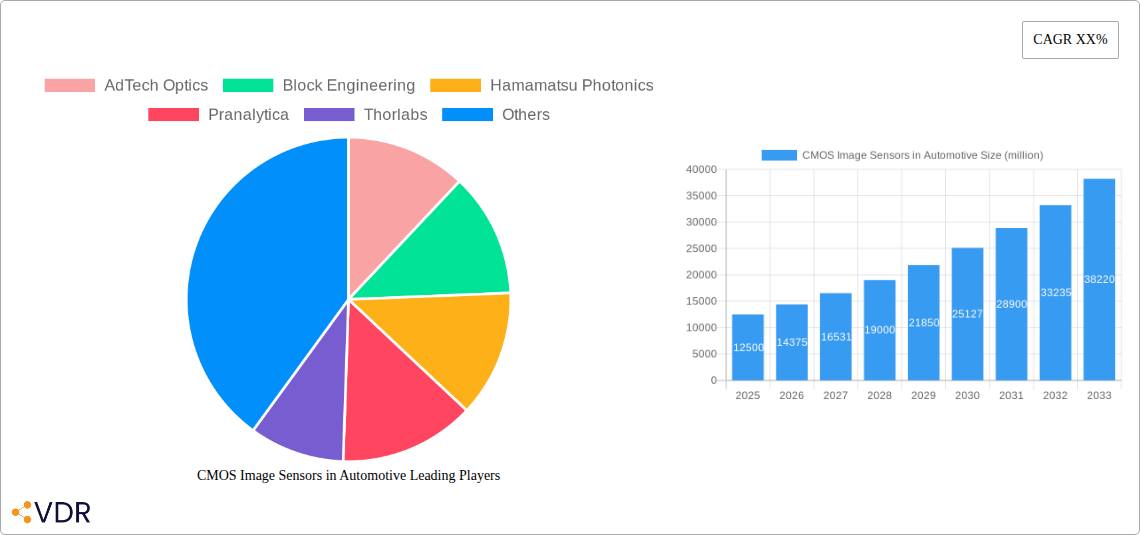
CMOS Image Sensors in Automotive Market Size (In Billion)

The market is segmented into various applications, with Commercial Vehicles and Passenger Vehicles being the dominant categories. Within these, front-side and back-side illuminated sensors cater to specific imaging requirements, from sophisticated object detection to clear cabin monitoring. Key players like Hamamatsu Photonics, Thorlabs, and Nanoplus Nanosystems and Technologies are at the forefront, innovating with technologies that improve resolution, dynamic range, and low-light performance. Challenges such as the high cost of development for cutting-edge sensors and the complexities of integrating these systems into existing automotive architectures are present. However, ongoing technological advancements in miniaturization, power efficiency, and AI integration are poised to overcome these restraints, paving the way for widespread adoption and further market expansion in regions like Asia Pacific and North America, which are leading in both production and consumption of these critical automotive components.
CMOS Image Sensors in Automotive Company Market Share
Report Description: CMOS Image Sensors in Automotive Market – Growth, Trends, and Future Outlook (2019–2033)
Gain comprehensive insights into the rapidly evolving CMOS image sensors in automotive market, a critical component for advanced driver-assistance systems (ADAS), autonomous driving, and in-cabin monitoring. This in-depth report forecasts significant growth, driven by increasing vehicle safety regulations and the burgeoning demand for sophisticated automotive electronics. With a study period spanning 2019–2033, this analysis provides unparalleled foresight into market dynamics, technological advancements, and competitive landscapes.
The report meticulously breaks down the market by Parent Market: Semiconductor Devices, and Child Market: Image Sensors, offering a clear understanding of its position within the broader electronics industry.
Report Highlights:
Breakdown Data by Type:
Segments:
Key Companies Covered: AdTech Optics, Block Engineering, Hamamatsu Photonics, Pranalytica, Thorlabs, Akela Laser, Alpes Lasers, Daylight Solutions, LASERMAX, mirSense, Nanoplus Nanosystems and Technologies, Wavelength Electronics, Quantum Cascade Lasers.
- Study Period: 2019–2033
- Base Year: 2025
- Estimated Year: 2025
- Forecast Period: 2025–2033
- Historical Period: 2019–2024
- C-Mount: Value in million units.
- HHL & VHL Package: Value in million units.
- TO3 Package: Value in million units.
- Application: Commercial Vehicle, Passenger Vehicle
- Types: Front Side Illuminated, Back Side Illuminated, Others
CMOS Image Sensors in Automotive Market Dynamics & Structure
The CMOS image sensors in automotive market is characterized by a moderate to high level of market concentration, with a few dominant players holding significant market share. Technological innovation is the primary driver, fueled by the relentless pursuit of enhanced imaging performance, lower power consumption, and greater integration capabilities for ADAS and autonomous driving functionalities. Regulatory frameworks, particularly concerning vehicle safety and autonomous operation, are increasingly mandating advanced imaging solutions, thus accelerating market adoption. Competitive product substitutes, such as CCD sensors, are gradually being phased out due to CMOS's superior speed, power efficiency, and cost-effectiveness. End-user demographics are shifting towards a greater acceptance of advanced automotive technologies, with consumers prioritizing safety and convenience features. Mergers and acquisitions (M&A) trends are prevalent as larger companies seek to consolidate their market position and acquire cutting-edge technologies. For instance, recent M&A activities have seen strategic acquisitions of sensor technology startups by established automotive component manufacturers. Barriers to innovation include the extremely stringent automotive-grade qualification requirements, long development cycles, and the need for robust supply chain management to ensure reliability and availability.
CMOS Image Sensors in Automotive Growth Trends & Insights
The CMOS image sensors in automotive market is poised for substantial growth, with a projected Compound Annual Growth Rate (CAGR) of XX% during the forecast period. This impressive expansion is underpinned by a confluence of factors, including escalating consumer demand for advanced safety features and the progressive integration of autonomous driving capabilities across all vehicle segments. As regulatory bodies worldwide introduce stricter safety mandates for vehicles, the adoption of sophisticated imaging systems, powered by high-performance CMOS sensors, becomes not just a competitive advantage but a necessity. The market size evolution is set to witness a significant upward trajectory, moving from an estimated XX million units in the base year of 2025 to an estimated XX million units by 2033. This growth trajectory is further amplified by technological disruptions, such as the advancement in sensor resolution, dynamic range, and low-light performance, enabling clearer vision in challenging environmental conditions. Consumer behavior shifts are also playing a pivotal role; drivers and passengers are increasingly seeking enhanced in-cabin experiences and a heightened sense of security, which advanced camera systems directly address through features like driver monitoring and panoramic interior views. The market penetration of CMOS image sensors in new vehicle production is steadily increasing, indicating a widespread integration across various vehicle tiers, from entry-level passenger cars to high-end commercial vehicles. The continuous innovation in sensor architecture and processing power ensures that these devices are capable of handling the ever-increasing data demands of modern vehicles, paving the way for future advancements in automotive intelligence.
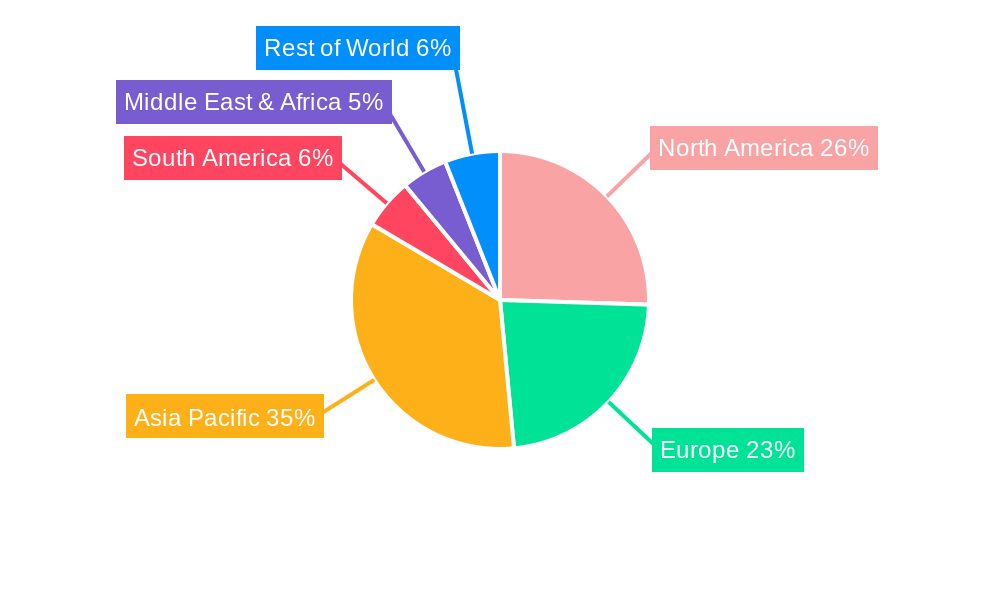
Dominant Regions, Countries, or Segments in CMOS Image Sensors in Automotive
The Passenger Vehicle segment, across its diverse applications, is a dominant force in the global CMOS image sensors in automotive market, primarily driven by its sheer volume and the widespread integration of ADAS features. North America, led by the United States, and Europe, particularly Germany, are identified as the leading geographical regions propelling this dominance. These regions boast robust automotive manufacturing hubs, stringent safety regulations, and a high disposable income that supports the adoption of advanced automotive technologies. The increasing consumer awareness and demand for enhanced safety features, such as lane-keeping assist, automatic emergency braking, and blind-spot detection, directly translate into a higher demand for CMOS image sensors.
- Key Drivers in Passenger Vehicles:
- Mandatory Safety Regulations: Government mandates for ADAS features in new vehicle registrations are a significant growth catalyst.
- Consumer Preference for Safety: Growing consumer prioritization of safety and comfort features in vehicle purchase decisions.
- Technological Advancements: Continuous improvements in sensor resolution, dynamic range, and low-light capabilities enabling more effective ADAS.
- Autonomous Driving Ambitions: The long-term vision of autonomous driving necessitates a comprehensive suite of advanced camera systems.
In terms of sensor types, Back Side Illuminated (BSI) CMOS image sensors are increasingly dominating due to their superior light-gathering capabilities and enhanced performance in low-light conditions, which is crucial for automotive applications requiring all-weather and all-time visibility. The integration of these advanced sensors directly contributes to the improved functionality of forward-facing cameras, surround-view systems, and interior monitoring cameras. The market share within this segment is substantial, reflecting a clear preference for technologies that offer better performance and reliability in the demanding automotive environment. Economic policies in leading automotive nations that incentivize the development and adoption of green and safe vehicle technologies further bolster this trend. Infrastructure development supporting smart cities and connected vehicles also indirectly contributes to the demand for advanced imaging solutions. The growth potential within the passenger vehicle segment remains exceptionally high, with continuous innovation promising even more sophisticated applications in the coming years.
CMOS Image Sensors in Automotive Product Landscape
The product landscape of CMOS image sensors in automotive is characterized by a relentless drive towards higher resolution, increased frame rates, superior dynamic range, and enhanced low-light performance. Innovations are geared towards specialized sensors capable of operating reliably in extreme temperatures, vibrations, and varying illumination conditions encountered in automotive environments. Manufacturers are focusing on integrating advanced functionalities directly onto the sensor, such as in-pixel processing, HDR capabilities, and temporal noise reduction, to minimize the load on the main vehicle processor. Unique selling propositions often revolve around ultra-compact designs for seamless integration into vehicle exteriors and interiors, as well as robust automotive-grade certifications ensuring long-term reliability. Technological advancements include the development of stacked sensor architectures for faster data readout and the implementation of AI-enabling features for real-time object recognition and scene understanding.
Key Drivers, Barriers & Challenges in CMOS Image Sensors in Automotive
Key Drivers:
The CMOS image sensors in automotive market is propelled by several key drivers. Foremost among these are stringent global automotive safety regulations that mandate the inclusion of ADAS features, directly increasing the demand for sophisticated imaging solutions. The accelerating development and adoption of autonomous driving technologies, from Level 1 to Level 5, represent a significant growth accelerator, requiring increasingly advanced and reliable sensor inputs. Furthermore, growing consumer demand for enhanced safety, comfort, and convenience features in vehicles, such as 360-degree camera systems and driver monitoring, fuels the market. Technological innovation, leading to higher resolution, improved low-light performance, and greater dynamic range in CMOS sensors, makes them indispensable for these applications.
Barriers & Challenges:
Despite the robust growth, the market faces significant barriers and challenges. The extreme reliability and durability requirements of the automotive industry lead to exceptionally long qualification and validation cycles, hindering rapid product iteration. Supply chain disruptions and geopolitical factors can impact the availability of critical components and raw materials, leading to production delays and increased costs. Intense competition among sensor manufacturers drives down profit margins, especially in the commoditized segments. The high cost of R&D for cutting-edge automotive-grade sensors also presents a substantial hurdle, particularly for smaller players. Cybersecurity concerns associated with connected vehicles and the data generated by image sensors also pose a growing challenge that needs to be addressed through robust security measures.
Emerging Opportunities in CMOS Image Sensors in Automotive
Emerging opportunities in the CMOS image sensors in automotive market lie in the continuous expansion of advanced driver-assistance systems (ADAS) and the burgeoning field of in-cabin monitoring. The increasing trend towards Level 3 and Level 4 autonomous driving will necessitate higher-performing sensors with advanced AI capabilities for object detection, tracking, and scene interpretation. Opportunities also exist in developing specialized sensors for emerging applications such as advanced interior sensing for driver and occupant monitoring, gesture recognition, and enhanced infotainment experiences. The integration of sensors into vehicle exteriors for improved pedestrian detection and interaction with the surrounding environment presents another significant avenue for growth. Furthermore, the development of highly power-efficient sensors for electric vehicles (EVs) to minimize battery drain is a key emerging opportunity.
Growth Accelerators in the CMOS Image Sensors in Automotive Industry
The CMOS image sensors in automotive industry is experiencing accelerated growth driven by several catalytic factors. Key among these are continuous technological breakthroughs in sensor design and manufacturing, leading to enhanced performance metrics such as higher resolution, improved low-light sensitivity, and wider dynamic range. Strategic partnerships between sensor manufacturers and automotive OEMs (Original Equipment Manufacturers) are crucial, fostering co-development and ensuring that sensor technologies align with the evolving needs of vehicle manufacturers. Market expansion strategies, particularly in emerging economies where vehicle ownership and safety awareness are on the rise, represent significant growth opportunities. The increasing adoption of vehicle-to-everything (V2X) communication technologies will also drive the demand for sophisticated sensor arrays that can contribute to a more connected and safer transportation ecosystem.
Key Players Shaping the CMOS Image Sensors in Automotive Market
- AdTech Optics
- Block Engineering
- Hamamatsu Photonics
- Pranalytica
- Thorlabs
- Akela Laser
- Alpes Lasers
- Daylight Solutions
- LASERMAX
- mirSense
- Nanoplus Nanosystems and Technologies
- Wavelength Electronics
- Quantum Cascade Lasers
Notable Milestones in CMOS Image Sensors in Automotive Sector
- 2020 (Ongoing): Increased integration of high-resolution (e.g., 2MP, 8MP) CMOS sensors for surround-view systems and advanced ADAS.
- 2021 (Ongoing): Introduction of sensors with improved dynamic range (e.g., >120 dB) to enhance performance in challenging lighting conditions.
- 2022 (Ongoing): Development and adoption of sensors with integrated AI capabilities for on-sensor processing of image data.
- 2023 (Ongoing): Enhanced focus on cybersecurity features within image sensor architectures to protect against malicious attacks.
- 2024 (Ongoing): Significant advancements in low-light performance and noise reduction technologies for critical night-time driving scenarios.
In-Depth CMOS Image Sensors in Automotive Market Outlook
The CMOS image sensors in automotive market is projected to witness robust and sustained growth in the coming years, driven by a confluence of technological advancements and regulatory mandates. The increasing sophistication of autonomous driving systems, coupled with a global emphasis on vehicle safety, will continue to be the primary growth accelerators. Opportunities will emerge from the development of highly integrated, AI-enabled sensors capable of real-time data analysis and advanced scene understanding. Strategic collaborations between semiconductor manufacturers and automotive giants will play a pivotal role in shaping the future of this market, ensuring that innovation keeps pace with the rapid evolution of the automotive industry. The expansion into emerging markets and the development of specialized sensors for electric vehicles will further solidify the market's positive outlook, presenting significant strategic opportunities for key players.
CMOS Image Sensors in Automotive Segmentation
-
1. Application
- 1.1. Commercial Vehicle
- 1.2. Passenger Vehicle
-
2. Types
- 2.1. Front Side Illuminated
- 2.2. Back Side Illuminated
- 2.3. Others
CMOS Image Sensors in Automotive Segmentation By Geography
-
1. North America
- 1.1. United States
- 1.2. Canada
- 1.3. Mexico
-
2. South America
- 2.1. Brazil
- 2.2. Argentina
- 2.3. Rest of South America
-
3. Europe
- 3.1. United Kingdom
- 3.2. Germany
- 3.3. France
- 3.4. Italy
- 3.5. Spain
- 3.6. Russia
- 3.7. Benelux
- 3.8. Nordics
- 3.9. Rest of Europe
-
4. Middle East & Africa
- 4.1. Turkey
- 4.2. Israel
- 4.3. GCC
- 4.4. North Africa
- 4.5. South Africa
- 4.6. Rest of Middle East & Africa
-
5. Asia Pacific
- 5.1. China
- 5.2. India
- 5.3. Japan
- 5.4. South Korea
- 5.5. ASEAN
- 5.6. Oceania
- 5.7. Rest of Asia Pacific
CMOS Image Sensors in Automotive Regional Market Share
Geographic Coverage of CMOS Image Sensors in Automotive
CMOS Image Sensors in Automotive REPORT HIGHLIGHTS
| Aspects | Details |
|---|---|
| Study Period | 2020-2034 |
| Base Year | 2025 |
| Estimated Year | 2026 |
| Forecast Period | 2026-2034 |
| Historical Period | 2020-2025 |
| Growth Rate | CAGR of XX% from 2020-2034 |
| Segmentation |
|
Table of Contents
- 1. Introduction
- 1.1. Research Scope
- 1.2. Market Segmentation
- 1.3. Research Methodology
- 1.4. Definitions and Assumptions
- 2. Executive Summary
- 2.1. Introduction
- 3. Market Dynamics
- 3.1. Introduction
- 3.2. Market Drivers
- 3.3. Market Restrains
- 3.4. Market Trends
- 4. Market Factor Analysis
- 4.1. Porters Five Forces
- 4.2. Supply/Value Chain
- 4.3. PESTEL analysis
- 4.4. Market Entropy
- 4.5. Patent/Trademark Analysis
- 5. Global CMOS Image Sensors in Automotive Analysis, Insights and Forecast, 2020-2032
- 5.1. Market Analysis, Insights and Forecast - by Application
- 5.1.1. Commercial Vehicle
- 5.1.2. Passenger Vehicle
- 5.2. Market Analysis, Insights and Forecast - by Types
- 5.2.1. Front Side Illuminated
- 5.2.2. Back Side Illuminated
- 5.2.3. Others
- 5.3. Market Analysis, Insights and Forecast - by Region
- 5.3.1. North America
- 5.3.2. South America
- 5.3.3. Europe
- 5.3.4. Middle East & Africa
- 5.3.5. Asia Pacific
- 5.1. Market Analysis, Insights and Forecast - by Application
- 6. North America CMOS Image Sensors in Automotive Analysis, Insights and Forecast, 2020-2032
- 6.1. Market Analysis, Insights and Forecast - by Application
- 6.1.1. Commercial Vehicle
- 6.1.2. Passenger Vehicle
- 6.2. Market Analysis, Insights and Forecast - by Types
- 6.2.1. Front Side Illuminated
- 6.2.2. Back Side Illuminated
- 6.2.3. Others
- 6.1. Market Analysis, Insights and Forecast - by Application
- 7. South America CMOS Image Sensors in Automotive Analysis, Insights and Forecast, 2020-2032
- 7.1. Market Analysis, Insights and Forecast - by Application
- 7.1.1. Commercial Vehicle
- 7.1.2. Passenger Vehicle
- 7.2. Market Analysis, Insights and Forecast - by Types
- 7.2.1. Front Side Illuminated
- 7.2.2. Back Side Illuminated
- 7.2.3. Others
- 7.1. Market Analysis, Insights and Forecast - by Application
- 8. Europe CMOS Image Sensors in Automotive Analysis, Insights and Forecast, 2020-2032
- 8.1. Market Analysis, Insights and Forecast - by Application
- 8.1.1. Commercial Vehicle
- 8.1.2. Passenger Vehicle
- 8.2. Market Analysis, Insights and Forecast - by Types
- 8.2.1. Front Side Illuminated
- 8.2.2. Back Side Illuminated
- 8.2.3. Others
- 8.1. Market Analysis, Insights and Forecast - by Application
- 9. Middle East & Africa CMOS Image Sensors in Automotive Analysis, Insights and Forecast, 2020-2032
- 9.1. Market Analysis, Insights and Forecast - by Application
- 9.1.1. Commercial Vehicle
- 9.1.2. Passenger Vehicle
- 9.2. Market Analysis, Insights and Forecast - by Types
- 9.2.1. Front Side Illuminated
- 9.2.2. Back Side Illuminated
- 9.2.3. Others
- 9.1. Market Analysis, Insights and Forecast - by Application
- 10. Asia Pacific CMOS Image Sensors in Automotive Analysis, Insights and Forecast, 2020-2032
- 10.1. Market Analysis, Insights and Forecast - by Application
- 10.1.1. Commercial Vehicle
- 10.1.2. Passenger Vehicle
- 10.2. Market Analysis, Insights and Forecast - by Types
- 10.2.1. Front Side Illuminated
- 10.2.2. Back Side Illuminated
- 10.2.3. Others
- 10.1. Market Analysis, Insights and Forecast - by Application
- 11. Competitive Analysis
- 11.1. Global Market Share Analysis 2025
- 11.2. Company Profiles
- 11.2.1 AdTech Optics
- 11.2.1.1. Overview
- 11.2.1.2. Products
- 11.2.1.3. SWOT Analysis
- 11.2.1.4. Recent Developments
- 11.2.1.5. Financials (Based on Availability)
- 11.2.2 Block Engineering
- 11.2.2.1. Overview
- 11.2.2.2. Products
- 11.2.2.3. SWOT Analysis
- 11.2.2.4. Recent Developments
- 11.2.2.5. Financials (Based on Availability)
- 11.2.3 Hamamatsu Photonics
- 11.2.3.1. Overview
- 11.2.3.2. Products
- 11.2.3.3. SWOT Analysis
- 11.2.3.4. Recent Developments
- 11.2.3.5. Financials (Based on Availability)
- 11.2.4 Pranalytica
- 11.2.4.1. Overview
- 11.2.4.2. Products
- 11.2.4.3. SWOT Analysis
- 11.2.4.4. Recent Developments
- 11.2.4.5. Financials (Based on Availability)
- 11.2.5 Thorlabs
- 11.2.5.1. Overview
- 11.2.5.2. Products
- 11.2.5.3. SWOT Analysis
- 11.2.5.4. Recent Developments
- 11.2.5.5. Financials (Based on Availability)
- 11.2.6 Akela Laser
- 11.2.6.1. Overview
- 11.2.6.2. Products
- 11.2.6.3. SWOT Analysis
- 11.2.6.4. Recent Developments
- 11.2.6.5. Financials (Based on Availability)
- 11.2.7 Alpes Lasers
- 11.2.7.1. Overview
- 11.2.7.2. Products
- 11.2.7.3. SWOT Analysis
- 11.2.7.4. Recent Developments
- 11.2.7.5. Financials (Based on Availability)
- 11.2.8 Daylight Solutions
- 11.2.8.1. Overview
- 11.2.8.2. Products
- 11.2.8.3. SWOT Analysis
- 11.2.8.4. Recent Developments
- 11.2.8.5. Financials (Based on Availability)
- 11.2.9 LASERMAX
- 11.2.9.1. Overview
- 11.2.9.2. Products
- 11.2.9.3. SWOT Analysis
- 11.2.9.4. Recent Developments
- 11.2.9.5. Financials (Based on Availability)
- 11.2.10 mirSense
- 11.2.10.1. Overview
- 11.2.10.2. Products
- 11.2.10.3. SWOT Analysis
- 11.2.10.4. Recent Developments
- 11.2.10.5. Financials (Based on Availability)
- 11.2.11 Nanoplus Nanosystems and Technologies
- 11.2.11.1. Overview
- 11.2.11.2. Products
- 11.2.11.3. SWOT Analysis
- 11.2.11.4. Recent Developments
- 11.2.11.5. Financials (Based on Availability)
- 11.2.12 Wavelength Electronics
- 11.2.12.1. Overview
- 11.2.12.2. Products
- 11.2.12.3. SWOT Analysis
- 11.2.12.4. Recent Developments
- 11.2.12.5. Financials (Based on Availability)
- 11.2.13 Quantum Cascade Lasers Breakdown Data by Type
- 11.2.13.1. Overview
- 11.2.13.2. Products
- 11.2.13.3. SWOT Analysis
- 11.2.13.4. Recent Developments
- 11.2.13.5. Financials (Based on Availability)
- 11.2.14 C-Mount
- 11.2.14.1. Overview
- 11.2.14.2. Products
- 11.2.14.3. SWOT Analysis
- 11.2.14.4. Recent Developments
- 11.2.14.5. Financials (Based on Availability)
- 11.2.15 HHL & VHL Package
- 11.2.15.1. Overview
- 11.2.15.2. Products
- 11.2.15.3. SWOT Analysis
- 11.2.15.4. Recent Developments
- 11.2.15.5. Financials (Based on Availability)
- 11.2.16 TO3 Package
- 11.2.16.1. Overview
- 11.2.16.2. Products
- 11.2.16.3. SWOT Analysis
- 11.2.16.4. Recent Developments
- 11.2.16.5. Financials (Based on Availability)
- 11.2.1 AdTech Optics
List of Figures
- Figure 1: Global CMOS Image Sensors in Automotive Revenue Breakdown (million, %) by Region 2025 & 2033
- Figure 2: Global CMOS Image Sensors in Automotive Volume Breakdown (K, %) by Region 2025 & 2033
- Figure 3: North America CMOS Image Sensors in Automotive Revenue (million), by Application 2025 & 2033
- Figure 4: North America CMOS Image Sensors in Automotive Volume (K), by Application 2025 & 2033
- Figure 5: North America CMOS Image Sensors in Automotive Revenue Share (%), by Application 2025 & 2033
- Figure 6: North America CMOS Image Sensors in Automotive Volume Share (%), by Application 2025 & 2033
- Figure 7: North America CMOS Image Sensors in Automotive Revenue (million), by Types 2025 & 2033
- Figure 8: North America CMOS Image Sensors in Automotive Volume (K), by Types 2025 & 2033
- Figure 9: North America CMOS Image Sensors in Automotive Revenue Share (%), by Types 2025 & 2033
- Figure 10: North America CMOS Image Sensors in Automotive Volume Share (%), by Types 2025 & 2033
- Figure 11: North America CMOS Image Sensors in Automotive Revenue (million), by Country 2025 & 2033
- Figure 12: North America CMOS Image Sensors in Automotive Volume (K), by Country 2025 & 2033
- Figure 13: North America CMOS Image Sensors in Automotive Revenue Share (%), by Country 2025 & 2033
- Figure 14: North America CMOS Image Sensors in Automotive Volume Share (%), by Country 2025 & 2033
- Figure 15: South America CMOS Image Sensors in Automotive Revenue (million), by Application 2025 & 2033
- Figure 16: South America CMOS Image Sensors in Automotive Volume (K), by Application 2025 & 2033
- Figure 17: South America CMOS Image Sensors in Automotive Revenue Share (%), by Application 2025 & 2033
- Figure 18: South America CMOS Image Sensors in Automotive Volume Share (%), by Application 2025 & 2033
- Figure 19: South America CMOS Image Sensors in Automotive Revenue (million), by Types 2025 & 2033
- Figure 20: South America CMOS Image Sensors in Automotive Volume (K), by Types 2025 & 2033
- Figure 21: South America CMOS Image Sensors in Automotive Revenue Share (%), by Types 2025 & 2033
- Figure 22: South America CMOS Image Sensors in Automotive Volume Share (%), by Types 2025 & 2033
- Figure 23: South America CMOS Image Sensors in Automotive Revenue (million), by Country 2025 & 2033
- Figure 24: South America CMOS Image Sensors in Automotive Volume (K), by Country 2025 & 2033
- Figure 25: South America CMOS Image Sensors in Automotive Revenue Share (%), by Country 2025 & 2033
- Figure 26: South America CMOS Image Sensors in Automotive Volume Share (%), by Country 2025 & 2033
- Figure 27: Europe CMOS Image Sensors in Automotive Revenue (million), by Application 2025 & 2033
- Figure 28: Europe CMOS Image Sensors in Automotive Volume (K), by Application 2025 & 2033
- Figure 29: Europe CMOS Image Sensors in Automotive Revenue Share (%), by Application 2025 & 2033
- Figure 30: Europe CMOS Image Sensors in Automotive Volume Share (%), by Application 2025 & 2033
- Figure 31: Europe CMOS Image Sensors in Automotive Revenue (million), by Types 2025 & 2033
- Figure 32: Europe CMOS Image Sensors in Automotive Volume (K), by Types 2025 & 2033
- Figure 33: Europe CMOS Image Sensors in Automotive Revenue Share (%), by Types 2025 & 2033
- Figure 34: Europe CMOS Image Sensors in Automotive Volume Share (%), by Types 2025 & 2033
- Figure 35: Europe CMOS Image Sensors in Automotive Revenue (million), by Country 2025 & 2033
- Figure 36: Europe CMOS Image Sensors in Automotive Volume (K), by Country 2025 & 2033
- Figure 37: Europe CMOS Image Sensors in Automotive Revenue Share (%), by Country 2025 & 2033
- Figure 38: Europe CMOS Image Sensors in Automotive Volume Share (%), by Country 2025 & 2033
- Figure 39: Middle East & Africa CMOS Image Sensors in Automotive Revenue (million), by Application 2025 & 2033
- Figure 40: Middle East & Africa CMOS Image Sensors in Automotive Volume (K), by Application 2025 & 2033
- Figure 41: Middle East & Africa CMOS Image Sensors in Automotive Revenue Share (%), by Application 2025 & 2033
- Figure 42: Middle East & Africa CMOS Image Sensors in Automotive Volume Share (%), by Application 2025 & 2033
- Figure 43: Middle East & Africa CMOS Image Sensors in Automotive Revenue (million), by Types 2025 & 2033
- Figure 44: Middle East & Africa CMOS Image Sensors in Automotive Volume (K), by Types 2025 & 2033
- Figure 45: Middle East & Africa CMOS Image Sensors in Automotive Revenue Share (%), by Types 2025 & 2033
- Figure 46: Middle East & Africa CMOS Image Sensors in Automotive Volume Share (%), by Types 2025 & 2033
- Figure 47: Middle East & Africa CMOS Image Sensors in Automotive Revenue (million), by Country 2025 & 2033
- Figure 48: Middle East & Africa CMOS Image Sensors in Automotive Volume (K), by Country 2025 & 2033
- Figure 49: Middle East & Africa CMOS Image Sensors in Automotive Revenue Share (%), by Country 2025 & 2033
- Figure 50: Middle East & Africa CMOS Image Sensors in Automotive Volume Share (%), by Country 2025 & 2033
- Figure 51: Asia Pacific CMOS Image Sensors in Automotive Revenue (million), by Application 2025 & 2033
- Figure 52: Asia Pacific CMOS Image Sensors in Automotive Volume (K), by Application 2025 & 2033
- Figure 53: Asia Pacific CMOS Image Sensors in Automotive Revenue Share (%), by Application 2025 & 2033
- Figure 54: Asia Pacific CMOS Image Sensors in Automotive Volume Share (%), by Application 2025 & 2033
- Figure 55: Asia Pacific CMOS Image Sensors in Automotive Revenue (million), by Types 2025 & 2033
- Figure 56: Asia Pacific CMOS Image Sensors in Automotive Volume (K), by Types 2025 & 2033
- Figure 57: Asia Pacific CMOS Image Sensors in Automotive Revenue Share (%), by Types 2025 & 2033
- Figure 58: Asia Pacific CMOS Image Sensors in Automotive Volume Share (%), by Types 2025 & 2033
- Figure 59: Asia Pacific CMOS Image Sensors in Automotive Revenue (million), by Country 2025 & 2033
- Figure 60: Asia Pacific CMOS Image Sensors in Automotive Volume (K), by Country 2025 & 2033
- Figure 61: Asia Pacific CMOS Image Sensors in Automotive Revenue Share (%), by Country 2025 & 2033
- Figure 62: Asia Pacific CMOS Image Sensors in Automotive Volume Share (%), by Country 2025 & 2033
List of Tables
- Table 1: Global CMOS Image Sensors in Automotive Revenue million Forecast, by Application 2020 & 2033
- Table 2: Global CMOS Image Sensors in Automotive Volume K Forecast, by Application 2020 & 2033
- Table 3: Global CMOS Image Sensors in Automotive Revenue million Forecast, by Types 2020 & 2033
- Table 4: Global CMOS Image Sensors in Automotive Volume K Forecast, by Types 2020 & 2033
- Table 5: Global CMOS Image Sensors in Automotive Revenue million Forecast, by Region 2020 & 2033
- Table 6: Global CMOS Image Sensors in Automotive Volume K Forecast, by Region 2020 & 2033
- Table 7: Global CMOS Image Sensors in Automotive Revenue million Forecast, by Application 2020 & 2033
- Table 8: Global CMOS Image Sensors in Automotive Volume K Forecast, by Application 2020 & 2033
- Table 9: Global CMOS Image Sensors in Automotive Revenue million Forecast, by Types 2020 & 2033
- Table 10: Global CMOS Image Sensors in Automotive Volume K Forecast, by Types 2020 & 2033
- Table 11: Global CMOS Image Sensors in Automotive Revenue million Forecast, by Country 2020 & 2033
- Table 12: Global CMOS Image Sensors in Automotive Volume K Forecast, by Country 2020 & 2033
- Table 13: United States CMOS Image Sensors in Automotive Revenue (million) Forecast, by Application 2020 & 2033
- Table 14: United States CMOS Image Sensors in Automotive Volume (K) Forecast, by Application 2020 & 2033
- Table 15: Canada CMOS Image Sensors in Automotive Revenue (million) Forecast, by Application 2020 & 2033
- Table 16: Canada CMOS Image Sensors in Automotive Volume (K) Forecast, by Application 2020 & 2033
- Table 17: Mexico CMOS Image Sensors in Automotive Revenue (million) Forecast, by Application 2020 & 2033
- Table 18: Mexico CMOS Image Sensors in Automotive Volume (K) Forecast, by Application 2020 & 2033
- Table 19: Global CMOS Image Sensors in Automotive Revenue million Forecast, by Application 2020 & 2033
- Table 20: Global CMOS Image Sensors in Automotive Volume K Forecast, by Application 2020 & 2033
- Table 21: Global CMOS Image Sensors in Automotive Revenue million Forecast, by Types 2020 & 2033
- Table 22: Global CMOS Image Sensors in Automotive Volume K Forecast, by Types 2020 & 2033
- Table 23: Global CMOS Image Sensors in Automotive Revenue million Forecast, by Country 2020 & 2033
- Table 24: Global CMOS Image Sensors in Automotive Volume K Forecast, by Country 2020 & 2033
- Table 25: Brazil CMOS Image Sensors in Automotive Revenue (million) Forecast, by Application 2020 & 2033
- Table 26: Brazil CMOS Image Sensors in Automotive Volume (K) Forecast, by Application 2020 & 2033
- Table 27: Argentina CMOS Image Sensors in Automotive Revenue (million) Forecast, by Application 2020 & 2033
- Table 28: Argentina CMOS Image Sensors in Automotive Volume (K) Forecast, by Application 2020 & 2033
- Table 29: Rest of South America CMOS Image Sensors in Automotive Revenue (million) Forecast, by Application 2020 & 2033
- Table 30: Rest of South America CMOS Image Sensors in Automotive Volume (K) Forecast, by Application 2020 & 2033
- Table 31: Global CMOS Image Sensors in Automotive Revenue million Forecast, by Application 2020 & 2033
- Table 32: Global CMOS Image Sensors in Automotive Volume K Forecast, by Application 2020 & 2033
- Table 33: Global CMOS Image Sensors in Automotive Revenue million Forecast, by Types 2020 & 2033
- Table 34: Global CMOS Image Sensors in Automotive Volume K Forecast, by Types 2020 & 2033
- Table 35: Global CMOS Image Sensors in Automotive Revenue million Forecast, by Country 2020 & 2033
- Table 36: Global CMOS Image Sensors in Automotive Volume K Forecast, by Country 2020 & 2033
- Table 37: United Kingdom CMOS Image Sensors in Automotive Revenue (million) Forecast, by Application 2020 & 2033
- Table 38: United Kingdom CMOS Image Sensors in Automotive Volume (K) Forecast, by Application 2020 & 2033
- Table 39: Germany CMOS Image Sensors in Automotive Revenue (million) Forecast, by Application 2020 & 2033
- Table 40: Germany CMOS Image Sensors in Automotive Volume (K) Forecast, by Application 2020 & 2033
- Table 41: France CMOS Image Sensors in Automotive Revenue (million) Forecast, by Application 2020 & 2033
- Table 42: France CMOS Image Sensors in Automotive Volume (K) Forecast, by Application 2020 & 2033
- Table 43: Italy CMOS Image Sensors in Automotive Revenue (million) Forecast, by Application 2020 & 2033
- Table 44: Italy CMOS Image Sensors in Automotive Volume (K) Forecast, by Application 2020 & 2033
- Table 45: Spain CMOS Image Sensors in Automotive Revenue (million) Forecast, by Application 2020 & 2033
- Table 46: Spain CMOS Image Sensors in Automotive Volume (K) Forecast, by Application 2020 & 2033
- Table 47: Russia CMOS Image Sensors in Automotive Revenue (million) Forecast, by Application 2020 & 2033
- Table 48: Russia CMOS Image Sensors in Automotive Volume (K) Forecast, by Application 2020 & 2033
- Table 49: Benelux CMOS Image Sensors in Automotive Revenue (million) Forecast, by Application 2020 & 2033
- Table 50: Benelux CMOS Image Sensors in Automotive Volume (K) Forecast, by Application 2020 & 2033
- Table 51: Nordics CMOS Image Sensors in Automotive Revenue (million) Forecast, by Application 2020 & 2033
- Table 52: Nordics CMOS Image Sensors in Automotive Volume (K) Forecast, by Application 2020 & 2033
- Table 53: Rest of Europe CMOS Image Sensors in Automotive Revenue (million) Forecast, by Application 2020 & 2033
- Table 54: Rest of Europe CMOS Image Sensors in Automotive Volume (K) Forecast, by Application 2020 & 2033
- Table 55: Global CMOS Image Sensors in Automotive Revenue million Forecast, by Application 2020 & 2033
- Table 56: Global CMOS Image Sensors in Automotive Volume K Forecast, by Application 2020 & 2033
- Table 57: Global CMOS Image Sensors in Automotive Revenue million Forecast, by Types 2020 & 2033
- Table 58: Global CMOS Image Sensors in Automotive Volume K Forecast, by Types 2020 & 2033
- Table 59: Global CMOS Image Sensors in Automotive Revenue million Forecast, by Country 2020 & 2033
- Table 60: Global CMOS Image Sensors in Automotive Volume K Forecast, by Country 2020 & 2033
- Table 61: Turkey CMOS Image Sensors in Automotive Revenue (million) Forecast, by Application 2020 & 2033
- Table 62: Turkey CMOS Image Sensors in Automotive Volume (K) Forecast, by Application 2020 & 2033
- Table 63: Israel CMOS Image Sensors in Automotive Revenue (million) Forecast, by Application 2020 & 2033
- Table 64: Israel CMOS Image Sensors in Automotive Volume (K) Forecast, by Application 2020 & 2033
- Table 65: GCC CMOS Image Sensors in Automotive Revenue (million) Forecast, by Application 2020 & 2033
- Table 66: GCC CMOS Image Sensors in Automotive Volume (K) Forecast, by Application 2020 & 2033
- Table 67: North Africa CMOS Image Sensors in Automotive Revenue (million) Forecast, by Application 2020 & 2033
- Table 68: North Africa CMOS Image Sensors in Automotive Volume (K) Forecast, by Application 2020 & 2033
- Table 69: South Africa CMOS Image Sensors in Automotive Revenue (million) Forecast, by Application 2020 & 2033
- Table 70: South Africa CMOS Image Sensors in Automotive Volume (K) Forecast, by Application 2020 & 2033
- Table 71: Rest of Middle East & Africa CMOS Image Sensors in Automotive Revenue (million) Forecast, by Application 2020 & 2033
- Table 72: Rest of Middle East & Africa CMOS Image Sensors in Automotive Volume (K) Forecast, by Application 2020 & 2033
- Table 73: Global CMOS Image Sensors in Automotive Revenue million Forecast, by Application 2020 & 2033
- Table 74: Global CMOS Image Sensors in Automotive Volume K Forecast, by Application 2020 & 2033
- Table 75: Global CMOS Image Sensors in Automotive Revenue million Forecast, by Types 2020 & 2033
- Table 76: Global CMOS Image Sensors in Automotive Volume K Forecast, by Types 2020 & 2033
- Table 77: Global CMOS Image Sensors in Automotive Revenue million Forecast, by Country 2020 & 2033
- Table 78: Global CMOS Image Sensors in Automotive Volume K Forecast, by Country 2020 & 2033
- Table 79: China CMOS Image Sensors in Automotive Revenue (million) Forecast, by Application 2020 & 2033
- Table 80: China CMOS Image Sensors in Automotive Volume (K) Forecast, by Application 2020 & 2033
- Table 81: India CMOS Image Sensors in Automotive Revenue (million) Forecast, by Application 2020 & 2033
- Table 82: India CMOS Image Sensors in Automotive Volume (K) Forecast, by Application 2020 & 2033
- Table 83: Japan CMOS Image Sensors in Automotive Revenue (million) Forecast, by Application 2020 & 2033
- Table 84: Japan CMOS Image Sensors in Automotive Volume (K) Forecast, by Application 2020 & 2033
- Table 85: South Korea CMOS Image Sensors in Automotive Revenue (million) Forecast, by Application 2020 & 2033
- Table 86: South Korea CMOS Image Sensors in Automotive Volume (K) Forecast, by Application 2020 & 2033
- Table 87: ASEAN CMOS Image Sensors in Automotive Revenue (million) Forecast, by Application 2020 & 2033
- Table 88: ASEAN CMOS Image Sensors in Automotive Volume (K) Forecast, by Application 2020 & 2033
- Table 89: Oceania CMOS Image Sensors in Automotive Revenue (million) Forecast, by Application 2020 & 2033
- Table 90: Oceania CMOS Image Sensors in Automotive Volume (K) Forecast, by Application 2020 & 2033
- Table 91: Rest of Asia Pacific CMOS Image Sensors in Automotive Revenue (million) Forecast, by Application 2020 & 2033
- Table 92: Rest of Asia Pacific CMOS Image Sensors in Automotive Volume (K) Forecast, by Application 2020 & 2033
Frequently Asked Questions
1. What is the projected Compound Annual Growth Rate (CAGR) of the CMOS Image Sensors in Automotive?
The projected CAGR is approximately XX%.
2. Which companies are prominent players in the CMOS Image Sensors in Automotive?
Key companies in the market include AdTech Optics, Block Engineering, Hamamatsu Photonics, Pranalytica, Thorlabs, Akela Laser, Alpes Lasers, Daylight Solutions, LASERMAX, mirSense, Nanoplus Nanosystems and Technologies, Wavelength Electronics, Quantum Cascade Lasers Breakdown Data by Type, C-Mount, HHL & VHL Package, TO3 Package.
3. What are the main segments of the CMOS Image Sensors in Automotive?
The market segments include Application, Types.
4. Can you provide details about the market size?
The market size is estimated to be USD XXX million as of 2022.
5. What are some drivers contributing to market growth?
N/A
6. What are the notable trends driving market growth?
N/A
7. Are there any restraints impacting market growth?
N/A
8. Can you provide examples of recent developments in the market?
N/A
9. What pricing options are available for accessing the report?
Pricing options include single-user, multi-user, and enterprise licenses priced at USD 3350.00, USD 5025.00, and USD 6700.00 respectively.
10. Is the market size provided in terms of value or volume?
The market size is provided in terms of value, measured in million and volume, measured in K.
11. Are there any specific market keywords associated with the report?
Yes, the market keyword associated with the report is "CMOS Image Sensors in Automotive," which aids in identifying and referencing the specific market segment covered.
12. How do I determine which pricing option suits my needs best?
The pricing options vary based on user requirements and access needs. Individual users may opt for single-user licenses, while businesses requiring broader access may choose multi-user or enterprise licenses for cost-effective access to the report.
13. Are there any additional resources or data provided in the CMOS Image Sensors in Automotive report?
While the report offers comprehensive insights, it's advisable to review the specific contents or supplementary materials provided to ascertain if additional resources or data are available.
14. How can I stay updated on further developments or reports in the CMOS Image Sensors in Automotive?
To stay informed about further developments, trends, and reports in the CMOS Image Sensors in Automotive, consider subscribing to industry newsletters, following relevant companies and organizations, or regularly checking reputable industry news sources and publications.
Methodology
Step 1 - Identification of Relevant Samples Size from Population Database


Step 2 - Approaches for Defining Global Market Size (Value, Volume* & Price*)

Note*: In applicable scenarios
Step 3 - Data Sources
Primary Research
- Web Analytics
- Survey Reports
- Research Institute
- Latest Research Reports
- Opinion Leaders
Secondary Research
- Annual Reports
- White Paper
- Latest Press Release
- Industry Association
- Paid Database
- Investor Presentations

Step 4 - Data Triangulation
Involves using different sources of information in order to increase the validity of a study
These sources are likely to be stakeholders in a program - participants, other researchers, program staff, other community members, and so on.
Then we put all data in single framework & apply various statistical tools to find out the dynamic on the market.
During the analysis stage, feedback from the stakeholder groups would be compared to determine areas of agreement as well as areas of divergence