


Key Insights
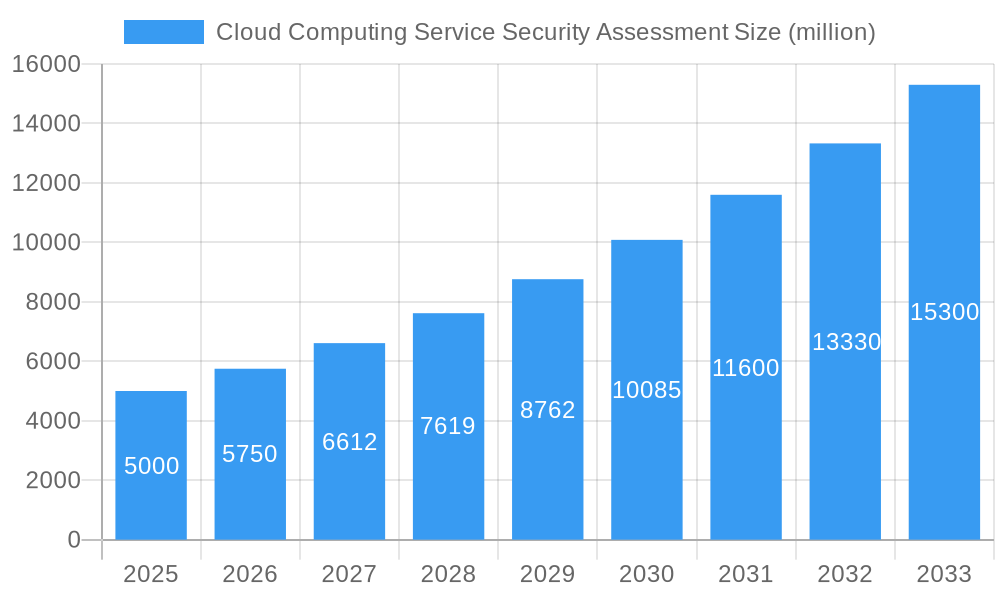
The Cloud Computing Service Security Assessment market is experiencing robust growth, driven by the increasing adoption of cloud services across various industries and the escalating need to mitigate associated security risks. The market's expansion is fueled by the rising complexity of cloud environments, necessitating comprehensive security assessments to identify vulnerabilities and ensure compliance with regulatory standards like GDPR and HIPAA. Organizations are prioritizing proactive security measures to prevent data breaches, ransomware attacks, and other cyber threats, leading to a surge in demand for cloud security assessment services. Furthermore, the shift towards cloud-native applications and microservices architectures is introducing new security challenges, further driving market growth. We estimate the market size in 2025 to be approximately $5 billion, with a Compound Annual Growth Rate (CAGR) of 15% projected for the period 2025-2033. This growth is attributed to factors such as increasing cloud adoption by SMEs and large enterprises alike, rising awareness of cloud security threats, and the expanding offerings of managed security service providers (MSSPs).
Cloud Computing Service Security Assessment Market Size (In Billion)

The market is segmented by service type (vulnerability assessments, penetration testing, compliance audits, security posture management), deployment model (public, private, hybrid), organization size (small, medium, large), and industry vertical (BFSI, healthcare, retail, etc.). Key players like CrowdStrike, Mandiant, and PwC are investing heavily in research and development to enhance their security assessment capabilities and expand their service offerings. Competition is fierce, with companies differentiating themselves through specialized expertise, innovative technologies, and strategic partnerships. While the market faces restraints such as skill shortages in cybersecurity professionals and the evolving nature of cyber threats, the overall growth trajectory remains positive, driven by a persistent need for robust cloud security solutions. Geographical expansion, especially in emerging economies, is also expected to significantly contribute to the market's expansion in the coming years.
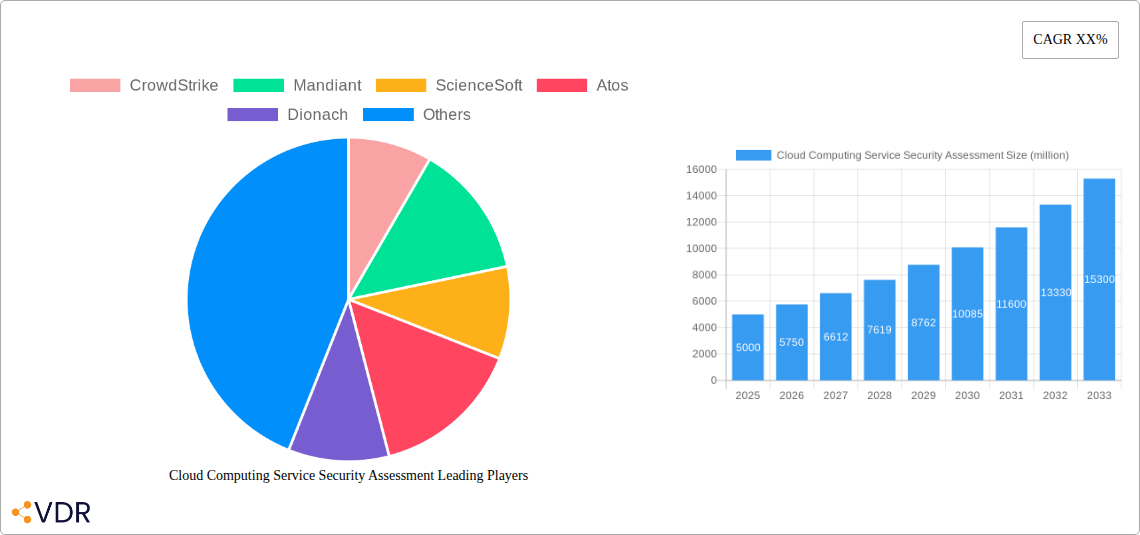
Cloud Computing Service Security Assessment Company Market Share
Cloud Computing Service Security Assessment Market Report: 2019-2033
This comprehensive report provides a detailed analysis of the Cloud Computing Service Security Assessment market, encompassing market dynamics, growth trends, regional dominance, product landscape, challenges, opportunities, and key players. The study period spans from 2019 to 2033, with a base year of 2025 and a forecast period of 2025-2033. The historical period covered is 2019-2024. The report is essential for cybersecurity professionals, investors, and businesses seeking to understand and navigate this rapidly evolving market. The market is expected to reach xx million by 2033.
Cloud Computing Service Security Assessment Market Dynamics & Structure
This section analyzes the market's competitive landscape, technological advancements, regulatory influences, and market trends. The global cloud computing security assessment market is fragmented, with several major players and numerous smaller niche firms vying for market share. The market size in 2025 is estimated at $xx million.
- Market Concentration: The market exhibits moderate concentration, with the top 5 players holding approximately xx% of the market share in 2025.
- Technological Innovation: AI-powered threat detection, automation of security assessments, and blockchain-based security are key innovation drivers. Barriers to innovation include the high cost of R&D and the need for skilled cybersecurity professionals.
- Regulatory Frameworks: Compliance with regulations like GDPR, CCPA, and HIPAA significantly impacts market growth and drives demand for robust security assessments.
- Competitive Product Substitutes: Open-source security tools and in-house developed solutions pose competitive threats.
- End-User Demographics: The primary end-users are large enterprises, SMEs, and government organizations across various sectors like BFSI, healthcare, and retail.
- M&A Trends: The market has witnessed xx M&A deals in the historical period, indicating consolidation and expansion strategies among key players. This trend is expected to continue, driving market growth in the forecast period.
Cloud Computing Service Security Assessment Growth Trends & Insights
The Cloud Computing Service Security Assessment market is experiencing robust growth, driven by the increasing adoption of cloud services and heightened cybersecurity concerns. The market exhibited a CAGR of xx% during the historical period (2019-2024) and is projected to maintain a CAGR of xx% during the forecast period (2025-2033), reaching an estimated value of xx million by 2033. This growth is attributed to factors such as rising cloud adoption rates across various industries, stringent data privacy regulations, and the increasing sophistication of cyber threats. Market penetration is estimated at xx% in 2025, with significant growth potential remaining in untapped markets and emerging technologies. Technological disruptions, such as the rise of serverless computing and edge computing, are driving further demand for specialized security assessments. Consumer behavior shifts, with a growing preference for cloud-based solutions and increased awareness of data security risks, are fueling market expansion.
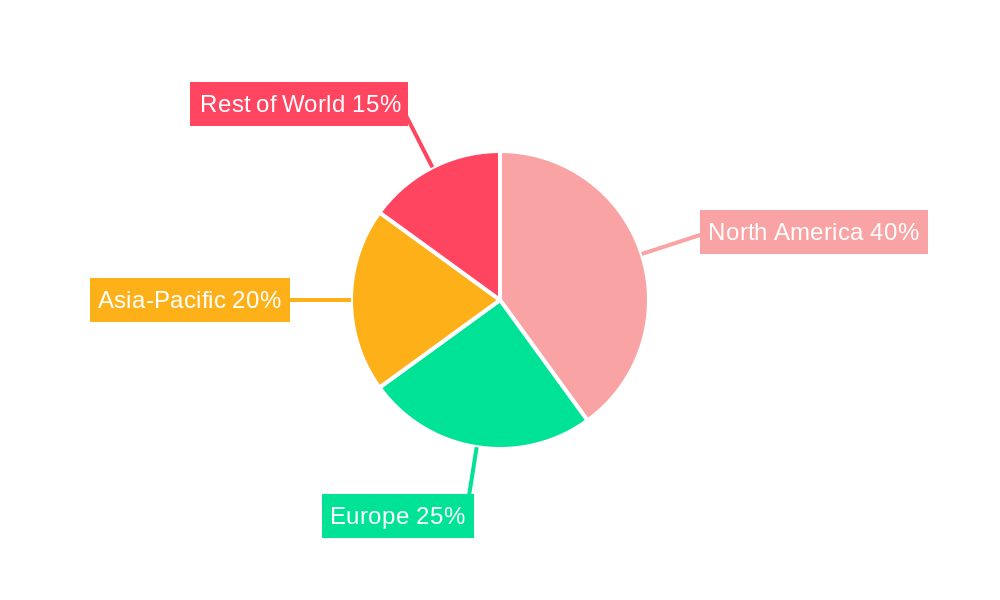
Dominant Regions, Countries, or Segments in Cloud Computing Service Security Assessment
North America currently dominates the Cloud Computing Service Security Assessment market, holding the largest market share in 2025, followed by Europe and Asia-Pacific.
- Key Drivers in North America: Strong regulatory frameworks, high cloud adoption rates, and the presence of major technology companies.
- Key Drivers in Europe: Stringent data privacy regulations (GDPR) and growing awareness of cybersecurity threats.
- Key Drivers in Asia-Pacific: Rapid cloud adoption, particularly in emerging economies, and increasing government investments in cybersecurity infrastructure.
Market dominance is largely driven by factors such as technological advancements, regulatory landscapes, and the concentration of major players within specific regions. The Asia-Pacific region is projected to exhibit the highest growth rate during the forecast period, fueled by increasing cloud adoption and a growing digital economy.
Cloud Computing Service Security Assessment Product Landscape
The market offers a range of services including vulnerability assessments, penetration testing, compliance audits, and security posture management. Recent innovations include AI-powered threat detection, automated security assessments, and specialized solutions for specific cloud platforms. These offerings differentiate themselves through unique selling propositions such as speed, accuracy, and comprehensive reporting. The focus on automation and integration with existing security tools enhances efficiency and reduces operational costs.
Key Drivers, Barriers & Challenges in Cloud Computing Service Security Assessment
Key Drivers: Rising adoption of cloud services, increasing cyber threats, stringent data privacy regulations, and growing awareness of cloud security risks are the major drivers.
Key Challenges: The high cost of security assessments, shortage of skilled cybersecurity professionals, complexity of cloud environments, and evolving cyber threats pose significant challenges to market growth. These challenges can reduce market expansion by an estimated xx% annually if not adequately addressed. Supply chain vulnerabilities within the cloud ecosystem also contribute to this issue.
Emerging Opportunities in Cloud Computing Service Security Assessment
Emerging opportunities include the expanding adoption of serverless computing, edge computing, and IoT devices, requiring specialized security assessments. Untapped markets in developing economies and the increasing need for AI-powered security solutions present significant growth potential. The demand for managed security services and security automation are also driving market expansion.
Growth Accelerators in the Cloud Computing Service Security Assessment Industry
Technological advancements in AI and automation will drive market growth. Strategic partnerships between security vendors and cloud providers will create comprehensive security solutions. Expansion into new geographic markets and the development of specialized solutions for emerging technologies, such as blockchain and quantum computing, will further accelerate market growth.
Key Players Shaping the Cloud Computing Service Security Assessment Market
- CrowdStrike
- Mandiant
- ScienceSoft
- Atos
- Dionach
- Kualitatem
- Microminder
- Check Point
- Kroll
- LMG Security
- PwC
- Vumetric
- SBS CyberSecurity
- Pentest People
- IT Governance
- Teceze
- SecuriCentrix
Notable Milestones in Cloud Computing Service Security Assessment Sector
- 2020: Increased adoption of cloud security posture management (CSPM) tools.
- 2021: Significant rise in ransomware attacks targeting cloud environments.
- 2022: Launch of several AI-powered cloud security assessment platforms.
- 2023: Growing emphasis on cloud compliance and regulatory adherence.
In-Depth Cloud Computing Service Security Assessment Market Outlook
The Cloud Computing Service Security Assessment market is poised for continued robust growth, driven by ongoing technological advancements and the increasing reliance on cloud services. Strategic partnerships, expansion into new markets, and innovation in security technologies will shape the future of this sector. The market offers significant opportunities for both established players and new entrants with innovative solutions. The long-term outlook is positive, with significant potential for market expansion and profitability.
Cloud Computing Service Security Assessment Segmentation
-
1. Application
- 1.1. SMEs
- 1.2. Large Enterprises
-
2. Types
- 2.1. Data Security Assessment
- 2.2. System Security Assessment
- 2.3. Identity Authentication and Access Control Assessment
- 2.4. Physical Security Assessment
- 2.5. Security Compliance Assessment
- 2.6. Others
Cloud Computing Service Security Assessment Segmentation By Geography
-
1. North America
- 1.1. United States
- 1.2. Canada
- 1.3. Mexico
-
2. South America
- 2.1. Brazil
- 2.2. Argentina
- 2.3. Rest of South America
-
3. Europe
- 3.1. United Kingdom
- 3.2. Germany
- 3.3. France
- 3.4. Italy
- 3.5. Spain
- 3.6. Russia
- 3.7. Benelux
- 3.8. Nordics
- 3.9. Rest of Europe
-
4. Middle East & Africa
- 4.1. Turkey
- 4.2. Israel
- 4.3. GCC
- 4.4. North Africa
- 4.5. South Africa
- 4.6. Rest of Middle East & Africa
-
5. Asia Pacific
- 5.1. China
- 5.2. India
- 5.3. Japan
- 5.4. South Korea
- 5.5. ASEAN
- 5.6. Oceania
- 5.7. Rest of Asia Pacific
Cloud Computing Service Security Assessment Regional Market Share
Geographic Coverage of Cloud Computing Service Security Assessment
Cloud Computing Service Security Assessment REPORT HIGHLIGHTS
| Aspects | Details |
|---|---|
| Study Period | 2020-2034 |
| Base Year | 2025 |
| Estimated Year | 2026 |
| Forecast Period | 2026-2034 |
| Historical Period | 2020-2025 |
| Growth Rate | CAGR of XX% from 2020-2034 |
| Segmentation |
|
Table of Contents
- 1. Introduction
- 1.1. Research Scope
- 1.2. Market Segmentation
- 1.3. Research Methodology
- 1.4. Definitions and Assumptions
- 2. Executive Summary
- 2.1. Introduction
- 3. Market Dynamics
- 3.1. Introduction
- 3.2. Market Drivers
- 3.3. Market Restrains
- 3.4. Market Trends
- 4. Market Factor Analysis
- 4.1. Porters Five Forces
- 4.2. Supply/Value Chain
- 4.3. PESTEL analysis
- 4.4. Market Entropy
- 4.5. Patent/Trademark Analysis
- 5. Global Cloud Computing Service Security Assessment Analysis, Insights and Forecast, 2020-2032
- 5.1. Market Analysis, Insights and Forecast - by Application
- 5.1.1. SMEs
- 5.1.2. Large Enterprises
- 5.2. Market Analysis, Insights and Forecast - by Types
- 5.2.1. Data Security Assessment
- 5.2.2. System Security Assessment
- 5.2.3. Identity Authentication and Access Control Assessment
- 5.2.4. Physical Security Assessment
- 5.2.5. Security Compliance Assessment
- 5.2.6. Others
- 5.3. Market Analysis, Insights and Forecast - by Region
- 5.3.1. North America
- 5.3.2. South America
- 5.3.3. Europe
- 5.3.4. Middle East & Africa
- 5.3.5. Asia Pacific
- 5.1. Market Analysis, Insights and Forecast - by Application
- 6. North America Cloud Computing Service Security Assessment Analysis, Insights and Forecast, 2020-2032
- 6.1. Market Analysis, Insights and Forecast - by Application
- 6.1.1. SMEs
- 6.1.2. Large Enterprises
- 6.2. Market Analysis, Insights and Forecast - by Types
- 6.2.1. Data Security Assessment
- 6.2.2. System Security Assessment
- 6.2.3. Identity Authentication and Access Control Assessment
- 6.2.4. Physical Security Assessment
- 6.2.5. Security Compliance Assessment
- 6.2.6. Others
- 6.1. Market Analysis, Insights and Forecast - by Application
- 7. South America Cloud Computing Service Security Assessment Analysis, Insights and Forecast, 2020-2032
- 7.1. Market Analysis, Insights and Forecast - by Application
- 7.1.1. SMEs
- 7.1.2. Large Enterprises
- 7.2. Market Analysis, Insights and Forecast - by Types
- 7.2.1. Data Security Assessment
- 7.2.2. System Security Assessment
- 7.2.3. Identity Authentication and Access Control Assessment
- 7.2.4. Physical Security Assessment
- 7.2.5. Security Compliance Assessment
- 7.2.6. Others
- 7.1. Market Analysis, Insights and Forecast - by Application
- 8. Europe Cloud Computing Service Security Assessment Analysis, Insights and Forecast, 2020-2032
- 8.1. Market Analysis, Insights and Forecast - by Application
- 8.1.1. SMEs
- 8.1.2. Large Enterprises
- 8.2. Market Analysis, Insights and Forecast - by Types
- 8.2.1. Data Security Assessment
- 8.2.2. System Security Assessment
- 8.2.3. Identity Authentication and Access Control Assessment
- 8.2.4. Physical Security Assessment
- 8.2.5. Security Compliance Assessment
- 8.2.6. Others
- 8.1. Market Analysis, Insights and Forecast - by Application
- 9. Middle East & Africa Cloud Computing Service Security Assessment Analysis, Insights and Forecast, 2020-2032
- 9.1. Market Analysis, Insights and Forecast - by Application
- 9.1.1. SMEs
- 9.1.2. Large Enterprises
- 9.2. Market Analysis, Insights and Forecast - by Types
- 9.2.1. Data Security Assessment
- 9.2.2. System Security Assessment
- 9.2.3. Identity Authentication and Access Control Assessment
- 9.2.4. Physical Security Assessment
- 9.2.5. Security Compliance Assessment
- 9.2.6. Others
- 9.1. Market Analysis, Insights and Forecast - by Application
- 10. Asia Pacific Cloud Computing Service Security Assessment Analysis, Insights and Forecast, 2020-2032
- 10.1. Market Analysis, Insights and Forecast - by Application
- 10.1.1. SMEs
- 10.1.2. Large Enterprises
- 10.2. Market Analysis, Insights and Forecast - by Types
- 10.2.1. Data Security Assessment
- 10.2.2. System Security Assessment
- 10.2.3. Identity Authentication and Access Control Assessment
- 10.2.4. Physical Security Assessment
- 10.2.5. Security Compliance Assessment
- 10.2.6. Others
- 10.1. Market Analysis, Insights and Forecast - by Application
- 11. Competitive Analysis
- 11.1. Global Market Share Analysis 2025
- 11.2. Company Profiles
- 11.2.1 CrowdStrike
- 11.2.1.1. Overview
- 11.2.1.2. Products
- 11.2.1.3. SWOT Analysis
- 11.2.1.4. Recent Developments
- 11.2.1.5. Financials (Based on Availability)
- 11.2.2 Mandiant
- 11.2.2.1. Overview
- 11.2.2.2. Products
- 11.2.2.3. SWOT Analysis
- 11.2.2.4. Recent Developments
- 11.2.2.5. Financials (Based on Availability)
- 11.2.3 ScienceSoft
- 11.2.3.1. Overview
- 11.2.3.2. Products
- 11.2.3.3. SWOT Analysis
- 11.2.3.4. Recent Developments
- 11.2.3.5. Financials (Based on Availability)
- 11.2.4 Atos
- 11.2.4.1. Overview
- 11.2.4.2. Products
- 11.2.4.3. SWOT Analysis
- 11.2.4.4. Recent Developments
- 11.2.4.5. Financials (Based on Availability)
- 11.2.5 Dionach
- 11.2.5.1. Overview
- 11.2.5.2. Products
- 11.2.5.3. SWOT Analysis
- 11.2.5.4. Recent Developments
- 11.2.5.5. Financials (Based on Availability)
- 11.2.6 Kualitatem
- 11.2.6.1. Overview
- 11.2.6.2. Products
- 11.2.6.3. SWOT Analysis
- 11.2.6.4. Recent Developments
- 11.2.6.5. Financials (Based on Availability)
- 11.2.7 Microminder
- 11.2.7.1. Overview
- 11.2.7.2. Products
- 11.2.7.3. SWOT Analysis
- 11.2.7.4. Recent Developments
- 11.2.7.5. Financials (Based on Availability)
- 11.2.8 Check Point
- 11.2.8.1. Overview
- 11.2.8.2. Products
- 11.2.8.3. SWOT Analysis
- 11.2.8.4. Recent Developments
- 11.2.8.5. Financials (Based on Availability)
- 11.2.9 Kroll
- 11.2.9.1. Overview
- 11.2.9.2. Products
- 11.2.9.3. SWOT Analysis
- 11.2.9.4. Recent Developments
- 11.2.9.5. Financials (Based on Availability)
- 11.2.10 LMG Security
- 11.2.10.1. Overview
- 11.2.10.2. Products
- 11.2.10.3. SWOT Analysis
- 11.2.10.4. Recent Developments
- 11.2.10.5. Financials (Based on Availability)
- 11.2.11 PwC
- 11.2.11.1. Overview
- 11.2.11.2. Products
- 11.2.11.3. SWOT Analysis
- 11.2.11.4. Recent Developments
- 11.2.11.5. Financials (Based on Availability)
- 11.2.12 Vumetric
- 11.2.12.1. Overview
- 11.2.12.2. Products
- 11.2.12.3. SWOT Analysis
- 11.2.12.4. Recent Developments
- 11.2.12.5. Financials (Based on Availability)
- 11.2.13 SBS CyberSecurity
- 11.2.13.1. Overview
- 11.2.13.2. Products
- 11.2.13.3. SWOT Analysis
- 11.2.13.4. Recent Developments
- 11.2.13.5. Financials (Based on Availability)
- 11.2.14 Pentest People
- 11.2.14.1. Overview
- 11.2.14.2. Products
- 11.2.14.3. SWOT Analysis
- 11.2.14.4. Recent Developments
- 11.2.14.5. Financials (Based on Availability)
- 11.2.15 IT Governance
- 11.2.15.1. Overview
- 11.2.15.2. Products
- 11.2.15.3. SWOT Analysis
- 11.2.15.4. Recent Developments
- 11.2.15.5. Financials (Based on Availability)
- 11.2.16 Teceze
- 11.2.16.1. Overview
- 11.2.16.2. Products
- 11.2.16.3. SWOT Analysis
- 11.2.16.4. Recent Developments
- 11.2.16.5. Financials (Based on Availability)
- 11.2.17 SecuriCentrix
- 11.2.17.1. Overview
- 11.2.17.2. Products
- 11.2.17.3. SWOT Analysis
- 11.2.17.4. Recent Developments
- 11.2.17.5. Financials (Based on Availability)
- 11.2.1 CrowdStrike
List of Figures
- Figure 1: Global Cloud Computing Service Security Assessment Revenue Breakdown (million, %) by Region 2025 & 2033
- Figure 2: North America Cloud Computing Service Security Assessment Revenue (million), by Application 2025 & 2033
- Figure 3: North America Cloud Computing Service Security Assessment Revenue Share (%), by Application 2025 & 2033
- Figure 4: North America Cloud Computing Service Security Assessment Revenue (million), by Types 2025 & 2033
- Figure 5: North America Cloud Computing Service Security Assessment Revenue Share (%), by Types 2025 & 2033
- Figure 6: North America Cloud Computing Service Security Assessment Revenue (million), by Country 2025 & 2033
- Figure 7: North America Cloud Computing Service Security Assessment Revenue Share (%), by Country 2025 & 2033
- Figure 8: South America Cloud Computing Service Security Assessment Revenue (million), by Application 2025 & 2033
- Figure 9: South America Cloud Computing Service Security Assessment Revenue Share (%), by Application 2025 & 2033
- Figure 10: South America Cloud Computing Service Security Assessment Revenue (million), by Types 2025 & 2033
- Figure 11: South America Cloud Computing Service Security Assessment Revenue Share (%), by Types 2025 & 2033
- Figure 12: South America Cloud Computing Service Security Assessment Revenue (million), by Country 2025 & 2033
- Figure 13: South America Cloud Computing Service Security Assessment Revenue Share (%), by Country 2025 & 2033
- Figure 14: Europe Cloud Computing Service Security Assessment Revenue (million), by Application 2025 & 2033
- Figure 15: Europe Cloud Computing Service Security Assessment Revenue Share (%), by Application 2025 & 2033
- Figure 16: Europe Cloud Computing Service Security Assessment Revenue (million), by Types 2025 & 2033
- Figure 17: Europe Cloud Computing Service Security Assessment Revenue Share (%), by Types 2025 & 2033
- Figure 18: Europe Cloud Computing Service Security Assessment Revenue (million), by Country 2025 & 2033
- Figure 19: Europe Cloud Computing Service Security Assessment Revenue Share (%), by Country 2025 & 2033
- Figure 20: Middle East & Africa Cloud Computing Service Security Assessment Revenue (million), by Application 2025 & 2033
- Figure 21: Middle East & Africa Cloud Computing Service Security Assessment Revenue Share (%), by Application 2025 & 2033
- Figure 22: Middle East & Africa Cloud Computing Service Security Assessment Revenue (million), by Types 2025 & 2033
- Figure 23: Middle East & Africa Cloud Computing Service Security Assessment Revenue Share (%), by Types 2025 & 2033
- Figure 24: Middle East & Africa Cloud Computing Service Security Assessment Revenue (million), by Country 2025 & 2033
- Figure 25: Middle East & Africa Cloud Computing Service Security Assessment Revenue Share (%), by Country 2025 & 2033
- Figure 26: Asia Pacific Cloud Computing Service Security Assessment Revenue (million), by Application 2025 & 2033
- Figure 27: Asia Pacific Cloud Computing Service Security Assessment Revenue Share (%), by Application 2025 & 2033
- Figure 28: Asia Pacific Cloud Computing Service Security Assessment Revenue (million), by Types 2025 & 2033
- Figure 29: Asia Pacific Cloud Computing Service Security Assessment Revenue Share (%), by Types 2025 & 2033
- Figure 30: Asia Pacific Cloud Computing Service Security Assessment Revenue (million), by Country 2025 & 2033
- Figure 31: Asia Pacific Cloud Computing Service Security Assessment Revenue Share (%), by Country 2025 & 2033
List of Tables
- Table 1: Global Cloud Computing Service Security Assessment Revenue million Forecast, by Application 2020 & 2033
- Table 2: Global Cloud Computing Service Security Assessment Revenue million Forecast, by Types 2020 & 2033
- Table 3: Global Cloud Computing Service Security Assessment Revenue million Forecast, by Region 2020 & 2033
- Table 4: Global Cloud Computing Service Security Assessment Revenue million Forecast, by Application 2020 & 2033
- Table 5: Global Cloud Computing Service Security Assessment Revenue million Forecast, by Types 2020 & 2033
- Table 6: Global Cloud Computing Service Security Assessment Revenue million Forecast, by Country 2020 & 2033
- Table 7: United States Cloud Computing Service Security Assessment Revenue (million) Forecast, by Application 2020 & 2033
- Table 8: Canada Cloud Computing Service Security Assessment Revenue (million) Forecast, by Application 2020 & 2033
- Table 9: Mexico Cloud Computing Service Security Assessment Revenue (million) Forecast, by Application 2020 & 2033
- Table 10: Global Cloud Computing Service Security Assessment Revenue million Forecast, by Application 2020 & 2033
- Table 11: Global Cloud Computing Service Security Assessment Revenue million Forecast, by Types 2020 & 2033
- Table 12: Global Cloud Computing Service Security Assessment Revenue million Forecast, by Country 2020 & 2033
- Table 13: Brazil Cloud Computing Service Security Assessment Revenue (million) Forecast, by Application 2020 & 2033
- Table 14: Argentina Cloud Computing Service Security Assessment Revenue (million) Forecast, by Application 2020 & 2033
- Table 15: Rest of South America Cloud Computing Service Security Assessment Revenue (million) Forecast, by Application 2020 & 2033
- Table 16: Global Cloud Computing Service Security Assessment Revenue million Forecast, by Application 2020 & 2033
- Table 17: Global Cloud Computing Service Security Assessment Revenue million Forecast, by Types 2020 & 2033
- Table 18: Global Cloud Computing Service Security Assessment Revenue million Forecast, by Country 2020 & 2033
- Table 19: United Kingdom Cloud Computing Service Security Assessment Revenue (million) Forecast, by Application 2020 & 2033
- Table 20: Germany Cloud Computing Service Security Assessment Revenue (million) Forecast, by Application 2020 & 2033
- Table 21: France Cloud Computing Service Security Assessment Revenue (million) Forecast, by Application 2020 & 2033
- Table 22: Italy Cloud Computing Service Security Assessment Revenue (million) Forecast, by Application 2020 & 2033
- Table 23: Spain Cloud Computing Service Security Assessment Revenue (million) Forecast, by Application 2020 & 2033
- Table 24: Russia Cloud Computing Service Security Assessment Revenue (million) Forecast, by Application 2020 & 2033
- Table 25: Benelux Cloud Computing Service Security Assessment Revenue (million) Forecast, by Application 2020 & 2033
- Table 26: Nordics Cloud Computing Service Security Assessment Revenue (million) Forecast, by Application 2020 & 2033
- Table 27: Rest of Europe Cloud Computing Service Security Assessment Revenue (million) Forecast, by Application 2020 & 2033
- Table 28: Global Cloud Computing Service Security Assessment Revenue million Forecast, by Application 2020 & 2033
- Table 29: Global Cloud Computing Service Security Assessment Revenue million Forecast, by Types 2020 & 2033
- Table 30: Global Cloud Computing Service Security Assessment Revenue million Forecast, by Country 2020 & 2033
- Table 31: Turkey Cloud Computing Service Security Assessment Revenue (million) Forecast, by Application 2020 & 2033
- Table 32: Israel Cloud Computing Service Security Assessment Revenue (million) Forecast, by Application 2020 & 2033
- Table 33: GCC Cloud Computing Service Security Assessment Revenue (million) Forecast, by Application 2020 & 2033
- Table 34: North Africa Cloud Computing Service Security Assessment Revenue (million) Forecast, by Application 2020 & 2033
- Table 35: South Africa Cloud Computing Service Security Assessment Revenue (million) Forecast, by Application 2020 & 2033
- Table 36: Rest of Middle East & Africa Cloud Computing Service Security Assessment Revenue (million) Forecast, by Application 2020 & 2033
- Table 37: Global Cloud Computing Service Security Assessment Revenue million Forecast, by Application 2020 & 2033
- Table 38: Global Cloud Computing Service Security Assessment Revenue million Forecast, by Types 2020 & 2033
- Table 39: Global Cloud Computing Service Security Assessment Revenue million Forecast, by Country 2020 & 2033
- Table 40: China Cloud Computing Service Security Assessment Revenue (million) Forecast, by Application 2020 & 2033
- Table 41: India Cloud Computing Service Security Assessment Revenue (million) Forecast, by Application 2020 & 2033
- Table 42: Japan Cloud Computing Service Security Assessment Revenue (million) Forecast, by Application 2020 & 2033
- Table 43: South Korea Cloud Computing Service Security Assessment Revenue (million) Forecast, by Application 2020 & 2033
- Table 44: ASEAN Cloud Computing Service Security Assessment Revenue (million) Forecast, by Application 2020 & 2033
- Table 45: Oceania Cloud Computing Service Security Assessment Revenue (million) Forecast, by Application 2020 & 2033
- Table 46: Rest of Asia Pacific Cloud Computing Service Security Assessment Revenue (million) Forecast, by Application 2020 & 2033
Frequently Asked Questions
1. What is the projected Compound Annual Growth Rate (CAGR) of the Cloud Computing Service Security Assessment?
The projected CAGR is approximately XX%.
2. Which companies are prominent players in the Cloud Computing Service Security Assessment?
Key companies in the market include CrowdStrike, Mandiant, ScienceSoft, Atos, Dionach, Kualitatem, Microminder, Check Point, Kroll, LMG Security, PwC, Vumetric, SBS CyberSecurity, Pentest People, IT Governance, Teceze, SecuriCentrix.
3. What are the main segments of the Cloud Computing Service Security Assessment?
The market segments include Application, Types.
4. Can you provide details about the market size?
The market size is estimated to be USD XXX million as of 2022.
5. What are some drivers contributing to market growth?
N/A
6. What are the notable trends driving market growth?
N/A
7. Are there any restraints impacting market growth?
N/A
8. Can you provide examples of recent developments in the market?
N/A
9. What pricing options are available for accessing the report?
Pricing options include single-user, multi-user, and enterprise licenses priced at USD 2900.00, USD 4350.00, and USD 5800.00 respectively.
10. Is the market size provided in terms of value or volume?
The market size is provided in terms of value, measured in million.
11. Are there any specific market keywords associated with the report?
Yes, the market keyword associated with the report is "Cloud Computing Service Security Assessment," which aids in identifying and referencing the specific market segment covered.
12. How do I determine which pricing option suits my needs best?
The pricing options vary based on user requirements and access needs. Individual users may opt for single-user licenses, while businesses requiring broader access may choose multi-user or enterprise licenses for cost-effective access to the report.
13. Are there any additional resources or data provided in the Cloud Computing Service Security Assessment report?
While the report offers comprehensive insights, it's advisable to review the specific contents or supplementary materials provided to ascertain if additional resources or data are available.
14. How can I stay updated on further developments or reports in the Cloud Computing Service Security Assessment?
To stay informed about further developments, trends, and reports in the Cloud Computing Service Security Assessment, consider subscribing to industry newsletters, following relevant companies and organizations, or regularly checking reputable industry news sources and publications.
Methodology
Step 1 - Identification of Relevant Samples Size from Population Database


Step 2 - Approaches for Defining Global Market Size (Value, Volume* & Price*)

Note*: In applicable scenarios
Step 3 - Data Sources
Primary Research
- Web Analytics
- Survey Reports
- Research Institute
- Latest Research Reports
- Opinion Leaders
Secondary Research
- Annual Reports
- White Paper
- Latest Press Release
- Industry Association
- Paid Database
- Investor Presentations

Step 4 - Data Triangulation
Involves using different sources of information in order to increase the validity of a study
These sources are likely to be stakeholders in a program - participants, other researchers, program staff, other community members, and so on.
Then we put all data in single framework & apply various statistical tools to find out the dynamic on the market.
During the analysis stage, feedback from the stakeholder groups would be compared to determine areas of agreement as well as areas of divergence