
Key Insights
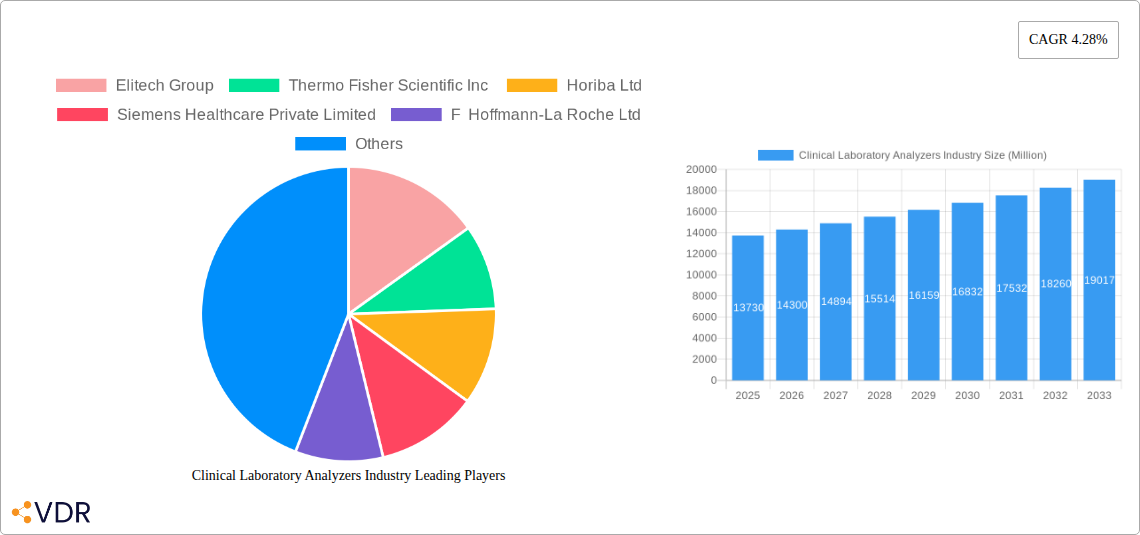
The global clinical laboratory analyzers market, valued at $13.73 billion in 2025, is projected to experience robust growth, driven by several key factors. The rising prevalence of chronic diseases like diabetes, cardiovascular diseases, and cancer necessitates increased diagnostic testing, fueling demand for advanced analyzers. Technological advancements, such as the development of automated, high-throughput analyzers and point-of-care testing devices, are enhancing efficiency and accessibility of diagnostics. Furthermore, the increasing adoption of preventive healthcare measures and rising geriatric population contribute to market expansion. The market is segmented by product type (analyzers, reagents, others), test type (liver panels, electrolyte panels, thyroid function panels, lipid profiles, others), and end-user (hospitals, diagnostic laboratories, academic institutes, others). The competitive landscape features both established players like Thermo Fisher Scientific, Roche, and Abbott, and emerging companies offering innovative solutions. Geographical expansion, particularly in developing economies with growing healthcare infrastructure, presents significant opportunities.
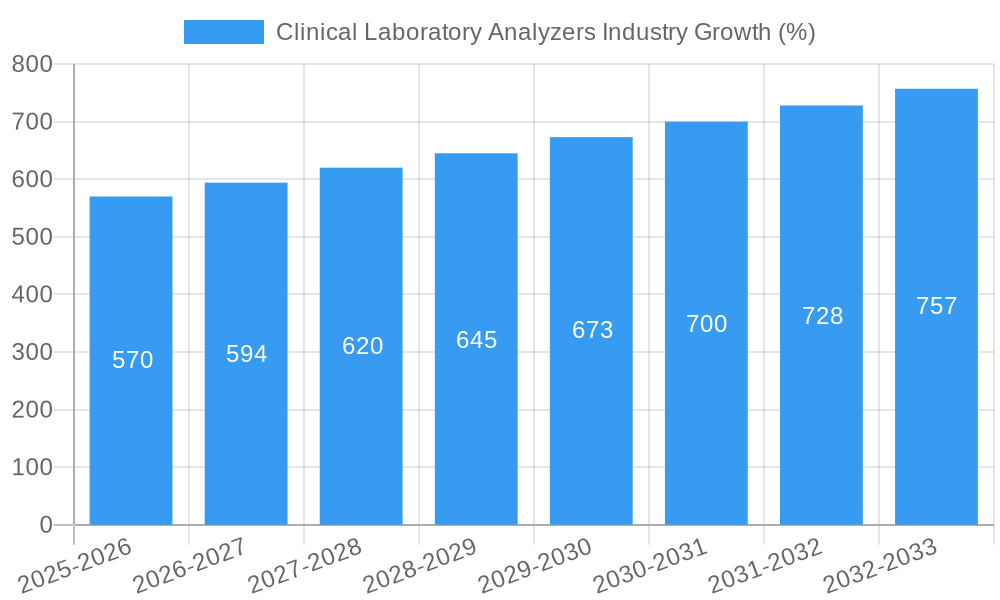
However, the market faces certain challenges. High initial investment costs associated with acquiring advanced analyzers can be a barrier for smaller laboratories. Stringent regulatory approvals and reimbursement policies in various regions can also impact market growth. Furthermore, the market is subject to fluctuations influenced by economic conditions and healthcare spending patterns. Despite these restraints, the long-term outlook for the clinical laboratory analyzers market remains positive, driven by the aforementioned growth drivers and the increasing demand for accurate and timely diagnostic information. The market’s steady CAGR of 4.28% indicates sustained growth over the forecast period (2025-2033). This growth will likely be distributed across all segments and regions, albeit with varying degrees of intensity depending on factors such as healthcare infrastructure development and economic growth in each region.
Clinical Laboratory Analyzers Industry Market Report: 2019-2033
This comprehensive report provides an in-depth analysis of the Clinical Laboratory Analyzers market, encompassing its current state, future trajectory, and key players. The report covers the period from 2019 to 2033, with a base year of 2025 and a forecast period of 2025-2033. It segments the market by product type (Analyzers, Reagents, Others), type of test (Liver Panels, Electrolyte Panels, Thyroid Function Panels, Lipid Profiles, Others), and end-user (Hospital, Diagnostic Laboratories, Academic Institutes, Others). Key players analyzed include Elitech Group, Thermo Fisher Scientific Inc, Horiba Ltd, Siemens Healthcare Private Limited, F Hoffmann-La Roche Ltd, Abbott Laboratories, Mindray Medical International Limited, Johnson & Johnson, Sysmex Corporation, and Danaher Corporation (Beckman Coulter Inc). The report is designed for industry professionals, investors, and researchers seeking a thorough understanding of this dynamic market.
Clinical Laboratory Analyzers Industry Market Dynamics & Structure
The clinical laboratory analyzers market is characterized by a moderately concentrated structure, with a few major players holding significant market share. The market size in 2025 is estimated at xx Million units, exhibiting a competitive landscape shaped by technological innovation and stringent regulatory frameworks. Continuous technological advancements drive market growth, while regulatory compliance acts as a significant barrier to entry for new players. The market also faces pressure from substitute products and evolving end-user demographics. Mergers and acquisitions (M&A) activity has been significant in recent years, with xx M&A deals recorded in the historical period (2019-2024), indicating consolidation and expansion strategies among major players.
- Market Concentration: The top 5 players account for approximately xx% of the market share in 2025.
- Technological Innovation: Advancements in automation, miniaturization, and point-of-care diagnostics are key drivers.
- Regulatory Framework: Compliance with CLIA, FDA, and other international regulations is crucial.
- Competitive Substitutes: Alternative diagnostic techniques and home testing kits pose a potential threat.
- End-User Demographics: The increasing prevalence of chronic diseases and aging population fuel demand.
- M&A Trends: Consolidation through acquisitions is a dominant strategy among key players.
Clinical Laboratory Analyzers Industry Growth Trends & Insights
The clinical laboratory analyzers market has witnessed significant growth during the historical period (2019-2024), driven by factors such as increasing healthcare expenditure, technological advancements, and rising prevalence of chronic diseases. The market is expected to maintain a robust CAGR of xx% during the forecast period (2025-2033), reaching an estimated xx Million units by 2033. Adoption rates are increasing steadily, particularly in emerging economies. Technological disruptions, such as the integration of AI and big data analytics, are transforming the industry, leading to improved diagnostic accuracy and efficiency. Consumer behavior is shifting towards more convenient and accessible testing options, driving demand for point-of-care diagnostics. Market penetration is particularly high in developed regions, with significant growth potential remaining in developing countries.
Dominant Regions, Countries, or Segments in Clinical Laboratory Analyzers Industry
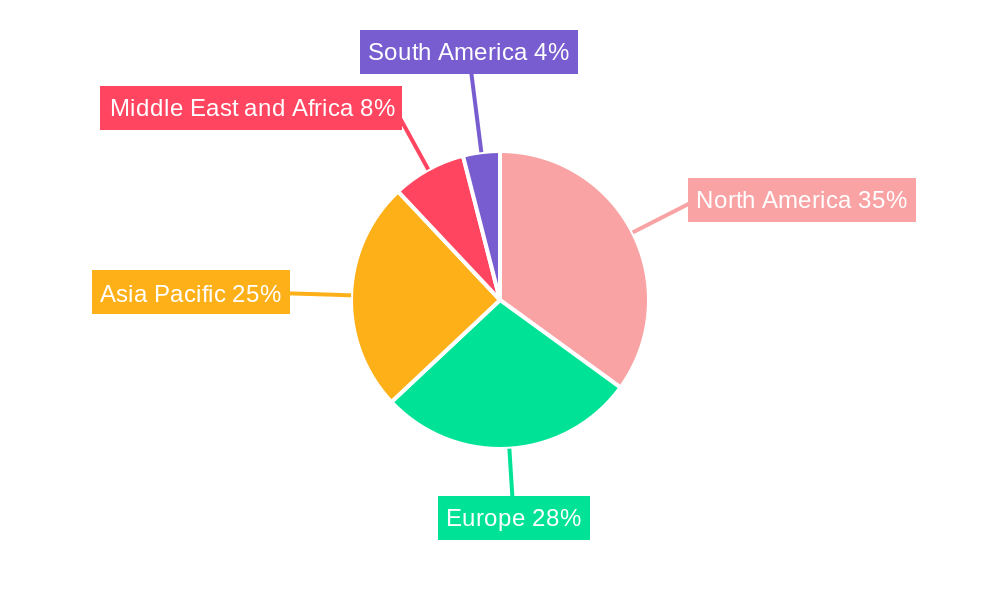
North America currently holds the largest market share, followed by Europe and Asia Pacific. The dominance of North America is attributed to high healthcare expenditure, advanced healthcare infrastructure, and a strong regulatory framework. However, the Asia Pacific region is projected to witness the fastest growth rate during the forecast period due to rapid economic development, increasing healthcare awareness, and rising prevalence of chronic diseases.
Dominant Segments:
- Product Type: Analyzers segment dominates, driven by technological advancements and increasing demand.
- Type of Test: Electrolyte panels and liver panels are high-growth segments due to their routine use in various diagnostic procedures.
- End-User: Hospitals remain the largest end-user segment, followed by diagnostic laboratories.
Key Drivers:
- High Prevalence of Chronic Diseases: Diabetes, cardiovascular diseases, and cancer are key drivers.
- Government Initiatives: Increased healthcare investments and supportive regulatory policies.
- Technological Advancements: Automation, miniaturization, and improved accuracy drive demand.
Clinical Laboratory Analyzers Industry Product Landscape
The clinical laboratory analyzers market offers a diverse range of products, from basic hematology analyzers to sophisticated automated chemistry systems. Recent innovations focus on improving speed, accuracy, and efficiency. Key features include automated sample processing, advanced data analysis capabilities, and connectivity to laboratory information systems (LIS). Many analyzers now incorporate advanced technologies such as AI for improved diagnostic accuracy and reduced human error. Unique selling propositions include ease of use, reduced operating costs, and compact design, catering to varied laboratory settings.
Key Drivers, Barriers & Challenges in Clinical Laboratory Analyzers Industry
Key Drivers:
- Rising prevalence of chronic diseases globally
- Increasing demand for rapid and accurate diagnostics
- Technological advancements leading to improved analyzer capabilities
- Growing investments in healthcare infrastructure in developing economies.
Challenges & Restraints:
- High initial investment costs associated with purchasing advanced analyzers
- Stringent regulatory requirements for product approval and market access
- Competition from established players and emergence of new entrants
- Supply chain disruptions impacting the availability of critical components.
Emerging Opportunities in Clinical Laboratory Analyzers Industry
- Point-of-care diagnostics: Expanding access to testing in remote areas and reducing turnaround times.
- Integration with telehealth platforms: Enhancing remote patient monitoring and diagnosis.
- Artificial intelligence (AI) and machine learning (ML): Improving diagnostic accuracy and efficiency.
- Development of novel diagnostic assays: Expanding testing capabilities for emerging diseases and conditions.
Growth Accelerators in the Clinical Laboratory Analyzers Industry
Long-term growth will be fueled by continuous technological innovation, strategic partnerships between analyzer manufacturers and reagent suppliers, and expansion into emerging markets. Strategic acquisitions and collaborations will play a pivotal role in accelerating market penetration and product development. Investment in research and development (R&D) will drive the creation of more sophisticated and user-friendly analyzers.
Key Players Shaping the Clinical Laboratory Analyzers Industry Market
- Elitech Group
- Thermo Fisher Scientific Inc
- Horiba Ltd
- Siemens Healthcare Private Limited
- F Hoffmann-La Roche Ltd
- Abbott Laboratories
- Mindray Medical International Limited
- Johnson & Johnson
- Sysmex Corporation
- Danaher Corporation (Beckman Coulter Inc)
Notable Milestones in Clinical Laboratory Analyzers Industry Sector
- May 2022: Mindray launched the BS-600M chemistry analyzer, enhancing productivity in medium-volume labs.
- April 2022: Sysmex Europe launched the XQ-320 automated hematology analyzer, improving usability and quality.
In-Depth Clinical Laboratory Analyzers Industry Market Outlook
The clinical laboratory analyzers market exhibits strong growth potential, driven by technological advancements and increasing healthcare needs. Future market expansion will be shaped by strategic partnerships, the adoption of advanced technologies, and penetration into underserved markets. Companies focused on innovation, regulatory compliance, and cost-effectiveness will be well-positioned for success in this dynamic and expanding sector.
Clinical Laboratory Analyzers Industry Segmentation
-
1. Product Type
- 1.1. Analyzers
- 1.2. Reagents
- 1.3. Others
-
2. Types of Test
- 2.1. Liver Panels
- 2.2. Electrolyte Panels
- 2.3. Thyroid Function Panels
- 2.4. Lipid Profiles
- 2.5. Others
-
3. End User
- 3.1. Hospital
- 3.2. Diagnostic Laboratories
- 3.3. Academic Institutes
- 3.4. Others
Clinical Laboratory Analyzers Industry Segmentation By Geography
-
1. North America
- 1.1. United States
- 1.2. Canada
- 1.3. Mexico
-
2. Europe
- 2.1. Germany
- 2.2. United Kingdom
- 2.3. France
- 2.4. Italy
- 2.5. Spain
- 2.6. Rest of Europe
-
3. Asia Pacific
- 3.1. China
- 3.2. Japan
- 3.3. India
- 3.4. Australia
- 3.5. South Korea
- 3.6. Rest of Asia Pacific
-
4. Middle East and Africa
- 4.1. GCC
- 4.2. South Africa
- 4.3. Rest of Middle East and Africa
-
5. South America
- 5.1. Brazil
- 5.2. Argentina
- 5.3. Rest of South America
Clinical Laboratory Analyzers Industry REPORT HIGHLIGHTS
| Aspects | Details |
|---|---|
| Study Period | 2019-2033 |
| Base Year | 2024 |
| Estimated Year | 2025 |
| Forecast Period | 2025-2033 |
| Historical Period | 2019-2024 |
| Growth Rate | CAGR of 4.28% from 2019-2033 |
| Segmentation |
|
Table of Contents
- 1. Introduction
- 1.1. Research Scope
- 1.2. Market Segmentation
- 1.3. Research Methodology
- 1.4. Definitions and Assumptions
- 2. Executive Summary
- 2.1. Introduction
- 3. Market Dynamics
- 3.1. Introduction
- 3.2. Market Drivers
- 3.2.1. Rising Geriatric Population and Increasing Prevalence of Chronic Diseases; Increasing Importance and Awareness of Point-of-care Testing; Rising Technological Advancements in Clinical Chemistry Analyzer
- 3.3. Market Restrains
- 3.3.1. Lack of Trained and Qualified Professionals; High Cost of Clinical Chemistry Analyzer Equipment
- 3.4. Market Trends
- 3.4.1. Analyzers in Product Type Segment are Expected to Witness Fastest Growth over the Forecast Period
- 4. Market Factor Analysis
- 4.1. Porters Five Forces
- 4.2. Supply/Value Chain
- 4.3. PESTEL analysis
- 4.4. Market Entropy
- 4.5. Patent/Trademark Analysis
- 5. Global Clinical Laboratory Analyzers Industry Analysis, Insights and Forecast, 2019-2031
- 5.1. Market Analysis, Insights and Forecast - by Product Type
- 5.1.1. Analyzers
- 5.1.2. Reagents
- 5.1.3. Others
- 5.2. Market Analysis, Insights and Forecast - by Types of Test
- 5.2.1. Liver Panels
- 5.2.2. Electrolyte Panels
- 5.2.3. Thyroid Function Panels
- 5.2.4. Lipid Profiles
- 5.2.5. Others
- 5.3. Market Analysis, Insights and Forecast - by End User
- 5.3.1. Hospital
- 5.3.2. Diagnostic Laboratories
- 5.3.3. Academic Institutes
- 5.3.4. Others
- 5.4. Market Analysis, Insights and Forecast - by Region
- 5.4.1. North America
- 5.4.2. Europe
- 5.4.3. Asia Pacific
- 5.4.4. Middle East and Africa
- 5.4.5. South America
- 5.1. Market Analysis, Insights and Forecast - by Product Type
- 6. North America Clinical Laboratory Analyzers Industry Analysis, Insights and Forecast, 2019-2031
- 6.1. Market Analysis, Insights and Forecast - by Product Type
- 6.1.1. Analyzers
- 6.1.2. Reagents
- 6.1.3. Others
- 6.2. Market Analysis, Insights and Forecast - by Types of Test
- 6.2.1. Liver Panels
- 6.2.2. Electrolyte Panels
- 6.2.3. Thyroid Function Panels
- 6.2.4. Lipid Profiles
- 6.2.5. Others
- 6.3. Market Analysis, Insights and Forecast - by End User
- 6.3.1. Hospital
- 6.3.2. Diagnostic Laboratories
- 6.3.3. Academic Institutes
- 6.3.4. Others
- 6.1. Market Analysis, Insights and Forecast - by Product Type
- 7. Europe Clinical Laboratory Analyzers Industry Analysis, Insights and Forecast, 2019-2031
- 7.1. Market Analysis, Insights and Forecast - by Product Type
- 7.1.1. Analyzers
- 7.1.2. Reagents
- 7.1.3. Others
- 7.2. Market Analysis, Insights and Forecast - by Types of Test
- 7.2.1. Liver Panels
- 7.2.2. Electrolyte Panels
- 7.2.3. Thyroid Function Panels
- 7.2.4. Lipid Profiles
- 7.2.5. Others
- 7.3. Market Analysis, Insights and Forecast - by End User
- 7.3.1. Hospital
- 7.3.2. Diagnostic Laboratories
- 7.3.3. Academic Institutes
- 7.3.4. Others
- 7.1. Market Analysis, Insights and Forecast - by Product Type
- 8. Asia Pacific Clinical Laboratory Analyzers Industry Analysis, Insights and Forecast, 2019-2031
- 8.1. Market Analysis, Insights and Forecast - by Product Type
- 8.1.1. Analyzers
- 8.1.2. Reagents
- 8.1.3. Others
- 8.2. Market Analysis, Insights and Forecast - by Types of Test
- 8.2.1. Liver Panels
- 8.2.2. Electrolyte Panels
- 8.2.3. Thyroid Function Panels
- 8.2.4. Lipid Profiles
- 8.2.5. Others
- 8.3. Market Analysis, Insights and Forecast - by End User
- 8.3.1. Hospital
- 8.3.2. Diagnostic Laboratories
- 8.3.3. Academic Institutes
- 8.3.4. Others
- 8.1. Market Analysis, Insights and Forecast - by Product Type
- 9. Middle East and Africa Clinical Laboratory Analyzers Industry Analysis, Insights and Forecast, 2019-2031
- 9.1. Market Analysis, Insights and Forecast - by Product Type
- 9.1.1. Analyzers
- 9.1.2. Reagents
- 9.1.3. Others
- 9.2. Market Analysis, Insights and Forecast - by Types of Test
- 9.2.1. Liver Panels
- 9.2.2. Electrolyte Panels
- 9.2.3. Thyroid Function Panels
- 9.2.4. Lipid Profiles
- 9.2.5. Others
- 9.3. Market Analysis, Insights and Forecast - by End User
- 9.3.1. Hospital
- 9.3.2. Diagnostic Laboratories
- 9.3.3. Academic Institutes
- 9.3.4. Others
- 9.1. Market Analysis, Insights and Forecast - by Product Type
- 10. South America Clinical Laboratory Analyzers Industry Analysis, Insights and Forecast, 2019-2031
- 10.1. Market Analysis, Insights and Forecast - by Product Type
- 10.1.1. Analyzers
- 10.1.2. Reagents
- 10.1.3. Others
- 10.2. Market Analysis, Insights and Forecast - by Types of Test
- 10.2.1. Liver Panels
- 10.2.2. Electrolyte Panels
- 10.2.3. Thyroid Function Panels
- 10.2.4. Lipid Profiles
- 10.2.5. Others
- 10.3. Market Analysis, Insights and Forecast - by End User
- 10.3.1. Hospital
- 10.3.2. Diagnostic Laboratories
- 10.3.3. Academic Institutes
- 10.3.4. Others
- 10.1. Market Analysis, Insights and Forecast - by Product Type
- 11. North America Clinical Laboratory Analyzers Industry Analysis, Insights and Forecast, 2019-2031
- 11.1. Market Analysis, Insights and Forecast - By Country/Sub-region
- 11.1.1 United States
- 11.1.2 Canada
- 11.1.3 Mexico
- 12. Europe Clinical Laboratory Analyzers Industry Analysis, Insights and Forecast, 2019-2031
- 12.1. Market Analysis, Insights and Forecast - By Country/Sub-region
- 12.1.1 Germany
- 12.1.2 United Kingdom
- 12.1.3 France
- 12.1.4 Italy
- 12.1.5 Spain
- 12.1.6 Rest of Europe
- 13. Asia Pacific Clinical Laboratory Analyzers Industry Analysis, Insights and Forecast, 2019-2031
- 13.1. Market Analysis, Insights and Forecast - By Country/Sub-region
- 13.1.1 China
- 13.1.2 Japan
- 13.1.3 India
- 13.1.4 Australia
- 13.1.5 South Korea
- 13.1.6 Rest of Asia Pacific
- 14. Middle East and Africa Clinical Laboratory Analyzers Industry Analysis, Insights and Forecast, 2019-2031
- 14.1. Market Analysis, Insights and Forecast - By Country/Sub-region
- 14.1.1 GCC
- 14.1.2 South Africa
- 14.1.3 Rest of Middle East and Africa
- 15. South America Clinical Laboratory Analyzers Industry Analysis, Insights and Forecast, 2019-2031
- 15.1. Market Analysis, Insights and Forecast - By Country/Sub-region
- 15.1.1 Brazil
- 15.1.2 Argentina
- 15.1.3 Rest of South America
- 16. Competitive Analysis
- 16.1. Global Market Share Analysis 2024
- 16.2. Company Profiles
- 16.2.1 Elitech Group
- 16.2.1.1. Overview
- 16.2.1.2. Products
- 16.2.1.3. SWOT Analysis
- 16.2.1.4. Recent Developments
- 16.2.1.5. Financials (Based on Availability)
- 16.2.2 Thermo Fisher Scientific Inc
- 16.2.2.1. Overview
- 16.2.2.2. Products
- 16.2.2.3. SWOT Analysis
- 16.2.2.4. Recent Developments
- 16.2.2.5. Financials (Based on Availability)
- 16.2.3 Horiba Ltd
- 16.2.3.1. Overview
- 16.2.3.2. Products
- 16.2.3.3. SWOT Analysis
- 16.2.3.4. Recent Developments
- 16.2.3.5. Financials (Based on Availability)
- 16.2.4 Siemens Healthcare Private Limited
- 16.2.4.1. Overview
- 16.2.4.2. Products
- 16.2.4.3. SWOT Analysis
- 16.2.4.4. Recent Developments
- 16.2.4.5. Financials (Based on Availability)
- 16.2.5 F Hoffmann-La Roche Ltd
- 16.2.5.1. Overview
- 16.2.5.2. Products
- 16.2.5.3. SWOT Analysis
- 16.2.5.4. Recent Developments
- 16.2.5.5. Financials (Based on Availability)
- 16.2.6 Abbott Laboratories
- 16.2.6.1. Overview
- 16.2.6.2. Products
- 16.2.6.3. SWOT Analysis
- 16.2.6.4. Recent Developments
- 16.2.6.5. Financials (Based on Availability)
- 16.2.7 Mindray Medical International Limited
- 16.2.7.1. Overview
- 16.2.7.2. Products
- 16.2.7.3. SWOT Analysis
- 16.2.7.4. Recent Developments
- 16.2.7.5. Financials (Based on Availability)
- 16.2.8 Johnson & Johnson
- 16.2.8.1. Overview
- 16.2.8.2. Products
- 16.2.8.3. SWOT Analysis
- 16.2.8.4. Recent Developments
- 16.2.8.5. Financials (Based on Availability)
- 16.2.9 Sysmex Corporation
- 16.2.9.1. Overview
- 16.2.9.2. Products
- 16.2.9.3. SWOT Analysis
- 16.2.9.4. Recent Developments
- 16.2.9.5. Financials (Based on Availability)
- 16.2.10 Danaher Corporation (Beckman Coulter Inc )
- 16.2.10.1. Overview
- 16.2.10.2. Products
- 16.2.10.3. SWOT Analysis
- 16.2.10.4. Recent Developments
- 16.2.10.5. Financials (Based on Availability)
- 16.2.1 Elitech Group
List of Figures
- Figure 1: Global Clinical Laboratory Analyzers Industry Revenue Breakdown (Million, %) by Region 2024 & 2032
- Figure 2: Global Clinical Laboratory Analyzers Industry Volume Breakdown (K Unit, %) by Region 2024 & 2032
- Figure 3: North America Clinical Laboratory Analyzers Industry Revenue (Million), by Country 2024 & 2032
- Figure 4: North America Clinical Laboratory Analyzers Industry Volume (K Unit), by Country 2024 & 2032
- Figure 5: North America Clinical Laboratory Analyzers Industry Revenue Share (%), by Country 2024 & 2032
- Figure 6: North America Clinical Laboratory Analyzers Industry Volume Share (%), by Country 2024 & 2032
- Figure 7: Europe Clinical Laboratory Analyzers Industry Revenue (Million), by Country 2024 & 2032
- Figure 8: Europe Clinical Laboratory Analyzers Industry Volume (K Unit), by Country 2024 & 2032
- Figure 9: Europe Clinical Laboratory Analyzers Industry Revenue Share (%), by Country 2024 & 2032
- Figure 10: Europe Clinical Laboratory Analyzers Industry Volume Share (%), by Country 2024 & 2032
- Figure 11: Asia Pacific Clinical Laboratory Analyzers Industry Revenue (Million), by Country 2024 & 2032
- Figure 12: Asia Pacific Clinical Laboratory Analyzers Industry Volume (K Unit), by Country 2024 & 2032
- Figure 13: Asia Pacific Clinical Laboratory Analyzers Industry Revenue Share (%), by Country 2024 & 2032
- Figure 14: Asia Pacific Clinical Laboratory Analyzers Industry Volume Share (%), by Country 2024 & 2032
- Figure 15: Middle East and Africa Clinical Laboratory Analyzers Industry Revenue (Million), by Country 2024 & 2032
- Figure 16: Middle East and Africa Clinical Laboratory Analyzers Industry Volume (K Unit), by Country 2024 & 2032
- Figure 17: Middle East and Africa Clinical Laboratory Analyzers Industry Revenue Share (%), by Country 2024 & 2032
- Figure 18: Middle East and Africa Clinical Laboratory Analyzers Industry Volume Share (%), by Country 2024 & 2032
- Figure 19: South America Clinical Laboratory Analyzers Industry Revenue (Million), by Country 2024 & 2032
- Figure 20: South America Clinical Laboratory Analyzers Industry Volume (K Unit), by Country 2024 & 2032
- Figure 21: South America Clinical Laboratory Analyzers Industry Revenue Share (%), by Country 2024 & 2032
- Figure 22: South America Clinical Laboratory Analyzers Industry Volume Share (%), by Country 2024 & 2032
- Figure 23: North America Clinical Laboratory Analyzers Industry Revenue (Million), by Product Type 2024 & 2032
- Figure 24: North America Clinical Laboratory Analyzers Industry Volume (K Unit), by Product Type 2024 & 2032
- Figure 25: North America Clinical Laboratory Analyzers Industry Revenue Share (%), by Product Type 2024 & 2032
- Figure 26: North America Clinical Laboratory Analyzers Industry Volume Share (%), by Product Type 2024 & 2032
- Figure 27: North America Clinical Laboratory Analyzers Industry Revenue (Million), by Types of Test 2024 & 2032
- Figure 28: North America Clinical Laboratory Analyzers Industry Volume (K Unit), by Types of Test 2024 & 2032
- Figure 29: North America Clinical Laboratory Analyzers Industry Revenue Share (%), by Types of Test 2024 & 2032
- Figure 30: North America Clinical Laboratory Analyzers Industry Volume Share (%), by Types of Test 2024 & 2032
- Figure 31: North America Clinical Laboratory Analyzers Industry Revenue (Million), by End User 2024 & 2032
- Figure 32: North America Clinical Laboratory Analyzers Industry Volume (K Unit), by End User 2024 & 2032
- Figure 33: North America Clinical Laboratory Analyzers Industry Revenue Share (%), by End User 2024 & 2032
- Figure 34: North America Clinical Laboratory Analyzers Industry Volume Share (%), by End User 2024 & 2032
- Figure 35: North America Clinical Laboratory Analyzers Industry Revenue (Million), by Country 2024 & 2032
- Figure 36: North America Clinical Laboratory Analyzers Industry Volume (K Unit), by Country 2024 & 2032
- Figure 37: North America Clinical Laboratory Analyzers Industry Revenue Share (%), by Country 2024 & 2032
- Figure 38: North America Clinical Laboratory Analyzers Industry Volume Share (%), by Country 2024 & 2032
- Figure 39: Europe Clinical Laboratory Analyzers Industry Revenue (Million), by Product Type 2024 & 2032
- Figure 40: Europe Clinical Laboratory Analyzers Industry Volume (K Unit), by Product Type 2024 & 2032
- Figure 41: Europe Clinical Laboratory Analyzers Industry Revenue Share (%), by Product Type 2024 & 2032
- Figure 42: Europe Clinical Laboratory Analyzers Industry Volume Share (%), by Product Type 2024 & 2032
- Figure 43: Europe Clinical Laboratory Analyzers Industry Revenue (Million), by Types of Test 2024 & 2032
- Figure 44: Europe Clinical Laboratory Analyzers Industry Volume (K Unit), by Types of Test 2024 & 2032
- Figure 45: Europe Clinical Laboratory Analyzers Industry Revenue Share (%), by Types of Test 2024 & 2032
- Figure 46: Europe Clinical Laboratory Analyzers Industry Volume Share (%), by Types of Test 2024 & 2032
- Figure 47: Europe Clinical Laboratory Analyzers Industry Revenue (Million), by End User 2024 & 2032
- Figure 48: Europe Clinical Laboratory Analyzers Industry Volume (K Unit), by End User 2024 & 2032
- Figure 49: Europe Clinical Laboratory Analyzers Industry Revenue Share (%), by End User 2024 & 2032
- Figure 50: Europe Clinical Laboratory Analyzers Industry Volume Share (%), by End User 2024 & 2032
- Figure 51: Europe Clinical Laboratory Analyzers Industry Revenue (Million), by Country 2024 & 2032
- Figure 52: Europe Clinical Laboratory Analyzers Industry Volume (K Unit), by Country 2024 & 2032
- Figure 53: Europe Clinical Laboratory Analyzers Industry Revenue Share (%), by Country 2024 & 2032
- Figure 54: Europe Clinical Laboratory Analyzers Industry Volume Share (%), by Country 2024 & 2032
- Figure 55: Asia Pacific Clinical Laboratory Analyzers Industry Revenue (Million), by Product Type 2024 & 2032
- Figure 56: Asia Pacific Clinical Laboratory Analyzers Industry Volume (K Unit), by Product Type 2024 & 2032
- Figure 57: Asia Pacific Clinical Laboratory Analyzers Industry Revenue Share (%), by Product Type 2024 & 2032
- Figure 58: Asia Pacific Clinical Laboratory Analyzers Industry Volume Share (%), by Product Type 2024 & 2032
- Figure 59: Asia Pacific Clinical Laboratory Analyzers Industry Revenue (Million), by Types of Test 2024 & 2032
- Figure 60: Asia Pacific Clinical Laboratory Analyzers Industry Volume (K Unit), by Types of Test 2024 & 2032
- Figure 61: Asia Pacific Clinical Laboratory Analyzers Industry Revenue Share (%), by Types of Test 2024 & 2032
- Figure 62: Asia Pacific Clinical Laboratory Analyzers Industry Volume Share (%), by Types of Test 2024 & 2032
- Figure 63: Asia Pacific Clinical Laboratory Analyzers Industry Revenue (Million), by End User 2024 & 2032
- Figure 64: Asia Pacific Clinical Laboratory Analyzers Industry Volume (K Unit), by End User 2024 & 2032
- Figure 65: Asia Pacific Clinical Laboratory Analyzers Industry Revenue Share (%), by End User 2024 & 2032
- Figure 66: Asia Pacific Clinical Laboratory Analyzers Industry Volume Share (%), by End User 2024 & 2032
- Figure 67: Asia Pacific Clinical Laboratory Analyzers Industry Revenue (Million), by Country 2024 & 2032
- Figure 68: Asia Pacific Clinical Laboratory Analyzers Industry Volume (K Unit), by Country 2024 & 2032
- Figure 69: Asia Pacific Clinical Laboratory Analyzers Industry Revenue Share (%), by Country 2024 & 2032
- Figure 70: Asia Pacific Clinical Laboratory Analyzers Industry Volume Share (%), by Country 2024 & 2032
- Figure 71: Middle East and Africa Clinical Laboratory Analyzers Industry Revenue (Million), by Product Type 2024 & 2032
- Figure 72: Middle East and Africa Clinical Laboratory Analyzers Industry Volume (K Unit), by Product Type 2024 & 2032
- Figure 73: Middle East and Africa Clinical Laboratory Analyzers Industry Revenue Share (%), by Product Type 2024 & 2032
- Figure 74: Middle East and Africa Clinical Laboratory Analyzers Industry Volume Share (%), by Product Type 2024 & 2032
- Figure 75: Middle East and Africa Clinical Laboratory Analyzers Industry Revenue (Million), by Types of Test 2024 & 2032
- Figure 76: Middle East and Africa Clinical Laboratory Analyzers Industry Volume (K Unit), by Types of Test 2024 & 2032
- Figure 77: Middle East and Africa Clinical Laboratory Analyzers Industry Revenue Share (%), by Types of Test 2024 & 2032
- Figure 78: Middle East and Africa Clinical Laboratory Analyzers Industry Volume Share (%), by Types of Test 2024 & 2032
- Figure 79: Middle East and Africa Clinical Laboratory Analyzers Industry Revenue (Million), by End User 2024 & 2032
- Figure 80: Middle East and Africa Clinical Laboratory Analyzers Industry Volume (K Unit), by End User 2024 & 2032
- Figure 81: Middle East and Africa Clinical Laboratory Analyzers Industry Revenue Share (%), by End User 2024 & 2032
- Figure 82: Middle East and Africa Clinical Laboratory Analyzers Industry Volume Share (%), by End User 2024 & 2032
- Figure 83: Middle East and Africa Clinical Laboratory Analyzers Industry Revenue (Million), by Country 2024 & 2032
- Figure 84: Middle East and Africa Clinical Laboratory Analyzers Industry Volume (K Unit), by Country 2024 & 2032
- Figure 85: Middle East and Africa Clinical Laboratory Analyzers Industry Revenue Share (%), by Country 2024 & 2032
- Figure 86: Middle East and Africa Clinical Laboratory Analyzers Industry Volume Share (%), by Country 2024 & 2032
- Figure 87: South America Clinical Laboratory Analyzers Industry Revenue (Million), by Product Type 2024 & 2032
- Figure 88: South America Clinical Laboratory Analyzers Industry Volume (K Unit), by Product Type 2024 & 2032
- Figure 89: South America Clinical Laboratory Analyzers Industry Revenue Share (%), by Product Type 2024 & 2032
- Figure 90: South America Clinical Laboratory Analyzers Industry Volume Share (%), by Product Type 2024 & 2032
- Figure 91: South America Clinical Laboratory Analyzers Industry Revenue (Million), by Types of Test 2024 & 2032
- Figure 92: South America Clinical Laboratory Analyzers Industry Volume (K Unit), by Types of Test 2024 & 2032
- Figure 93: South America Clinical Laboratory Analyzers Industry Revenue Share (%), by Types of Test 2024 & 2032
- Figure 94: South America Clinical Laboratory Analyzers Industry Volume Share (%), by Types of Test 2024 & 2032
- Figure 95: South America Clinical Laboratory Analyzers Industry Revenue (Million), by End User 2024 & 2032
- Figure 96: South America Clinical Laboratory Analyzers Industry Volume (K Unit), by End User 2024 & 2032
- Figure 97: South America Clinical Laboratory Analyzers Industry Revenue Share (%), by End User 2024 & 2032
- Figure 98: South America Clinical Laboratory Analyzers Industry Volume Share (%), by End User 2024 & 2032
- Figure 99: South America Clinical Laboratory Analyzers Industry Revenue (Million), by Country 2024 & 2032
- Figure 100: South America Clinical Laboratory Analyzers Industry Volume (K Unit), by Country 2024 & 2032
- Figure 101: South America Clinical Laboratory Analyzers Industry Revenue Share (%), by Country 2024 & 2032
- Figure 102: South America Clinical Laboratory Analyzers Industry Volume Share (%), by Country 2024 & 2032
List of Tables
- Table 1: Global Clinical Laboratory Analyzers Industry Revenue Million Forecast, by Region 2019 & 2032
- Table 2: Global Clinical Laboratory Analyzers Industry Volume K Unit Forecast, by Region 2019 & 2032
- Table 3: Global Clinical Laboratory Analyzers Industry Revenue Million Forecast, by Product Type 2019 & 2032
- Table 4: Global Clinical Laboratory Analyzers Industry Volume K Unit Forecast, by Product Type 2019 & 2032
- Table 5: Global Clinical Laboratory Analyzers Industry Revenue Million Forecast, by Types of Test 2019 & 2032
- Table 6: Global Clinical Laboratory Analyzers Industry Volume K Unit Forecast, by Types of Test 2019 & 2032
- Table 7: Global Clinical Laboratory Analyzers Industry Revenue Million Forecast, by End User 2019 & 2032
- Table 8: Global Clinical Laboratory Analyzers Industry Volume K Unit Forecast, by End User 2019 & 2032
- Table 9: Global Clinical Laboratory Analyzers Industry Revenue Million Forecast, by Region 2019 & 2032
- Table 10: Global Clinical Laboratory Analyzers Industry Volume K Unit Forecast, by Region 2019 & 2032
- Table 11: Global Clinical Laboratory Analyzers Industry Revenue Million Forecast, by Country 2019 & 2032
- Table 12: Global Clinical Laboratory Analyzers Industry Volume K Unit Forecast, by Country 2019 & 2032
- Table 13: United States Clinical Laboratory Analyzers Industry Revenue (Million) Forecast, by Application 2019 & 2032
- Table 14: United States Clinical Laboratory Analyzers Industry Volume (K Unit) Forecast, by Application 2019 & 2032
- Table 15: Canada Clinical Laboratory Analyzers Industry Revenue (Million) Forecast, by Application 2019 & 2032
- Table 16: Canada Clinical Laboratory Analyzers Industry Volume (K Unit) Forecast, by Application 2019 & 2032
- Table 17: Mexico Clinical Laboratory Analyzers Industry Revenue (Million) Forecast, by Application 2019 & 2032
- Table 18: Mexico Clinical Laboratory Analyzers Industry Volume (K Unit) Forecast, by Application 2019 & 2032
- Table 19: Global Clinical Laboratory Analyzers Industry Revenue Million Forecast, by Country 2019 & 2032
- Table 20: Global Clinical Laboratory Analyzers Industry Volume K Unit Forecast, by Country 2019 & 2032
- Table 21: Germany Clinical Laboratory Analyzers Industry Revenue (Million) Forecast, by Application 2019 & 2032
- Table 22: Germany Clinical Laboratory Analyzers Industry Volume (K Unit) Forecast, by Application 2019 & 2032
- Table 23: United Kingdom Clinical Laboratory Analyzers Industry Revenue (Million) Forecast, by Application 2019 & 2032
- Table 24: United Kingdom Clinical Laboratory Analyzers Industry Volume (K Unit) Forecast, by Application 2019 & 2032
- Table 25: France Clinical Laboratory Analyzers Industry Revenue (Million) Forecast, by Application 2019 & 2032
- Table 26: France Clinical Laboratory Analyzers Industry Volume (K Unit) Forecast, by Application 2019 & 2032
- Table 27: Italy Clinical Laboratory Analyzers Industry Revenue (Million) Forecast, by Application 2019 & 2032
- Table 28: Italy Clinical Laboratory Analyzers Industry Volume (K Unit) Forecast, by Application 2019 & 2032
- Table 29: Spain Clinical Laboratory Analyzers Industry Revenue (Million) Forecast, by Application 2019 & 2032
- Table 30: Spain Clinical Laboratory Analyzers Industry Volume (K Unit) Forecast, by Application 2019 & 2032
- Table 31: Rest of Europe Clinical Laboratory Analyzers Industry Revenue (Million) Forecast, by Application 2019 & 2032
- Table 32: Rest of Europe Clinical Laboratory Analyzers Industry Volume (K Unit) Forecast, by Application 2019 & 2032
- Table 33: Global Clinical Laboratory Analyzers Industry Revenue Million Forecast, by Country 2019 & 2032
- Table 34: Global Clinical Laboratory Analyzers Industry Volume K Unit Forecast, by Country 2019 & 2032
- Table 35: China Clinical Laboratory Analyzers Industry Revenue (Million) Forecast, by Application 2019 & 2032
- Table 36: China Clinical Laboratory Analyzers Industry Volume (K Unit) Forecast, by Application 2019 & 2032
- Table 37: Japan Clinical Laboratory Analyzers Industry Revenue (Million) Forecast, by Application 2019 & 2032
- Table 38: Japan Clinical Laboratory Analyzers Industry Volume (K Unit) Forecast, by Application 2019 & 2032
- Table 39: India Clinical Laboratory Analyzers Industry Revenue (Million) Forecast, by Application 2019 & 2032
- Table 40: India Clinical Laboratory Analyzers Industry Volume (K Unit) Forecast, by Application 2019 & 2032
- Table 41: Australia Clinical Laboratory Analyzers Industry Revenue (Million) Forecast, by Application 2019 & 2032
- Table 42: Australia Clinical Laboratory Analyzers Industry Volume (K Unit) Forecast, by Application 2019 & 2032
- Table 43: South Korea Clinical Laboratory Analyzers Industry Revenue (Million) Forecast, by Application 2019 & 2032
- Table 44: South Korea Clinical Laboratory Analyzers Industry Volume (K Unit) Forecast, by Application 2019 & 2032
- Table 45: Rest of Asia Pacific Clinical Laboratory Analyzers Industry Revenue (Million) Forecast, by Application 2019 & 2032
- Table 46: Rest of Asia Pacific Clinical Laboratory Analyzers Industry Volume (K Unit) Forecast, by Application 2019 & 2032
- Table 47: Global Clinical Laboratory Analyzers Industry Revenue Million Forecast, by Country 2019 & 2032
- Table 48: Global Clinical Laboratory Analyzers Industry Volume K Unit Forecast, by Country 2019 & 2032
- Table 49: GCC Clinical Laboratory Analyzers Industry Revenue (Million) Forecast, by Application 2019 & 2032
- Table 50: GCC Clinical Laboratory Analyzers Industry Volume (K Unit) Forecast, by Application 2019 & 2032
- Table 51: South Africa Clinical Laboratory Analyzers Industry Revenue (Million) Forecast, by Application 2019 & 2032
- Table 52: South Africa Clinical Laboratory Analyzers Industry Volume (K Unit) Forecast, by Application 2019 & 2032
- Table 53: Rest of Middle East and Africa Clinical Laboratory Analyzers Industry Revenue (Million) Forecast, by Application 2019 & 2032
- Table 54: Rest of Middle East and Africa Clinical Laboratory Analyzers Industry Volume (K Unit) Forecast, by Application 2019 & 2032
- Table 55: Global Clinical Laboratory Analyzers Industry Revenue Million Forecast, by Country 2019 & 2032
- Table 56: Global Clinical Laboratory Analyzers Industry Volume K Unit Forecast, by Country 2019 & 2032
- Table 57: Brazil Clinical Laboratory Analyzers Industry Revenue (Million) Forecast, by Application 2019 & 2032
- Table 58: Brazil Clinical Laboratory Analyzers Industry Volume (K Unit) Forecast, by Application 2019 & 2032
- Table 59: Argentina Clinical Laboratory Analyzers Industry Revenue (Million) Forecast, by Application 2019 & 2032
- Table 60: Argentina Clinical Laboratory Analyzers Industry Volume (K Unit) Forecast, by Application 2019 & 2032
- Table 61: Rest of South America Clinical Laboratory Analyzers Industry Revenue (Million) Forecast, by Application 2019 & 2032
- Table 62: Rest of South America Clinical Laboratory Analyzers Industry Volume (K Unit) Forecast, by Application 2019 & 2032
- Table 63: Global Clinical Laboratory Analyzers Industry Revenue Million Forecast, by Product Type 2019 & 2032
- Table 64: Global Clinical Laboratory Analyzers Industry Volume K Unit Forecast, by Product Type 2019 & 2032
- Table 65: Global Clinical Laboratory Analyzers Industry Revenue Million Forecast, by Types of Test 2019 & 2032
- Table 66: Global Clinical Laboratory Analyzers Industry Volume K Unit Forecast, by Types of Test 2019 & 2032
- Table 67: Global Clinical Laboratory Analyzers Industry Revenue Million Forecast, by End User 2019 & 2032
- Table 68: Global Clinical Laboratory Analyzers Industry Volume K Unit Forecast, by End User 2019 & 2032
- Table 69: Global Clinical Laboratory Analyzers Industry Revenue Million Forecast, by Country 2019 & 2032
- Table 70: Global Clinical Laboratory Analyzers Industry Volume K Unit Forecast, by Country 2019 & 2032
- Table 71: United States Clinical Laboratory Analyzers Industry Revenue (Million) Forecast, by Application 2019 & 2032
- Table 72: United States Clinical Laboratory Analyzers Industry Volume (K Unit) Forecast, by Application 2019 & 2032
- Table 73: Canada Clinical Laboratory Analyzers Industry Revenue (Million) Forecast, by Application 2019 & 2032
- Table 74: Canada Clinical Laboratory Analyzers Industry Volume (K Unit) Forecast, by Application 2019 & 2032
- Table 75: Mexico Clinical Laboratory Analyzers Industry Revenue (Million) Forecast, by Application 2019 & 2032
- Table 76: Mexico Clinical Laboratory Analyzers Industry Volume (K Unit) Forecast, by Application 2019 & 2032
- Table 77: Global Clinical Laboratory Analyzers Industry Revenue Million Forecast, by Product Type 2019 & 2032
- Table 78: Global Clinical Laboratory Analyzers Industry Volume K Unit Forecast, by Product Type 2019 & 2032
- Table 79: Global Clinical Laboratory Analyzers Industry Revenue Million Forecast, by Types of Test 2019 & 2032
- Table 80: Global Clinical Laboratory Analyzers Industry Volume K Unit Forecast, by Types of Test 2019 & 2032
- Table 81: Global Clinical Laboratory Analyzers Industry Revenue Million Forecast, by End User 2019 & 2032
- Table 82: Global Clinical Laboratory Analyzers Industry Volume K Unit Forecast, by End User 2019 & 2032
- Table 83: Global Clinical Laboratory Analyzers Industry Revenue Million Forecast, by Country 2019 & 2032
- Table 84: Global Clinical Laboratory Analyzers Industry Volume K Unit Forecast, by Country 2019 & 2032
- Table 85: Germany Clinical Laboratory Analyzers Industry Revenue (Million) Forecast, by Application 2019 & 2032
- Table 86: Germany Clinical Laboratory Analyzers Industry Volume (K Unit) Forecast, by Application 2019 & 2032
- Table 87: United Kingdom Clinical Laboratory Analyzers Industry Revenue (Million) Forecast, by Application 2019 & 2032
- Table 88: United Kingdom Clinical Laboratory Analyzers Industry Volume (K Unit) Forecast, by Application 2019 & 2032
- Table 89: France Clinical Laboratory Analyzers Industry Revenue (Million) Forecast, by Application 2019 & 2032
- Table 90: France Clinical Laboratory Analyzers Industry Volume (K Unit) Forecast, by Application 2019 & 2032
- Table 91: Italy Clinical Laboratory Analyzers Industry Revenue (Million) Forecast, by Application 2019 & 2032
- Table 92: Italy Clinical Laboratory Analyzers Industry Volume (K Unit) Forecast, by Application 2019 & 2032
- Table 93: Spain Clinical Laboratory Analyzers Industry Revenue (Million) Forecast, by Application 2019 & 2032
- Table 94: Spain Clinical Laboratory Analyzers Industry Volume (K Unit) Forecast, by Application 2019 & 2032
- Table 95: Rest of Europe Clinical Laboratory Analyzers Industry Revenue (Million) Forecast, by Application 2019 & 2032
- Table 96: Rest of Europe Clinical Laboratory Analyzers Industry Volume (K Unit) Forecast, by Application 2019 & 2032
- Table 97: Global Clinical Laboratory Analyzers Industry Revenue Million Forecast, by Product Type 2019 & 2032
- Table 98: Global Clinical Laboratory Analyzers Industry Volume K Unit Forecast, by Product Type 2019 & 2032
- Table 99: Global Clinical Laboratory Analyzers Industry Revenue Million Forecast, by Types of Test 2019 & 2032
- Table 100: Global Clinical Laboratory Analyzers Industry Volume K Unit Forecast, by Types of Test 2019 & 2032
- Table 101: Global Clinical Laboratory Analyzers Industry Revenue Million Forecast, by End User 2019 & 2032
- Table 102: Global Clinical Laboratory Analyzers Industry Volume K Unit Forecast, by End User 2019 & 2032
- Table 103: Global Clinical Laboratory Analyzers Industry Revenue Million Forecast, by Country 2019 & 2032
- Table 104: Global Clinical Laboratory Analyzers Industry Volume K Unit Forecast, by Country 2019 & 2032
- Table 105: China Clinical Laboratory Analyzers Industry Revenue (Million) Forecast, by Application 2019 & 2032
- Table 106: China Clinical Laboratory Analyzers Industry Volume (K Unit) Forecast, by Application 2019 & 2032
- Table 107: Japan Clinical Laboratory Analyzers Industry Revenue (Million) Forecast, by Application 2019 & 2032
- Table 108: Japan Clinical Laboratory Analyzers Industry Volume (K Unit) Forecast, by Application 2019 & 2032
- Table 109: India Clinical Laboratory Analyzers Industry Revenue (Million) Forecast, by Application 2019 & 2032
- Table 110: India Clinical Laboratory Analyzers Industry Volume (K Unit) Forecast, by Application 2019 & 2032
- Table 111: Australia Clinical Laboratory Analyzers Industry Revenue (Million) Forecast, by Application 2019 & 2032
- Table 112: Australia Clinical Laboratory Analyzers Industry Volume (K Unit) Forecast, by Application 2019 & 2032
- Table 113: South Korea Clinical Laboratory Analyzers Industry Revenue (Million) Forecast, by Application 2019 & 2032
- Table 114: South Korea Clinical Laboratory Analyzers Industry Volume (K Unit) Forecast, by Application 2019 & 2032
- Table 115: Rest of Asia Pacific Clinical Laboratory Analyzers Industry Revenue (Million) Forecast, by Application 2019 & 2032
- Table 116: Rest of Asia Pacific Clinical Laboratory Analyzers Industry Volume (K Unit) Forecast, by Application 2019 & 2032
- Table 117: Global Clinical Laboratory Analyzers Industry Revenue Million Forecast, by Product Type 2019 & 2032
- Table 118: Global Clinical Laboratory Analyzers Industry Volume K Unit Forecast, by Product Type 2019 & 2032
- Table 119: Global Clinical Laboratory Analyzers Industry Revenue Million Forecast, by Types of Test 2019 & 2032
- Table 120: Global Clinical Laboratory Analyzers Industry Volume K Unit Forecast, by Types of Test 2019 & 2032
- Table 121: Global Clinical Laboratory Analyzers Industry Revenue Million Forecast, by End User 2019 & 2032
- Table 122: Global Clinical Laboratory Analyzers Industry Volume K Unit Forecast, by End User 2019 & 2032
- Table 123: Global Clinical Laboratory Analyzers Industry Revenue Million Forecast, by Country 2019 & 2032
- Table 124: Global Clinical Laboratory Analyzers Industry Volume K Unit Forecast, by Country 2019 & 2032
- Table 125: GCC Clinical Laboratory Analyzers Industry Revenue (Million) Forecast, by Application 2019 & 2032
- Table 126: GCC Clinical Laboratory Analyzers Industry Volume (K Unit) Forecast, by Application 2019 & 2032
- Table 127: South Africa Clinical Laboratory Analyzers Industry Revenue (Million) Forecast, by Application 2019 & 2032
- Table 128: South Africa Clinical Laboratory Analyzers Industry Volume (K Unit) Forecast, by Application 2019 & 2032
- Table 129: Rest of Middle East and Africa Clinical Laboratory Analyzers Industry Revenue (Million) Forecast, by Application 2019 & 2032
- Table 130: Rest of Middle East and Africa Clinical Laboratory Analyzers Industry Volume (K Unit) Forecast, by Application 2019 & 2032
- Table 131: Global Clinical Laboratory Analyzers Industry Revenue Million Forecast, by Product Type 2019 & 2032
- Table 132: Global Clinical Laboratory Analyzers Industry Volume K Unit Forecast, by Product Type 2019 & 2032
- Table 133: Global Clinical Laboratory Analyzers Industry Revenue Million Forecast, by Types of Test 2019 & 2032
- Table 134: Global Clinical Laboratory Analyzers Industry Volume K Unit Forecast, by Types of Test 2019 & 2032
- Table 135: Global Clinical Laboratory Analyzers Industry Revenue Million Forecast, by End User 2019 & 2032
- Table 136: Global Clinical Laboratory Analyzers Industry Volume K Unit Forecast, by End User 2019 & 2032
- Table 137: Global Clinical Laboratory Analyzers Industry Revenue Million Forecast, by Country 2019 & 2032
- Table 138: Global Clinical Laboratory Analyzers Industry Volume K Unit Forecast, by Country 2019 & 2032
- Table 139: Brazil Clinical Laboratory Analyzers Industry Revenue (Million) Forecast, by Application 2019 & 2032
- Table 140: Brazil Clinical Laboratory Analyzers Industry Volume (K Unit) Forecast, by Application 2019 & 2032
- Table 141: Argentina Clinical Laboratory Analyzers Industry Revenue (Million) Forecast, by Application 2019 & 2032
- Table 142: Argentina Clinical Laboratory Analyzers Industry Volume (K Unit) Forecast, by Application 2019 & 2032
- Table 143: Rest of South America Clinical Laboratory Analyzers Industry Revenue (Million) Forecast, by Application 2019 & 2032
- Table 144: Rest of South America Clinical Laboratory Analyzers Industry Volume (K Unit) Forecast, by Application 2019 & 2032
Frequently Asked Questions
1. What is the projected Compound Annual Growth Rate (CAGR) of the Clinical Laboratory Analyzers Industry?
The projected CAGR is approximately 4.28%.
2. Which companies are prominent players in the Clinical Laboratory Analyzers Industry?
Key companies in the market include Elitech Group, Thermo Fisher Scientific Inc , Horiba Ltd, Siemens Healthcare Private Limited, F Hoffmann-La Roche Ltd, Abbott Laboratories, Mindray Medical International Limited, Johnson & Johnson, Sysmex Corporation, Danaher Corporation (Beckman Coulter Inc ).
3. What are the main segments of the Clinical Laboratory Analyzers Industry?
The market segments include Product Type, Types of Test, End User.
4. Can you provide details about the market size?
The market size is estimated to be USD 13.73 Million as of 2022.
5. What are some drivers contributing to market growth?
Rising Geriatric Population and Increasing Prevalence of Chronic Diseases; Increasing Importance and Awareness of Point-of-care Testing; Rising Technological Advancements in Clinical Chemistry Analyzer.
6. What are the notable trends driving market growth?
Analyzers in Product Type Segment are Expected to Witness Fastest Growth over the Forecast Period.
7. Are there any restraints impacting market growth?
Lack of Trained and Qualified Professionals; High Cost of Clinical Chemistry Analyzer Equipment.
8. Can you provide examples of recent developments in the market?
In May 2022, Mindray launched the BS-600M, a powerful, efficient chemistry analyzer that is designed to empower medium-volume laboratories with increased productivity, efficiency, and reliability.
9. What pricing options are available for accessing the report?
Pricing options include single-user, multi-user, and enterprise licenses priced at USD 4750, USD 5250, and USD 8750 respectively.
10. Is the market size provided in terms of value or volume?
The market size is provided in terms of value, measured in Million and volume, measured in K Unit.
11. Are there any specific market keywords associated with the report?
Yes, the market keyword associated with the report is "Clinical Laboratory Analyzers Industry," which aids in identifying and referencing the specific market segment covered.
12. How do I determine which pricing option suits my needs best?
The pricing options vary based on user requirements and access needs. Individual users may opt for single-user licenses, while businesses requiring broader access may choose multi-user or enterprise licenses for cost-effective access to the report.
13. Are there any additional resources or data provided in the Clinical Laboratory Analyzers Industry report?
While the report offers comprehensive insights, it's advisable to review the specific contents or supplementary materials provided to ascertain if additional resources or data are available.
14. How can I stay updated on further developments or reports in the Clinical Laboratory Analyzers Industry?
To stay informed about further developments, trends, and reports in the Clinical Laboratory Analyzers Industry, consider subscribing to industry newsletters, following relevant companies and organizations, or regularly checking reputable industry news sources and publications.
Methodology
Step 1 - Identification of Relevant Samples Size from Population Database


Step 2 - Approaches for Defining Global Market Size (Value, Volume* & Price*)

Note*: In applicable scenarios
Step 3 - Data Sources
Primary Research
- Web Analytics
- Survey Reports
- Research Institute
- Latest Research Reports
- Opinion Leaders
Secondary Research
- Annual Reports
- White Paper
- Latest Press Release
- Industry Association
- Paid Database
- Investor Presentations

Step 4 - Data Triangulation
Involves using different sources of information in order to increase the validity of a study
These sources are likely to be stakeholders in a program - participants, other researchers, program staff, other community members, and so on.
Then we put all data in single framework & apply various statistical tools to find out the dynamic on the market.
During the analysis stage, feedback from the stakeholder groups would be compared to determine areas of agreement as well as areas of divergence


