

Key Insights
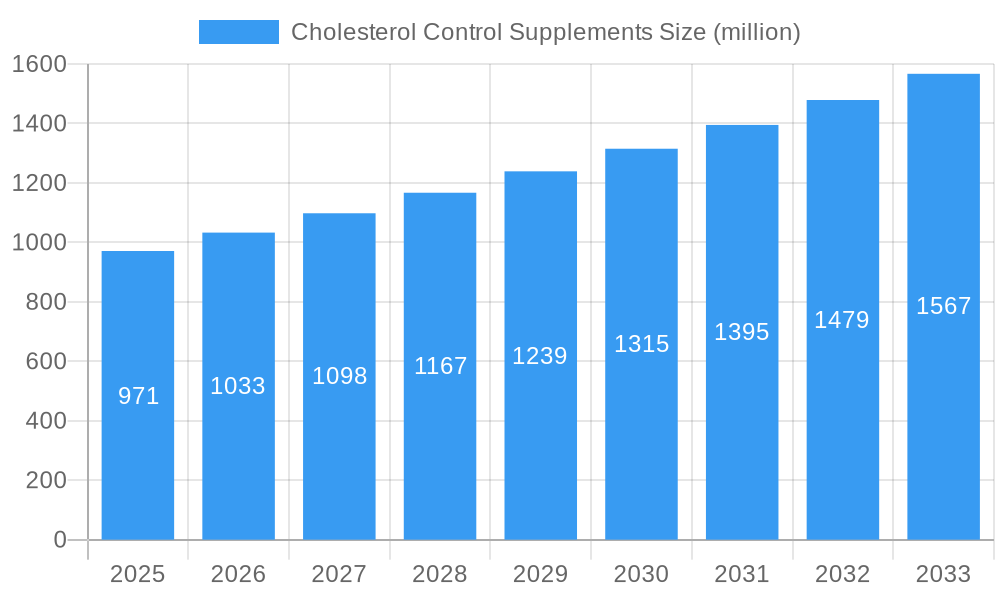
The global cholesterol control supplements market, valued at $971 million in 2025, is projected to experience robust growth, driven by rising prevalence of cardiovascular diseases, increasing health consciousness, and a growing preference for natural and herbal remedies. The market's 5.8% CAGR from 2019 to 2033 signifies a consistent demand for effective cholesterol management solutions. Key drivers include the escalating rates of hypercholesterolemia, particularly in developed nations, coupled with increased awareness of the long-term health risks associated with high cholesterol. The market is witnessing a surge in demand for supplements incorporating natural ingredients like plant sterols, fiber-rich compounds, and omega-3 fatty acids, reflecting a shift towards holistic wellness approaches. This trend is further supported by the increasing availability of customized and personalized supplement regimens tailored to individual health needs and risk profiles. However, regulatory hurdles, concerns regarding efficacy and safety of certain supplements, and the availability of alternative treatments (such as statins) pose challenges to market expansion. The competitive landscape is characterized by a mix of established players like Croda International and Cargill, alongside emerging companies focusing on innovative formulations and targeted marketing strategies. The market segmentation likely includes various product types (e.g., plant sterols, omega-3 fatty acids, fiber supplements), delivery forms (capsules, tablets, liquids), and distribution channels (online retailers, pharmacies, health food stores).
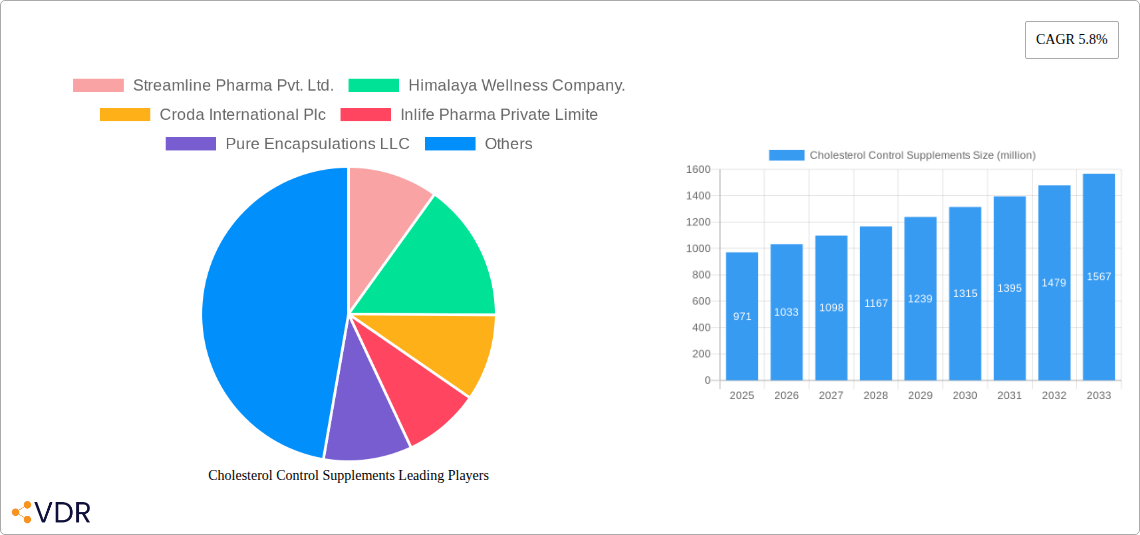
Cholesterol Control Supplements Market Size (In Million)
The forecast period (2025-2033) will likely witness increased market penetration driven by pharma companies expanding their portfolios into the natural supplement space and growing consumer interest in preventative healthcare. Further growth will be influenced by successful clinical trials supporting the efficacy of particular cholesterol-lowering supplements and advancements in personalized nutrition and supplement design. Strategic collaborations between supplement manufacturers and healthcare providers will also contribute to market expansion by integrating these products into comprehensive wellness programs. However, maintaining consistent quality control, overcoming consumer skepticism about the efficacy of certain supplements, and ensuring transparent and accurate labeling will remain crucial for long-term market growth and sustainability. Regional variations will likely exist, reflecting differences in healthcare infrastructure, lifestyle choices, and consumer preferences. Regions with high cardiovascular disease prevalence and strong healthcare systems are expected to lead market growth.
Cholesterol Control Supplements Company Market Share
Cholesterol Control Supplements Market Report: 2019-2033
This comprehensive report provides a detailed analysis of the Cholesterol Control Supplements market, encompassing market dynamics, growth trends, regional segmentation, product landscape, key players, and future outlook. The study period covers 2019-2033, with a focus on the base year 2025 and a forecast period of 2025-2033. The report is essential for industry professionals, investors, and stakeholders seeking a deep understanding of this rapidly evolving market. The parent market is Dietary Supplements, while the child market is Cardiovascular Health Supplements. The total market size is estimated to reach xx million units by 2033.
Cholesterol Control Supplements Market Dynamics & Structure
The Cholesterol Control Supplements market is characterized by moderate concentration, with several key players holding significant market share, but also featuring a number of smaller niche players. Technological innovation, particularly in the development of more effective and bioavailable formulations, is a major driver. Stringent regulatory frameworks, particularly concerning ingredient safety and efficacy claims, shape market dynamics. Competitive pressures from other cholesterol-lowering approaches, such as statins and lifestyle modifications, exist. The end-user demographic skews towards the older population (45+), with increasing awareness of cardiovascular health driving adoption. M&A activity in the sector is moderate, with larger companies occasionally acquiring smaller, specialized firms to expand their product portfolios.
- Market Concentration: Moderately concentrated, with the top 5 players holding approximately xx% of the market share in 2025.
- Technological Innovation: Focus on enhanced bioavailability, targeted delivery systems, and natural ingredient efficacy.
- Regulatory Framework: Stringent regulations regarding ingredient safety, labeling, and efficacy claims in regions like the US, EU, and Canada.
- Competitive Substitutes: Statins, lifestyle modifications (diet, exercise), and other cardiovascular health supplements.
- End-User Demographics: Primarily older adults (45+), with growing interest among younger, health-conscious individuals.
- M&A Trends: Moderate activity, with xx major deals recorded between 2019 and 2024.
Cholesterol Control Supplements Growth Trends & Insights
The Cholesterol Control Supplements market experienced significant growth between 2019 and 2024, driven by increasing awareness of cardiovascular disease and the growing preference for natural and holistic health solutions. This trend is projected to continue throughout the forecast period, with a Compound Annual Growth Rate (CAGR) of xx% from 2025 to 2033. The adoption rate of cholesterol control supplements is steadily increasing, particularly in developed economies with aging populations. Technological advancements, such as the development of novel delivery systems and functional food products, are further fueling market expansion. Consumer behavior is shifting towards preventative healthcare, increasing the demand for natural and effective cholesterol management solutions. Market penetration is expected to rise from xx% in 2025 to xx% in 2033.
Dominant Regions, Countries, or Segments in Cholesterol Control Supplements
North America currently holds the largest market share for Cholesterol Control Supplements, driven by high healthcare expenditure, strong regulatory frameworks, and a high prevalence of cardiovascular diseases. Europe follows closely, with similar drivers at play. However, Asia-Pacific is expected to exhibit the fastest growth rate throughout the forecast period, fueled by a rapidly expanding middle class, increasing health awareness, and rising disposable incomes. Within specific segments, supplements utilizing natural ingredients (like plant sterols and soluble fiber) are gaining significant traction.
- North America: High market share due to high healthcare expenditure and prevalence of cardiovascular diseases.
- Europe: Significant market presence, with similar drivers to North America.
- Asia-Pacific: Fastest-growing region, driven by rising disposable incomes and health awareness.
- Key Drivers: Increasing prevalence of cardiovascular disease, rising healthcare expenditure, and growing preference for natural health solutions.
Cholesterol Control Supplements Product Landscape
The Cholesterol Control Supplements market offers a diverse range of products, including capsules, tablets, powders, and liquids. Formulations frequently incorporate plant sterols, soluble fiber, omega-3 fatty acids, and other natural ingredients known for their cholesterol-lowering properties. Innovations focus on enhanced bioavailability, improved taste and palatability, and convenient delivery systems. Many products highlight unique selling propositions, such as organic certification, specific ingredient combinations, or clinical trial support for efficacy. Technological advancements involve utilizing liposomal encapsulation and other novel delivery systems to optimize absorption and efficacy.
Key Drivers, Barriers & Challenges in Cholesterol Control Supplements
Key Drivers: The rising prevalence of cardiovascular diseases globally is a primary driver. The growing consumer preference for natural health solutions and increased awareness of preventative healthcare further fuel market expansion. Technological advancements, resulting in improved formulations and delivery methods, contribute significantly.
Key Challenges: Stringent regulatory requirements regarding ingredient safety and efficacy claims present significant hurdles for market entrants. Competition from established pharmaceutical cholesterol-lowering drugs, such as statins, poses a considerable challenge. Ensuring consistent supply chain management and maintaining product quality are also crucial aspects. Approximately xx% of companies experienced supply chain disruptions in 2024, impacting product availability and profitability.
Emerging Opportunities in Cholesterol Control Supplements
Untapped markets in developing economies with rising disposable incomes and growing health awareness present substantial opportunities. The development of functional foods and beverages incorporating cholesterol-lowering ingredients offers significant potential. Personalized nutrition and tailored supplement formulations based on individual genetic profiles and health status represent an emerging opportunity. The growing demand for convenient and easy-to-consume supplements, such as ready-to-drink beverages and functional snacks, opens new avenues for market expansion.
Growth Accelerators in the Cholesterol Control Supplements Industry
Technological advancements in supplement formulation and delivery systems, such as liposomal encapsulation and targeted delivery, are accelerating growth. Strategic partnerships between supplement manufacturers and healthcare providers create new distribution channels and market access. Expansion into emerging markets and diversification of product offerings, including functional foods and beverages, are key strategies for accelerating growth. Furthermore, increasing collaborations with research institutions to support clinical trials and establish scientific evidence for product efficacy are expected to drive the market.
Key Players Shaping the Cholesterol Control Supplements Market
- Streamline Pharma Pvt. Ltd.
- Himalaya Wellness Company.
- Croda International Plc (Croda International Plc)
- Inlife Pharma Private Limite
- Pure Encapsulations LLC (Pure Encapsulations LLC)
- HERBAL CREATIONS
- ORGANIC INDIA Pvt. Ltd.
- ADM (ADM)
- Step One Foods
- TCI Co. Ltd.
- Cargill (Cargill)
Notable Milestones in Cholesterol Control Supplements Sector
- 2020: Launch of a new line of plant sterol-based supplements by Himalaya Wellness Company.
- 2021: Acquisition of a smaller supplement manufacturer by Croda International Plc, expanding its product portfolio.
- 2022: Publication of a major clinical trial supporting the efficacy of a novel cholesterol-lowering ingredient.
- 2023: Introduction of a new regulatory framework for dietary supplements in a major market.
- 2024: Several key players launched new product lines focusing on personalized nutrition.
In-Depth Cholesterol Control Supplements Market Outlook
The Cholesterol Control Supplements market is poised for continued robust growth, driven by the increasing prevalence of cardiovascular diseases, the growing preference for natural health solutions, and ongoing technological advancements. The market is expected to witness a surge in the adoption of innovative formulations and delivery systems, further accelerating growth. Strategic partnerships and market expansion into untapped regions are expected to play a significant role in shaping the future market landscape. Companies focused on product innovation, robust clinical evidence, and effective marketing strategies are best positioned to capitalize on the market's considerable potential.
Cholesterol Control Supplements Segmentation
-
1. Application
- 1.1. Pharmacies
- 1.2. Supermarkets/Hypermarkets
- 1.3. Online Retail
- 1.4. Others
-
2. Types
- 2.1. Plant-Based
- 2.2. Animal-Based
- 2.3. Synthetic
Cholesterol Control Supplements Segmentation By Geography
-
1. North America
- 1.1. United States
- 1.2. Canada
- 1.3. Mexico
-
2. South America
- 2.1. Brazil
- 2.2. Argentina
- 2.3. Rest of South America
-
3. Europe
- 3.1. United Kingdom
- 3.2. Germany
- 3.3. France
- 3.4. Italy
- 3.5. Spain
- 3.6. Russia
- 3.7. Benelux
- 3.8. Nordics
- 3.9. Rest of Europe
-
4. Middle East & Africa
- 4.1. Turkey
- 4.2. Israel
- 4.3. GCC
- 4.4. North Africa
- 4.5. South Africa
- 4.6. Rest of Middle East & Africa
-
5. Asia Pacific
- 5.1. China
- 5.2. India
- 5.3. Japan
- 5.4. South Korea
- 5.5. ASEAN
- 5.6. Oceania
- 5.7. Rest of Asia Pacific
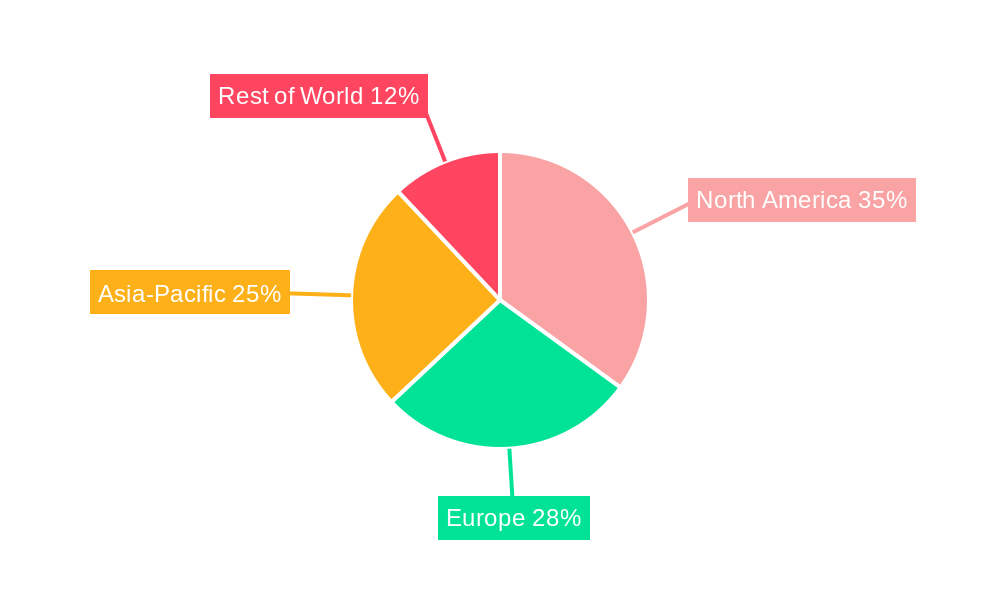
Cholesterol Control Supplements Regional Market Share
Geographic Coverage of Cholesterol Control Supplements
Cholesterol Control Supplements REPORT HIGHLIGHTS
| Aspects | Details |
|---|---|
| Study Period | 2020-2034 |
| Base Year | 2025 |
| Estimated Year | 2026 |
| Forecast Period | 2026-2034 |
| Historical Period | 2020-2025 |
| Growth Rate | CAGR of 5.8% from 2020-2034 |
| Segmentation |
|
Table of Contents
- 1. Introduction
- 1.1. Research Scope
- 1.2. Market Segmentation
- 1.3. Research Objective
- 1.4. Definitions and Assumptions
- 2. Executive Summary
- 2.1. Market Snapshot
- 3. Market Dynamics
- 3.1. Market Drivers
- 3.2. Market Restrains
- 3.3. Market Trends
- 3.4. Market Opportunities
- 4. Market Factor Analysis
- 4.1. Porters Five Forces
- 4.1.1. Bargaining Power of Suppliers
- 4.1.2. Bargaining Power of Buyers
- 4.1.3. Threat of New Entrants
- 4.1.4. Threat of Substitutes
- 4.1.5. Competitive Rivalry
- 4.2. PESTEL analysis
- 4.3. BCG Analysis
- 4.3.1. Stars (High Growth, High Market Share)
- 4.3.2. Cash Cows (Low Growth, High Market Share)
- 4.3.3. Question Mark (High Growth, Low Market Share)
- 4.3.4. Dogs (Low Growth, Low Market Share)
- 4.4. Ansoff Matrix Analysis
- 4.5. Supply Chain Analysis
- 4.6. Regulatory Landscape
- 4.7. Current Market Potential and Opportunity Assessment (TAM–SAM–SOM Framework)
- 4.8. VDR Analyst Note
- 4.1. Porters Five Forces
- 5. Market Analysis, Insights and Forecast 2021-2033
- 5.1. Market Analysis, Insights and Forecast - by Application
- 5.1.1. Pharmacies
- 5.1.2. Supermarkets/Hypermarkets
- 5.1.3. Online Retail
- 5.1.4. Others
- 5.2. Market Analysis, Insights and Forecast - by Types
- 5.2.1. Plant-Based
- 5.2.2. Animal-Based
- 5.2.3. Synthetic
- 5.3. Market Analysis, Insights and Forecast - by Region
- 5.3.1. North America
- 5.3.2. South America
- 5.3.3. Europe
- 5.3.4. Middle East & Africa
- 5.3.5. Asia Pacific
- 5.1. Market Analysis, Insights and Forecast - by Application
- 6. Global Cholesterol Control Supplements Analysis, Insights and Forecast, 2021-2033
- 6.1. Market Analysis, Insights and Forecast - by Application
- 6.1.1. Pharmacies
- 6.1.2. Supermarkets/Hypermarkets
- 6.1.3. Online Retail
- 6.1.4. Others
- 6.2. Market Analysis, Insights and Forecast - by Types
- 6.2.1. Plant-Based
- 6.2.2. Animal-Based
- 6.2.3. Synthetic
- 6.1. Market Analysis, Insights and Forecast - by Application
- 7. North America Cholesterol Control Supplements Analysis, Insights and Forecast, 2021-2033
- 7.1. Market Analysis, Insights and Forecast - by Application
- 7.1.1. Pharmacies
- 7.1.2. Supermarkets/Hypermarkets
- 7.1.3. Online Retail
- 7.1.4. Others
- 7.2. Market Analysis, Insights and Forecast - by Types
- 7.2.1. Plant-Based
- 7.2.2. Animal-Based
- 7.2.3. Synthetic
- 7.1. Market Analysis, Insights and Forecast - by Application
- 8. South America Cholesterol Control Supplements Analysis, Insights and Forecast, 2021-2033
- 8.1. Market Analysis, Insights and Forecast - by Application
- 8.1.1. Pharmacies
- 8.1.2. Supermarkets/Hypermarkets
- 8.1.3. Online Retail
- 8.1.4. Others
- 8.2. Market Analysis, Insights and Forecast - by Types
- 8.2.1. Plant-Based
- 8.2.2. Animal-Based
- 8.2.3. Synthetic
- 8.1. Market Analysis, Insights and Forecast - by Application
- 9. Europe Cholesterol Control Supplements Analysis, Insights and Forecast, 2021-2033
- 9.1. Market Analysis, Insights and Forecast - by Application
- 9.1.1. Pharmacies
- 9.1.2. Supermarkets/Hypermarkets
- 9.1.3. Online Retail
- 9.1.4. Others
- 9.2. Market Analysis, Insights and Forecast - by Types
- 9.2.1. Plant-Based
- 9.2.2. Animal-Based
- 9.2.3. Synthetic
- 9.1. Market Analysis, Insights and Forecast - by Application
- 10. Middle East & Africa Cholesterol Control Supplements Analysis, Insights and Forecast, 2021-2033
- 10.1. Market Analysis, Insights and Forecast - by Application
- 10.1.1. Pharmacies
- 10.1.2. Supermarkets/Hypermarkets
- 10.1.3. Online Retail
- 10.1.4. Others
- 10.2. Market Analysis, Insights and Forecast - by Types
- 10.2.1. Plant-Based
- 10.2.2. Animal-Based
- 10.2.3. Synthetic
- 10.1. Market Analysis, Insights and Forecast - by Application
- 11. Asia Pacific Cholesterol Control Supplements Analysis, Insights and Forecast, 2021-2033
- 11.1. Market Analysis, Insights and Forecast - by Application
- 11.1.1. Pharmacies
- 11.1.2. Supermarkets/Hypermarkets
- 11.1.3. Online Retail
- 11.1.4. Others
- 11.2. Market Analysis, Insights and Forecast - by Types
- 11.2.1. Plant-Based
- 11.2.2. Animal-Based
- 11.2.3. Synthetic
- 11.1. Market Analysis, Insights and Forecast - by Application
- 12. Competitive Analysis
- 12.1. Company Profiles
- 12.1.1 Streamline Pharma Pvt. Ltd.
- 12.1.1.1. Company Overview
- 12.1.1.2. Products
- 12.1.1.3. Company Financials
- 12.1.1.4. SWOT Analysis
- 12.1.2 Himalaya Wellness Company.
- 12.1.2.1. Company Overview
- 12.1.2.2. Products
- 12.1.2.3. Company Financials
- 12.1.2.4. SWOT Analysis
- 12.1.3 Croda International Plc
- 12.1.3.1. Company Overview
- 12.1.3.2. Products
- 12.1.3.3. Company Financials
- 12.1.3.4. SWOT Analysis
- 12.1.4 Inlife Pharma Private Limite
- 12.1.4.1. Company Overview
- 12.1.4.2. Products
- 12.1.4.3. Company Financials
- 12.1.4.4. SWOT Analysis
- 12.1.5 Pure Encapsulations LLC
- 12.1.5.1. Company Overview
- 12.1.5.2. Products
- 12.1.5.3. Company Financials
- 12.1.5.4. SWOT Analysis
- 12.1.6 HERBAL CREATIONS
- 12.1.6.1. Company Overview
- 12.1.6.2. Products
- 12.1.6.3. Company Financials
- 12.1.6.4. SWOT Analysis
- 12.1.7 ORGANIC INDIA Pvt. Ltd.
- 12.1.7.1. Company Overview
- 12.1.7.2. Products
- 12.1.7.3. Company Financials
- 12.1.7.4. SWOT Analysis
- 12.1.8 ADM
- 12.1.8.1. Company Overview
- 12.1.8.2. Products
- 12.1.8.3. Company Financials
- 12.1.8.4. SWOT Analysis
- 12.1.9 Step One Foods
- 12.1.9.1. Company Overview
- 12.1.9.2. Products
- 12.1.9.3. Company Financials
- 12.1.9.4. SWOT Analysis
- 12.1.10 TCI Co. Ltd.
- 12.1.10.1. Company Overview
- 12.1.10.2. Products
- 12.1.10.3. Company Financials
- 12.1.10.4. SWOT Analysis
- 12.1.11 Cargill
- 12.1.11.1. Company Overview
- 12.1.11.2. Products
- 12.1.11.3. Company Financials
- 12.1.11.4. SWOT Analysis
- 12.1.1 Streamline Pharma Pvt. Ltd.
- 12.2. Market Entropy
- 12.2.1 Company's Key Areas Served
- 12.2.2 Recent Developments
- 12.3. Company Market Share Analysis 2025
- 12.3.1 Top 5 Companies Market Share Analysis
- 12.3.2 Top 3 Companies Market Share Analysis
- 12.4. List of Potential Customers
- 13. Research Methodology
List of Figures
- Figure 1: Global Cholesterol Control Supplements Revenue Breakdown (million, %) by Region 2025 & 2033
- Figure 2: Global Cholesterol Control Supplements Volume Breakdown (K, %) by Region 2025 & 2033
- Figure 3: North America Cholesterol Control Supplements Revenue (million), by Application 2025 & 2033
- Figure 4: North America Cholesterol Control Supplements Volume (K), by Application 2025 & 2033
- Figure 5: North America Cholesterol Control Supplements Revenue Share (%), by Application 2025 & 2033
- Figure 6: North America Cholesterol Control Supplements Volume Share (%), by Application 2025 & 2033
- Figure 7: North America Cholesterol Control Supplements Revenue (million), by Types 2025 & 2033
- Figure 8: North America Cholesterol Control Supplements Volume (K), by Types 2025 & 2033
- Figure 9: North America Cholesterol Control Supplements Revenue Share (%), by Types 2025 & 2033
- Figure 10: North America Cholesterol Control Supplements Volume Share (%), by Types 2025 & 2033
- Figure 11: North America Cholesterol Control Supplements Revenue (million), by Country 2025 & 2033
- Figure 12: North America Cholesterol Control Supplements Volume (K), by Country 2025 & 2033
- Figure 13: North America Cholesterol Control Supplements Revenue Share (%), by Country 2025 & 2033
- Figure 14: North America Cholesterol Control Supplements Volume Share (%), by Country 2025 & 2033
- Figure 15: South America Cholesterol Control Supplements Revenue (million), by Application 2025 & 2033
- Figure 16: South America Cholesterol Control Supplements Volume (K), by Application 2025 & 2033
- Figure 17: South America Cholesterol Control Supplements Revenue Share (%), by Application 2025 & 2033
- Figure 18: South America Cholesterol Control Supplements Volume Share (%), by Application 2025 & 2033
- Figure 19: South America Cholesterol Control Supplements Revenue (million), by Types 2025 & 2033
- Figure 20: South America Cholesterol Control Supplements Volume (K), by Types 2025 & 2033
- Figure 21: South America Cholesterol Control Supplements Revenue Share (%), by Types 2025 & 2033
- Figure 22: South America Cholesterol Control Supplements Volume Share (%), by Types 2025 & 2033
- Figure 23: South America Cholesterol Control Supplements Revenue (million), by Country 2025 & 2033
- Figure 24: South America Cholesterol Control Supplements Volume (K), by Country 2025 & 2033
- Figure 25: South America Cholesterol Control Supplements Revenue Share (%), by Country 2025 & 2033
- Figure 26: South America Cholesterol Control Supplements Volume Share (%), by Country 2025 & 2033
- Figure 27: Europe Cholesterol Control Supplements Revenue (million), by Application 2025 & 2033
- Figure 28: Europe Cholesterol Control Supplements Volume (K), by Application 2025 & 2033
- Figure 29: Europe Cholesterol Control Supplements Revenue Share (%), by Application 2025 & 2033
- Figure 30: Europe Cholesterol Control Supplements Volume Share (%), by Application 2025 & 2033
- Figure 31: Europe Cholesterol Control Supplements Revenue (million), by Types 2025 & 2033
- Figure 32: Europe Cholesterol Control Supplements Volume (K), by Types 2025 & 2033
- Figure 33: Europe Cholesterol Control Supplements Revenue Share (%), by Types 2025 & 2033
- Figure 34: Europe Cholesterol Control Supplements Volume Share (%), by Types 2025 & 2033
- Figure 35: Europe Cholesterol Control Supplements Revenue (million), by Country 2025 & 2033
- Figure 36: Europe Cholesterol Control Supplements Volume (K), by Country 2025 & 2033
- Figure 37: Europe Cholesterol Control Supplements Revenue Share (%), by Country 2025 & 2033
- Figure 38: Europe Cholesterol Control Supplements Volume Share (%), by Country 2025 & 2033
- Figure 39: Middle East & Africa Cholesterol Control Supplements Revenue (million), by Application 2025 & 2033
- Figure 40: Middle East & Africa Cholesterol Control Supplements Volume (K), by Application 2025 & 2033
- Figure 41: Middle East & Africa Cholesterol Control Supplements Revenue Share (%), by Application 2025 & 2033
- Figure 42: Middle East & Africa Cholesterol Control Supplements Volume Share (%), by Application 2025 & 2033
- Figure 43: Middle East & Africa Cholesterol Control Supplements Revenue (million), by Types 2025 & 2033
- Figure 44: Middle East & Africa Cholesterol Control Supplements Volume (K), by Types 2025 & 2033
- Figure 45: Middle East & Africa Cholesterol Control Supplements Revenue Share (%), by Types 2025 & 2033
- Figure 46: Middle East & Africa Cholesterol Control Supplements Volume Share (%), by Types 2025 & 2033
- Figure 47: Middle East & Africa Cholesterol Control Supplements Revenue (million), by Country 2025 & 2033
- Figure 48: Middle East & Africa Cholesterol Control Supplements Volume (K), by Country 2025 & 2033
- Figure 49: Middle East & Africa Cholesterol Control Supplements Revenue Share (%), by Country 2025 & 2033
- Figure 50: Middle East & Africa Cholesterol Control Supplements Volume Share (%), by Country 2025 & 2033
- Figure 51: Asia Pacific Cholesterol Control Supplements Revenue (million), by Application 2025 & 2033
- Figure 52: Asia Pacific Cholesterol Control Supplements Volume (K), by Application 2025 & 2033
- Figure 53: Asia Pacific Cholesterol Control Supplements Revenue Share (%), by Application 2025 & 2033
- Figure 54: Asia Pacific Cholesterol Control Supplements Volume Share (%), by Application 2025 & 2033
- Figure 55: Asia Pacific Cholesterol Control Supplements Revenue (million), by Types 2025 & 2033
- Figure 56: Asia Pacific Cholesterol Control Supplements Volume (K), by Types 2025 & 2033
- Figure 57: Asia Pacific Cholesterol Control Supplements Revenue Share (%), by Types 2025 & 2033
- Figure 58: Asia Pacific Cholesterol Control Supplements Volume Share (%), by Types 2025 & 2033
- Figure 59: Asia Pacific Cholesterol Control Supplements Revenue (million), by Country 2025 & 2033
- Figure 60: Asia Pacific Cholesterol Control Supplements Volume (K), by Country 2025 & 2033
- Figure 61: Asia Pacific Cholesterol Control Supplements Revenue Share (%), by Country 2025 & 2033
- Figure 62: Asia Pacific Cholesterol Control Supplements Volume Share (%), by Country 2025 & 2033
List of Tables
- Table 1: Global Cholesterol Control Supplements Revenue million Forecast, by Application 2020 & 2033
- Table 2: Global Cholesterol Control Supplements Volume K Forecast, by Application 2020 & 2033
- Table 3: Global Cholesterol Control Supplements Revenue million Forecast, by Types 2020 & 2033
- Table 4: Global Cholesterol Control Supplements Volume K Forecast, by Types 2020 & 2033
- Table 5: Global Cholesterol Control Supplements Revenue million Forecast, by Region 2020 & 2033
- Table 6: Global Cholesterol Control Supplements Volume K Forecast, by Region 2020 & 2033
- Table 7: Global Cholesterol Control Supplements Revenue million Forecast, by Application 2020 & 2033
- Table 8: Global Cholesterol Control Supplements Volume K Forecast, by Application 2020 & 2033
- Table 9: Global Cholesterol Control Supplements Revenue million Forecast, by Types 2020 & 2033
- Table 10: Global Cholesterol Control Supplements Volume K Forecast, by Types 2020 & 2033
- Table 11: Global Cholesterol Control Supplements Revenue million Forecast, by Country 2020 & 2033
- Table 12: Global Cholesterol Control Supplements Volume K Forecast, by Country 2020 & 2033
- Table 13: United States Cholesterol Control Supplements Revenue (million) Forecast, by Application 2020 & 2033
- Table 14: United States Cholesterol Control Supplements Volume (K) Forecast, by Application 2020 & 2033
- Table 15: Canada Cholesterol Control Supplements Revenue (million) Forecast, by Application 2020 & 2033
- Table 16: Canada Cholesterol Control Supplements Volume (K) Forecast, by Application 2020 & 2033
- Table 17: Mexico Cholesterol Control Supplements Revenue (million) Forecast, by Application 2020 & 2033
- Table 18: Mexico Cholesterol Control Supplements Volume (K) Forecast, by Application 2020 & 2033
- Table 19: Global Cholesterol Control Supplements Revenue million Forecast, by Application 2020 & 2033
- Table 20: Global Cholesterol Control Supplements Volume K Forecast, by Application 2020 & 2033
- Table 21: Global Cholesterol Control Supplements Revenue million Forecast, by Types 2020 & 2033
- Table 22: Global Cholesterol Control Supplements Volume K Forecast, by Types 2020 & 2033
- Table 23: Global Cholesterol Control Supplements Revenue million Forecast, by Country 2020 & 2033
- Table 24: Global Cholesterol Control Supplements Volume K Forecast, by Country 2020 & 2033
- Table 25: Brazil Cholesterol Control Supplements Revenue (million) Forecast, by Application 2020 & 2033
- Table 26: Brazil Cholesterol Control Supplements Volume (K) Forecast, by Application 2020 & 2033
- Table 27: Argentina Cholesterol Control Supplements Revenue (million) Forecast, by Application 2020 & 2033
- Table 28: Argentina Cholesterol Control Supplements Volume (K) Forecast, by Application 2020 & 2033
- Table 29: Rest of South America Cholesterol Control Supplements Revenue (million) Forecast, by Application 2020 & 2033
- Table 30: Rest of South America Cholesterol Control Supplements Volume (K) Forecast, by Application 2020 & 2033
- Table 31: Global Cholesterol Control Supplements Revenue million Forecast, by Application 2020 & 2033
- Table 32: Global Cholesterol Control Supplements Volume K Forecast, by Application 2020 & 2033
- Table 33: Global Cholesterol Control Supplements Revenue million Forecast, by Types 2020 & 2033
- Table 34: Global Cholesterol Control Supplements Volume K Forecast, by Types 2020 & 2033
- Table 35: Global Cholesterol Control Supplements Revenue million Forecast, by Country 2020 & 2033
- Table 36: Global Cholesterol Control Supplements Volume K Forecast, by Country 2020 & 2033
- Table 37: United Kingdom Cholesterol Control Supplements Revenue (million) Forecast, by Application 2020 & 2033
- Table 38: United Kingdom Cholesterol Control Supplements Volume (K) Forecast, by Application 2020 & 2033
- Table 39: Germany Cholesterol Control Supplements Revenue (million) Forecast, by Application 2020 & 2033
- Table 40: Germany Cholesterol Control Supplements Volume (K) Forecast, by Application 2020 & 2033
- Table 41: France Cholesterol Control Supplements Revenue (million) Forecast, by Application 2020 & 2033
- Table 42: France Cholesterol Control Supplements Volume (K) Forecast, by Application 2020 & 2033
- Table 43: Italy Cholesterol Control Supplements Revenue (million) Forecast, by Application 2020 & 2033
- Table 44: Italy Cholesterol Control Supplements Volume (K) Forecast, by Application 2020 & 2033
- Table 45: Spain Cholesterol Control Supplements Revenue (million) Forecast, by Application 2020 & 2033
- Table 46: Spain Cholesterol Control Supplements Volume (K) Forecast, by Application 2020 & 2033
- Table 47: Russia Cholesterol Control Supplements Revenue (million) Forecast, by Application 2020 & 2033
- Table 48: Russia Cholesterol Control Supplements Volume (K) Forecast, by Application 2020 & 2033
- Table 49: Benelux Cholesterol Control Supplements Revenue (million) Forecast, by Application 2020 & 2033
- Table 50: Benelux Cholesterol Control Supplements Volume (K) Forecast, by Application 2020 & 2033
- Table 51: Nordics Cholesterol Control Supplements Revenue (million) Forecast, by Application 2020 & 2033
- Table 52: Nordics Cholesterol Control Supplements Volume (K) Forecast, by Application 2020 & 2033
- Table 53: Rest of Europe Cholesterol Control Supplements Revenue (million) Forecast, by Application 2020 & 2033
- Table 54: Rest of Europe Cholesterol Control Supplements Volume (K) Forecast, by Application 2020 & 2033
- Table 55: Global Cholesterol Control Supplements Revenue million Forecast, by Application 2020 & 2033
- Table 56: Global Cholesterol Control Supplements Volume K Forecast, by Application 2020 & 2033
- Table 57: Global Cholesterol Control Supplements Revenue million Forecast, by Types 2020 & 2033
- Table 58: Global Cholesterol Control Supplements Volume K Forecast, by Types 2020 & 2033
- Table 59: Global Cholesterol Control Supplements Revenue million Forecast, by Country 2020 & 2033
- Table 60: Global Cholesterol Control Supplements Volume K Forecast, by Country 2020 & 2033
- Table 61: Turkey Cholesterol Control Supplements Revenue (million) Forecast, by Application 2020 & 2033
- Table 62: Turkey Cholesterol Control Supplements Volume (K) Forecast, by Application 2020 & 2033
- Table 63: Israel Cholesterol Control Supplements Revenue (million) Forecast, by Application 2020 & 2033
- Table 64: Israel Cholesterol Control Supplements Volume (K) Forecast, by Application 2020 & 2033
- Table 65: GCC Cholesterol Control Supplements Revenue (million) Forecast, by Application 2020 & 2033
- Table 66: GCC Cholesterol Control Supplements Volume (K) Forecast, by Application 2020 & 2033
- Table 67: North Africa Cholesterol Control Supplements Revenue (million) Forecast, by Application 2020 & 2033
- Table 68: North Africa Cholesterol Control Supplements Volume (K) Forecast, by Application 2020 & 2033
- Table 69: South Africa Cholesterol Control Supplements Revenue (million) Forecast, by Application 2020 & 2033
- Table 70: South Africa Cholesterol Control Supplements Volume (K) Forecast, by Application 2020 & 2033
- Table 71: Rest of Middle East & Africa Cholesterol Control Supplements Revenue (million) Forecast, by Application 2020 & 2033
- Table 72: Rest of Middle East & Africa Cholesterol Control Supplements Volume (K) Forecast, by Application 2020 & 2033
- Table 73: Global Cholesterol Control Supplements Revenue million Forecast, by Application 2020 & 2033
- Table 74: Global Cholesterol Control Supplements Volume K Forecast, by Application 2020 & 2033
- Table 75: Global Cholesterol Control Supplements Revenue million Forecast, by Types 2020 & 2033
- Table 76: Global Cholesterol Control Supplements Volume K Forecast, by Types 2020 & 2033
- Table 77: Global Cholesterol Control Supplements Revenue million Forecast, by Country 2020 & 2033
- Table 78: Global Cholesterol Control Supplements Volume K Forecast, by Country 2020 & 2033
- Table 79: China Cholesterol Control Supplements Revenue (million) Forecast, by Application 2020 & 2033
- Table 80: China Cholesterol Control Supplements Volume (K) Forecast, by Application 2020 & 2033
- Table 81: India Cholesterol Control Supplements Revenue (million) Forecast, by Application 2020 & 2033
- Table 82: India Cholesterol Control Supplements Volume (K) Forecast, by Application 2020 & 2033
- Table 83: Japan Cholesterol Control Supplements Revenue (million) Forecast, by Application 2020 & 2033
- Table 84: Japan Cholesterol Control Supplements Volume (K) Forecast, by Application 2020 & 2033
- Table 85: South Korea Cholesterol Control Supplements Revenue (million) Forecast, by Application 2020 & 2033
- Table 86: South Korea Cholesterol Control Supplements Volume (K) Forecast, by Application 2020 & 2033
- Table 87: ASEAN Cholesterol Control Supplements Revenue (million) Forecast, by Application 2020 & 2033
- Table 88: ASEAN Cholesterol Control Supplements Volume (K) Forecast, by Application 2020 & 2033
- Table 89: Oceania Cholesterol Control Supplements Revenue (million) Forecast, by Application 2020 & 2033
- Table 90: Oceania Cholesterol Control Supplements Volume (K) Forecast, by Application 2020 & 2033
- Table 91: Rest of Asia Pacific Cholesterol Control Supplements Revenue (million) Forecast, by Application 2020 & 2033
- Table 92: Rest of Asia Pacific Cholesterol Control Supplements Volume (K) Forecast, by Application 2020 & 2033
Frequently Asked Questions
1. What is the projected Compound Annual Growth Rate (CAGR) of the Cholesterol Control Supplements?
The projected CAGR is approximately 5.8%.
2. Which companies are prominent players in the Cholesterol Control Supplements?
Key companies in the market include Streamline Pharma Pvt. Ltd., Himalaya Wellness Company., Croda International Plc, Inlife Pharma Private Limite, Pure Encapsulations LLC, HERBAL CREATIONS, ORGANIC INDIA Pvt. Ltd., ADM, Step One Foods, TCI Co. Ltd., Cargill.
3. What are the main segments of the Cholesterol Control Supplements?
The market segments include Application, Types.
4. Can you provide details about the market size?
The market size is estimated to be USD 971 million as of 2022.
5. What are some drivers contributing to market growth?
N/A
6. What are the notable trends driving market growth?
N/A
7. Are there any restraints impacting market growth?
N/A
8. Can you provide examples of recent developments in the market?
N/A
9. What pricing options are available for accessing the report?
Pricing options include single-user, multi-user, and enterprise licenses priced at USD 4350.00, USD 6525.00, and USD 8700.00 respectively.
10. Is the market size provided in terms of value or volume?
The market size is provided in terms of value, measured in million and volume, measured in K.
11. Are there any specific market keywords associated with the report?
Yes, the market keyword associated with the report is "Cholesterol Control Supplements," which aids in identifying and referencing the specific market segment covered.
12. How do I determine which pricing option suits my needs best?
The pricing options vary based on user requirements and access needs. Individual users may opt for single-user licenses, while businesses requiring broader access may choose multi-user or enterprise licenses for cost-effective access to the report.
13. Are there any additional resources or data provided in the Cholesterol Control Supplements report?
While the report offers comprehensive insights, it's advisable to review the specific contents or supplementary materials provided to ascertain if additional resources or data are available.
14. How can I stay updated on further developments or reports in the Cholesterol Control Supplements?
To stay informed about further developments, trends, and reports in the Cholesterol Control Supplements, consider subscribing to industry newsletters, following relevant companies and organizations, or regularly checking reputable industry news sources and publications.
Methodology
Step 1 - Identification of Relevant Samples Size from Population Database


Step 2 - Approaches for Defining Global Market Size (Value, Volume* & Price*)

Note*: In applicable scenarios
Step 3 - Data Sources
Primary Research
- Web Analytics
- Survey Reports
- Research Institute
- Latest Research Reports
- Opinion Leaders
Secondary Research
- Annual Reports
- White Paper
- Latest Press Release
- Industry Association
- Paid Database
- Investor Presentations

Step 4 - Data Triangulation
Involves using different sources of information in order to increase the validity of a study
These sources are likely to be stakeholders in a program - participants, other researchers, program staff, other community members, and so on.
Then we put all data in single framework & apply various statistical tools to find out the dynamic on the market.
During the analysis stage, feedback from the stakeholder groups would be compared to determine areas of agreement as well as areas of divergence