

Key Insights
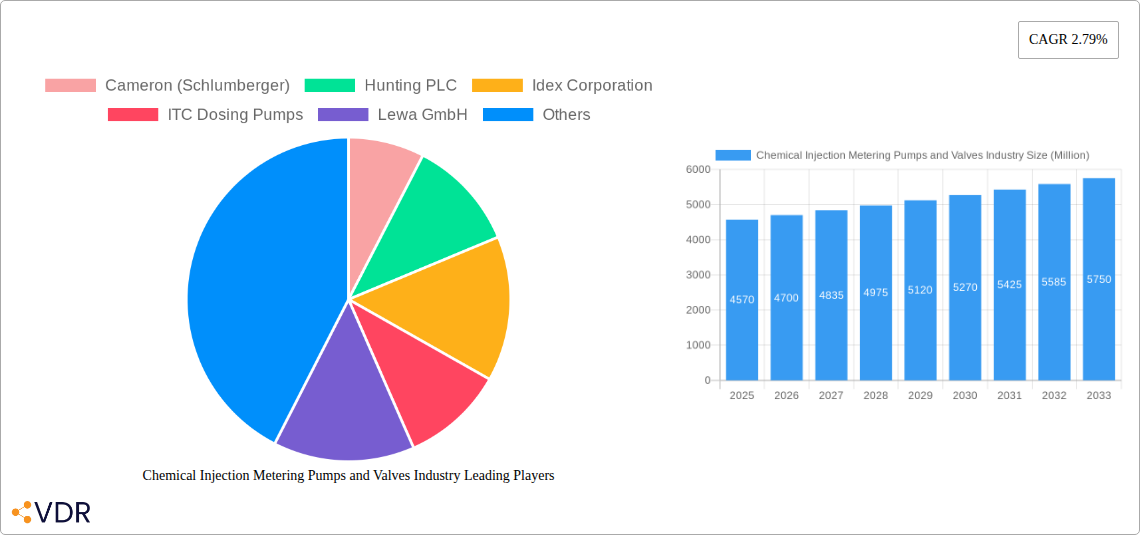
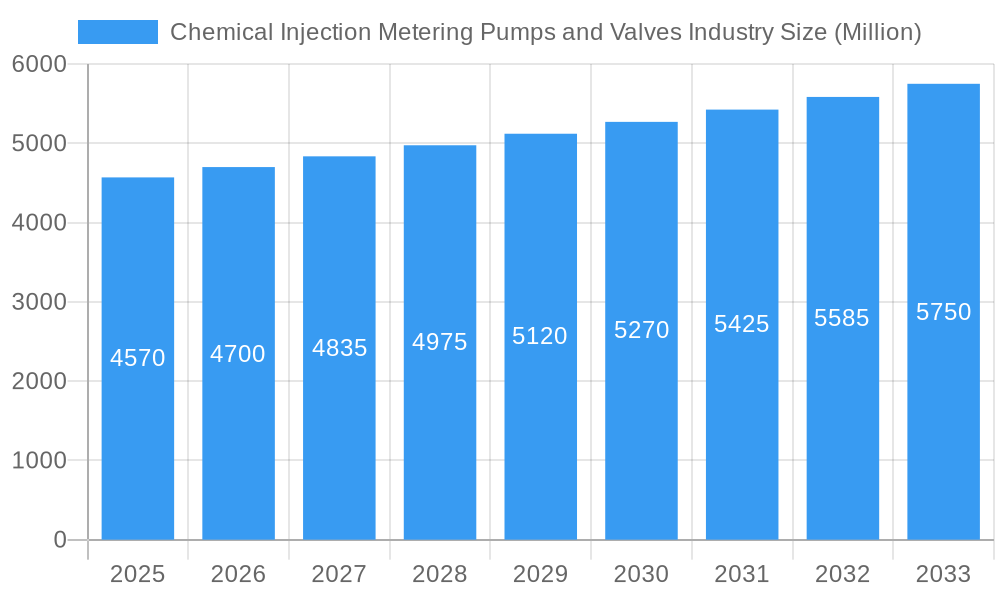
The global chemical injection metering pumps and valves market, valued at $4.57 billion in 2025, is projected to experience steady growth, driven by increasing demand across various industrial sectors. The Compound Annual Growth Rate (CAGR) of 2.79% from 2025 to 2033 indicates a consistent expansion, fueled primarily by the robust growth of the chemical processing, oil and gas, and water treatment industries. These sectors rely heavily on precise chemical injection for process optimization, efficiency improvements, and environmental compliance. Technological advancements in pump design, such as the incorporation of smart sensors and automation capabilities, are further enhancing market growth. Increased adoption of stringent environmental regulations globally is also a significant driver, pushing industries towards more precise and efficient chemical handling solutions to minimize waste and emissions. However, the market faces challenges such as high initial investment costs associated with advanced metering pumps and fluctuating raw material prices, which can impact overall profitability. Despite these restraints, the long-term outlook for the chemical injection metering pumps and valves market remains positive, given the ongoing industrial expansion and the growing emphasis on sustainable practices.
Chemical Injection Metering Pumps and Valves Industry Market Size (In Billion)
The market is segmented based on pump type (e.g., diaphragm pumps, piston pumps, centrifugal pumps), valve type (e.g., ball valves, butterfly valves, globe valves), application (e.g., chemical processing, oil and gas, water treatment), and region. Key players such as Cameron (Schlumberger), Hunting PLC, and others are actively engaged in developing innovative products and expanding their market presence through strategic partnerships and acquisitions. Regional variations in market growth are expected, with regions experiencing rapid industrialization likely showing higher growth rates than others. The forecast period of 2025-2033 presents significant opportunities for market players to capitalize on technological advancements and the increasing demand for efficient and reliable chemical injection systems. The competitive landscape is expected to remain dynamic with a focus on innovation, product differentiation, and expanding into new geographical markets.
Chemical Injection Metering Pumps and Valves Industry Company Market Share
Chemical Injection Metering Pumps and Valves Industry: A Comprehensive Market Report (2019-2033)
This comprehensive report provides an in-depth analysis of the global Chemical Injection Metering Pumps and Valves industry, encompassing market dynamics, growth trends, regional performance, product landscape, and key players. The report covers the period 2019-2033, with 2025 as the base year and estimated year. The detailed analysis will equip stakeholders with actionable insights to navigate this dynamic market effectively. The parent market is the broader industrial process equipment market, while the child market is the niche segment focusing on chemical injection within various industries. The total market size in 2025 is estimated at $XX Million.
Chemical Injection Metering Pumps and Valves Industry Market Dynamics & Structure
The Chemical Injection Metering Pumps and Valves market is characterized by a moderately concentrated landscape, with key players holding significant market share. Technological innovation, particularly in areas like precision metering, smart sensors, and automation, is a major driver. Regulatory frameworks concerning environmental compliance and safety standards significantly impact market growth. Competitive pressures stem from substitutes such as alternative chemical delivery methods and the emergence of new technologies. End-user demographics are diverse, spanning oil & gas, water treatment, chemical processing, and power generation. M&A activity has been moderate, with a focus on consolidating market share and expanding product portfolios. An estimated xx% of market share is consolidated among top 5 players. The number of M&A deals from 2019-2024 stood at approximately xx.
- Market Concentration: Moderately concentrated, with top players controlling approximately xx% market share.
- Technological Innovation: Focus on precision, smart sensors, and automation.
- Regulatory Landscape: Stringent environmental and safety regulations are driving demand for advanced solutions.
- Competitive Substitutes: Alternative chemical delivery methods pose a competitive threat.
- End-User Demographics: Diverse, including oil & gas, water treatment, chemical processing, and power generation.
- M&A Activity: Moderate, aimed at consolidating market share and expanding product portfolios.
Chemical Injection Metering Pumps and Valves Industry Growth Trends & Insights
The Chemical Injection Metering Pumps and Valves market demonstrated robust growth during the historical period (2019-2024), exhibiting a Compound Annual Growth Rate (CAGR) of **XX%**. This expansion was primarily fueled by the escalating demand across a diverse spectrum of end-use industries, including water treatment, oil and gas, pharmaceuticals, and agriculture. A significant trend observed is the accelerating adoption rate of advanced metering pumps, particularly those equipped with integrated digital capabilities, enhancing precision, control, and data logging. Technological disruptions, such as the seamless integration of the Internet of Things (IoT) for remote monitoring and Artificial Intelligence (AI) for predictive maintenance and process optimization, are actively reshaping the market landscape. Consumer preferences are increasingly gravitating towards solutions that offer unparalleled precision in chemical dosing, reduced operational and maintenance overheads, and superior energy efficiency. Looking ahead, the market is projected to maintain a healthy growth trajectory, with an estimated CAGR of **XX%** during the forecast period (2025-2033). This sustained growth is expected to propel the market size to a projected **$XX Million** by 2033. While North America and Europe currently represent mature markets with high penetration rates, emerging economies in Asia-Pacific and Latin America present substantial untapped growth potential, driven by industrial development and increasing investments in infrastructure and manufacturing.
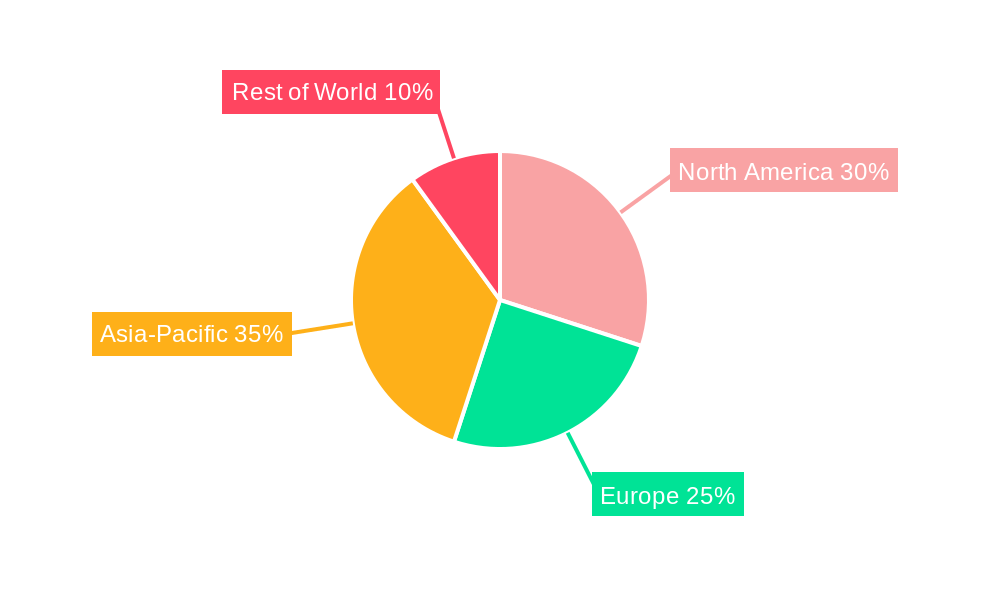
Dominant Regions, Countries, or Segments in Chemical Injection Metering Pumps and Valves Industry
North America currently holds the largest market share in the Chemical Injection Metering Pumps and Valves industry, driven by robust industrial activity and stringent environmental regulations. Europe follows closely, benefiting from similar factors. The Asia-Pacific region presents significant growth opportunities due to rapid industrialization and infrastructure development. Within segments, the demand for high-pressure pumps and specialized valves for critical applications is particularly strong.
- North America: Strong industrial base, stringent environmental regulations, high adoption rates.
- Europe: Similar drivers as North America, with a focus on sustainable technologies.
- Asia-Pacific: Rapid industrialization, infrastructure development, significant growth potential.
- High-Pressure Pumps: High demand in oil & gas and chemical processing.
- Specialized Valves: Strong demand driven by safety and precision requirements.
Chemical Injection Metering Pumps and Valves Industry Product Landscape
The Chemical Injection Metering Pumps and Valves market offers a diverse range of products, including positive displacement pumps, diaphragm pumps, centrifugal pumps, and various valve types. Product innovations focus on enhanced precision, improved durability, and reduced maintenance requirements. Technological advancements encompass smart sensors, automated control systems, and digital interfaces for enhanced monitoring and optimization. Unique selling propositions often revolve around energy efficiency, ease of use, and compliance with specific industry regulations.
Key Drivers, Barriers & Challenges in Chemical Injection Metering Pumps and Valves Industry
Key Drivers: Increasing demand from diverse industries (oil & gas, water treatment, etc.), stringent environmental regulations promoting precise chemical injection, advancements in automation and digital technologies, and growing focus on process optimization and efficiency.
Key Challenges: High initial investment costs for advanced systems, potential supply chain disruptions impacting raw material availability, and intense competition among established players. The global supply chain issues of 2021-2023 caused a xx% increase in manufacturing costs, impacting profitability.
Emerging Opportunities in Chemical Injection Metering Pumps and Valves Industry
Untapped markets in developing economies, growing demand for sustainable and eco-friendly solutions, integration of advanced materials for enhanced corrosion resistance, and development of customized solutions for niche applications.
Growth Accelerators in the Chemical Injection Metering Pumps and Valves Industry Industry
Several key factors are acting as significant growth accelerators for the Chemical Injection Metering Pumps and Valves industry. These include:
- Technological Advancements in Metering Precision: Continuous innovation in pump design and control systems is leading to enhanced accuracy and reliability in chemical dosing, which is critical for safety and efficiency in various applications.
- Development of Smart and Connected Pumps: The integration of IoT sensors, wireless communication, and advanced analytics enables real-time monitoring, remote diagnostics, and predictive maintenance, reducing downtime and optimizing operational performance.
- Strategic Partnerships and Collaborations: Companies are actively engaging in strategic alliances, mergers, and acquisitions to broaden their product portfolios, expand their geographical reach, and leverage complementary technologies.
- Increasing Focus on Process Automation and Digitalization: The growing emphasis on Industry 4.0 principles and the digital transformation of industrial processes is driving the demand for automated and intelligent chemical injection systems that can seamlessly integrate into larger operational workflows.
- Stringent Environmental Regulations: Evolving environmental regulations worldwide are necessitating more precise and controlled chemical dosing to minimize waste, ensure compliance, and promote sustainable practices, thereby boosting the demand for advanced metering solutions.
- Growth in Key End-Use Industries: The expanding needs of sectors like water and wastewater treatment, oil and gas exploration and production, chemical manufacturing, and the food and beverage industry are creating a sustained demand for reliable chemical injection systems.
Key Players Shaping the Chemical Injection Metering Pumps and Valves Industry Market
- Cameron (Schlumberger)
- Hunting PLC
- Idex Corporation
- ITC Dosing Pumps
- Lewa GmbH
- McFarland-Tritan LLC
- Milton Roy
- ProMinent
- Seepex GmbH
- Seko SpA
- SkoFlo Industries Inc
- SPX FLOW Inc
- Swelore Engineering Pvt Ltd
Notable Milestones in Chemical Injection Metering Pumps and Valves Industry Sector
- 2020: ProMinent revolutionized the market with the introduction of its next-generation smart pumps, featuring advanced integrated IoT capabilities that enable sophisticated remote monitoring and control, enhancing operational efficiency for users.
- 2022: SPX FLOW Inc strategically expanded its product portfolio and market presence through the acquisition of a specialized smaller valve manufacturer, reinforcing its position in the chemical injection solutions segment.
- 2023: Cameron (Schlumberger) addressed the stringent demands of the oil and gas sector by launching a cutting-edge high-pressure pump engineered for challenging operational environments, demonstrating their commitment to specialized industry needs.
- 2023: Lewa GmbH introduced a new series of diaphragm metering pumps with enhanced chemical resistance and operational flexibility, catering to a wider range of corrosive and sensitive media applications.
- 2024: Idex Corporation announced a significant investment in R&D for developing AI-driven predictive maintenance algorithms for their metering pump systems, aiming to further reduce unplanned downtime for their clients.
In-Depth Chemical Injection Metering Pumps and Valves Industry Market Outlook
The Chemical Injection Metering Pumps and Valves market is firmly positioned for sustained and significant growth in the coming years. This positive outlook is underpinned by a confluence of factors, including relentless technological innovation, a continually expanding demand base across diverse industrial sectors, and aggressive market penetration strategies into burgeoning geographical regions. The development and adoption of 'smart' pumps with enhanced connectivity and data analytics capabilities will remain a dominant trend, offering unparalleled precision, efficiency, and remote management. Strategic partnerships, joint ventures, and acquisitions are expected to be instrumental in consolidating market share, facilitating technology transfer, and expanding product offerings globally. Furthermore, the increasing global emphasis on sustainability, environmental stewardship, and resource optimization will continue to drive the demand for highly efficient and precise chemical injection solutions that minimize waste and ensure regulatory compliance. Manufacturers will increasingly focus on developing solutions that offer a lower total cost of ownership, encompassing energy savings, reduced maintenance needs, and extended equipment lifespan. The market's evolution will be characterized by a dynamic interplay of technological advancement, strategic corporate actions, and the ever-present need for reliable, accurate, and efficient chemical dosing across a global industrial landscape.
Chemical Injection Metering Pumps and Valves Industry Segmentation
-
1. Pump Type
- 1.1. Diaphragm
- 1.2. Piston/Plunger
- 1.3. Other Pump Types
-
2. End-user Industry
- 2.1. Energy, Power, and Chemicals
- 2.2. Oil and Gas
- 2.3. Water and Wastewater Treatment
- 2.4. Food and Beverage
- 2.5. Pharmaceutical
Chemical Injection Metering Pumps and Valves Industry Segmentation By Geography
-
1. Asia Pacific
- 1.1. China
- 1.2. India
- 1.3. Japan
- 1.4. South Korea
- 1.5. ASEAN Countries
- 1.6. Australia and New Zealand
- 1.7. Rest of Asia Pacific
-
2. North America
- 2.1. United States
- 2.2. Canada
- 2.3. Mexico
-
3. Europe
- 3.1. Germany
- 3.2. United Kingdom
- 3.3. Italy
- 3.4. France
- 3.5. Russia
- 3.6. Spain
- 3.7. Rest of Europe
-
4. South America
- 4.1. Brazil
- 4.2. Argentina
- 4.3. Rest of South America
-
5. Middle East and Africa
- 5.1. Saudi Arabia
- 5.2. South Africa
- 5.3. Rest of Middle East and Africa
Chemical Injection Metering Pumps and Valves Industry Regional Market Share
Geographic Coverage of Chemical Injection Metering Pumps and Valves Industry
Chemical Injection Metering Pumps and Valves Industry REPORT HIGHLIGHTS
| Aspects | Details |
|---|---|
| Study Period | 2020-2034 |
| Base Year | 2025 |
| Estimated Year | 2026 |
| Forecast Period | 2026-2034 |
| Historical Period | 2020-2025 |
| Growth Rate | CAGR of 2.79% from 2020-2034 |
| Segmentation |
|
Table of Contents
- 1. Introduction
- 1.1. Research Scope
- 1.2. Market Segmentation
- 1.3. Research Objective
- 1.4. Definitions and Assumptions
- 2. Executive Summary
- 2.1. Market Snapshot
- 3. Market Dynamics
- 3.1. Market Drivers
- 3.2. Market Restrains
- 3.3. Market Trends
- 3.4. Market Opportunities
- 4. Market Factor Analysis
- 4.1. Porters Five Forces
- 4.1.1. Bargaining Power of Suppliers
- 4.1.2. Bargaining Power of Buyers
- 4.1.3. Threat of New Entrants
- 4.1.4. Threat of Substitutes
- 4.1.5. Competitive Rivalry
- 4.2. PESTEL analysis
- 4.3. BCG Analysis
- 4.3.1. Stars (High Growth, High Market Share)
- 4.3.2. Cash Cows (Low Growth, High Market Share)
- 4.3.3. Question Mark (High Growth, Low Market Share)
- 4.3.4. Dogs (Low Growth, Low Market Share)
- 4.4. Ansoff Matrix Analysis
- 4.5. Supply Chain Analysis
- 4.6. Regulatory Landscape
- 4.7. Current Market Potential and Opportunity Assessment (TAM–SAM–SOM Framework)
- 4.8. VDR Analyst Note
- 4.1. Porters Five Forces
- 5. Market Analysis, Insights and Forecast 2021-2033
- 5.1. Market Analysis, Insights and Forecast - by Pump Type
- 5.1.1. Diaphragm
- 5.1.2. Piston/Plunger
- 5.1.3. Other Pump Types
- 5.2. Market Analysis, Insights and Forecast - by End-user Industry
- 5.2.1. Energy, Power, and Chemicals
- 5.2.2. Oil and Gas
- 5.2.3. Water and Wastewater Treatment
- 5.2.4. Food and Beverage
- 5.2.5. Pharmaceutical
- 5.3. Market Analysis, Insights and Forecast - by Region
- 5.3.1. Asia Pacific
- 5.3.2. North America
- 5.3.3. Europe
- 5.3.4. South America
- 5.3.5. Middle East and Africa
- 5.1. Market Analysis, Insights and Forecast - by Pump Type
- 6. Global Chemical Injection Metering Pumps and Valves Industry Analysis, Insights and Forecast, 2021-2033
- 6.1. Market Analysis, Insights and Forecast - by Pump Type
- 6.1.1. Diaphragm
- 6.1.2. Piston/Plunger
- 6.1.3. Other Pump Types
- 6.2. Market Analysis, Insights and Forecast - by End-user Industry
- 6.2.1. Energy, Power, and Chemicals
- 6.2.2. Oil and Gas
- 6.2.3. Water and Wastewater Treatment
- 6.2.4. Food and Beverage
- 6.2.5. Pharmaceutical
- 6.1. Market Analysis, Insights and Forecast - by Pump Type
- 7. Asia Pacific Chemical Injection Metering Pumps and Valves Industry Analysis, Insights and Forecast, 2021-2033
- 7.1. Market Analysis, Insights and Forecast - by Pump Type
- 7.1.1. Diaphragm
- 7.1.2. Piston/Plunger
- 7.1.3. Other Pump Types
- 7.2. Market Analysis, Insights and Forecast - by End-user Industry
- 7.2.1. Energy, Power, and Chemicals
- 7.2.2. Oil and Gas
- 7.2.3. Water and Wastewater Treatment
- 7.2.4. Food and Beverage
- 7.2.5. Pharmaceutical
- 7.1. Market Analysis, Insights and Forecast - by Pump Type
- 8. North America Chemical Injection Metering Pumps and Valves Industry Analysis, Insights and Forecast, 2021-2033
- 8.1. Market Analysis, Insights and Forecast - by Pump Type
- 8.1.1. Diaphragm
- 8.1.2. Piston/Plunger
- 8.1.3. Other Pump Types
- 8.2. Market Analysis, Insights and Forecast - by End-user Industry
- 8.2.1. Energy, Power, and Chemicals
- 8.2.2. Oil and Gas
- 8.2.3. Water and Wastewater Treatment
- 8.2.4. Food and Beverage
- 8.2.5. Pharmaceutical
- 8.1. Market Analysis, Insights and Forecast - by Pump Type
- 9. Europe Chemical Injection Metering Pumps and Valves Industry Analysis, Insights and Forecast, 2021-2033
- 9.1. Market Analysis, Insights and Forecast - by Pump Type
- 9.1.1. Diaphragm
- 9.1.2. Piston/Plunger
- 9.1.3. Other Pump Types
- 9.2. Market Analysis, Insights and Forecast - by End-user Industry
- 9.2.1. Energy, Power, and Chemicals
- 9.2.2. Oil and Gas
- 9.2.3. Water and Wastewater Treatment
- 9.2.4. Food and Beverage
- 9.2.5. Pharmaceutical
- 9.1. Market Analysis, Insights and Forecast - by Pump Type
- 10. South America Chemical Injection Metering Pumps and Valves Industry Analysis, Insights and Forecast, 2021-2033
- 10.1. Market Analysis, Insights and Forecast - by Pump Type
- 10.1.1. Diaphragm
- 10.1.2. Piston/Plunger
- 10.1.3. Other Pump Types
- 10.2. Market Analysis, Insights and Forecast - by End-user Industry
- 10.2.1. Energy, Power, and Chemicals
- 10.2.2. Oil and Gas
- 10.2.3. Water and Wastewater Treatment
- 10.2.4. Food and Beverage
- 10.2.5. Pharmaceutical
- 10.1. Market Analysis, Insights and Forecast - by Pump Type
- 11. Middle East and Africa Chemical Injection Metering Pumps and Valves Industry Analysis, Insights and Forecast, 2021-2033
- 11.1. Market Analysis, Insights and Forecast - by Pump Type
- 11.1.1. Diaphragm
- 11.1.2. Piston/Plunger
- 11.1.3. Other Pump Types
- 11.2. Market Analysis, Insights and Forecast - by End-user Industry
- 11.2.1. Energy, Power, and Chemicals
- 11.2.2. Oil and Gas
- 11.2.3. Water and Wastewater Treatment
- 11.2.4. Food and Beverage
- 11.2.5. Pharmaceutical
- 11.1. Market Analysis, Insights and Forecast - by Pump Type
- 12. Competitive Analysis
- 12.1. Company Profiles
- 12.1.1 Cameron (Schlumberger)
- 12.1.1.1. Company Overview
- 12.1.1.2. Products
- 12.1.1.3. Company Financials
- 12.1.1.4. SWOT Analysis
- 12.1.2 Hunting PLC
- 12.1.2.1. Company Overview
- 12.1.2.2. Products
- 12.1.2.3. Company Financials
- 12.1.2.4. SWOT Analysis
- 12.1.3 Idex Corporation
- 12.1.3.1. Company Overview
- 12.1.3.2. Products
- 12.1.3.3. Company Financials
- 12.1.3.4. SWOT Analysis
- 12.1.4 ITC Dosing Pumps
- 12.1.4.1. Company Overview
- 12.1.4.2. Products
- 12.1.4.3. Company Financials
- 12.1.4.4. SWOT Analysis
- 12.1.5 Lewa GmbH
- 12.1.5.1. Company Overview
- 12.1.5.2. Products
- 12.1.5.3. Company Financials
- 12.1.5.4. SWOT Analysis
- 12.1.6 McFarland-Tritan LLC
- 12.1.6.1. Company Overview
- 12.1.6.2. Products
- 12.1.6.3. Company Financials
- 12.1.6.4. SWOT Analysis
- 12.1.7 Milton Roy
- 12.1.7.1. Company Overview
- 12.1.7.2. Products
- 12.1.7.3. Company Financials
- 12.1.7.4. SWOT Analysis
- 12.1.8 ProMinent
- 12.1.8.1. Company Overview
- 12.1.8.2. Products
- 12.1.8.3. Company Financials
- 12.1.8.4. SWOT Analysis
- 12.1.9 Seepex GmbH
- 12.1.9.1. Company Overview
- 12.1.9.2. Products
- 12.1.9.3. Company Financials
- 12.1.9.4. SWOT Analysis
- 12.1.10 Seko SpA
- 12.1.10.1. Company Overview
- 12.1.10.2. Products
- 12.1.10.3. Company Financials
- 12.1.10.4. SWOT Analysis
- 12.1.11 SkoFlo Industries Inc
- 12.1.11.1. Company Overview
- 12.1.11.2. Products
- 12.1.11.3. Company Financials
- 12.1.11.4. SWOT Analysis
- 12.1.12 SPX FLOW Inc
- 12.1.12.1. Company Overview
- 12.1.12.2. Products
- 12.1.12.3. Company Financials
- 12.1.12.4. SWOT Analysis
- 12.1.13 Swelore Engineering Pvt Ltd *List Not Exhaustive
- 12.1.13.1. Company Overview
- 12.1.13.2. Products
- 12.1.13.3. Company Financials
- 12.1.13.4. SWOT Analysis
- 12.1.1 Cameron (Schlumberger)
- 12.2. Market Entropy
- 12.2.1 Company's Key Areas Served
- 12.2.2 Recent Developments
- 12.3. Company Market Share Analysis 2025
- 12.3.1 Top 5 Companies Market Share Analysis
- 12.3.2 Top 3 Companies Market Share Analysis
- 12.4. List of Potential Customers
- 13. Research Methodology
List of Figures
- Figure 1: Global Chemical Injection Metering Pumps and Valves Industry Revenue Breakdown (Million, %) by Region 2025 & 2033
- Figure 2: Global Chemical Injection Metering Pumps and Valves Industry Volume Breakdown (Billion, %) by Region 2025 & 2033
- Figure 3: Asia Pacific Chemical Injection Metering Pumps and Valves Industry Revenue (Million), by Pump Type 2025 & 2033
- Figure 4: Asia Pacific Chemical Injection Metering Pumps and Valves Industry Volume (Billion), by Pump Type 2025 & 2033
- Figure 5: Asia Pacific Chemical Injection Metering Pumps and Valves Industry Revenue Share (%), by Pump Type 2025 & 2033
- Figure 6: Asia Pacific Chemical Injection Metering Pumps and Valves Industry Volume Share (%), by Pump Type 2025 & 2033
- Figure 7: Asia Pacific Chemical Injection Metering Pumps and Valves Industry Revenue (Million), by End-user Industry 2025 & 2033
- Figure 8: Asia Pacific Chemical Injection Metering Pumps and Valves Industry Volume (Billion), by End-user Industry 2025 & 2033
- Figure 9: Asia Pacific Chemical Injection Metering Pumps and Valves Industry Revenue Share (%), by End-user Industry 2025 & 2033
- Figure 10: Asia Pacific Chemical Injection Metering Pumps and Valves Industry Volume Share (%), by End-user Industry 2025 & 2033
- Figure 11: Asia Pacific Chemical Injection Metering Pumps and Valves Industry Revenue (Million), by Country 2025 & 2033
- Figure 12: Asia Pacific Chemical Injection Metering Pumps and Valves Industry Volume (Billion), by Country 2025 & 2033
- Figure 13: Asia Pacific Chemical Injection Metering Pumps and Valves Industry Revenue Share (%), by Country 2025 & 2033
- Figure 14: Asia Pacific Chemical Injection Metering Pumps and Valves Industry Volume Share (%), by Country 2025 & 2033
- Figure 15: North America Chemical Injection Metering Pumps and Valves Industry Revenue (Million), by Pump Type 2025 & 2033
- Figure 16: North America Chemical Injection Metering Pumps and Valves Industry Volume (Billion), by Pump Type 2025 & 2033
- Figure 17: North America Chemical Injection Metering Pumps and Valves Industry Revenue Share (%), by Pump Type 2025 & 2033
- Figure 18: North America Chemical Injection Metering Pumps and Valves Industry Volume Share (%), by Pump Type 2025 & 2033
- Figure 19: North America Chemical Injection Metering Pumps and Valves Industry Revenue (Million), by End-user Industry 2025 & 2033
- Figure 20: North America Chemical Injection Metering Pumps and Valves Industry Volume (Billion), by End-user Industry 2025 & 2033
- Figure 21: North America Chemical Injection Metering Pumps and Valves Industry Revenue Share (%), by End-user Industry 2025 & 2033
- Figure 22: North America Chemical Injection Metering Pumps and Valves Industry Volume Share (%), by End-user Industry 2025 & 2033
- Figure 23: North America Chemical Injection Metering Pumps and Valves Industry Revenue (Million), by Country 2025 & 2033
- Figure 24: North America Chemical Injection Metering Pumps and Valves Industry Volume (Billion), by Country 2025 & 2033
- Figure 25: North America Chemical Injection Metering Pumps and Valves Industry Revenue Share (%), by Country 2025 & 2033
- Figure 26: North America Chemical Injection Metering Pumps and Valves Industry Volume Share (%), by Country 2025 & 2033
- Figure 27: Europe Chemical Injection Metering Pumps and Valves Industry Revenue (Million), by Pump Type 2025 & 2033
- Figure 28: Europe Chemical Injection Metering Pumps and Valves Industry Volume (Billion), by Pump Type 2025 & 2033
- Figure 29: Europe Chemical Injection Metering Pumps and Valves Industry Revenue Share (%), by Pump Type 2025 & 2033
- Figure 30: Europe Chemical Injection Metering Pumps and Valves Industry Volume Share (%), by Pump Type 2025 & 2033
- Figure 31: Europe Chemical Injection Metering Pumps and Valves Industry Revenue (Million), by End-user Industry 2025 & 2033
- Figure 32: Europe Chemical Injection Metering Pumps and Valves Industry Volume (Billion), by End-user Industry 2025 & 2033
- Figure 33: Europe Chemical Injection Metering Pumps and Valves Industry Revenue Share (%), by End-user Industry 2025 & 2033
- Figure 34: Europe Chemical Injection Metering Pumps and Valves Industry Volume Share (%), by End-user Industry 2025 & 2033
- Figure 35: Europe Chemical Injection Metering Pumps and Valves Industry Revenue (Million), by Country 2025 & 2033
- Figure 36: Europe Chemical Injection Metering Pumps and Valves Industry Volume (Billion), by Country 2025 & 2033
- Figure 37: Europe Chemical Injection Metering Pumps and Valves Industry Revenue Share (%), by Country 2025 & 2033
- Figure 38: Europe Chemical Injection Metering Pumps and Valves Industry Volume Share (%), by Country 2025 & 2033
- Figure 39: South America Chemical Injection Metering Pumps and Valves Industry Revenue (Million), by Pump Type 2025 & 2033
- Figure 40: South America Chemical Injection Metering Pumps and Valves Industry Volume (Billion), by Pump Type 2025 & 2033
- Figure 41: South America Chemical Injection Metering Pumps and Valves Industry Revenue Share (%), by Pump Type 2025 & 2033
- Figure 42: South America Chemical Injection Metering Pumps and Valves Industry Volume Share (%), by Pump Type 2025 & 2033
- Figure 43: South America Chemical Injection Metering Pumps and Valves Industry Revenue (Million), by End-user Industry 2025 & 2033
- Figure 44: South America Chemical Injection Metering Pumps and Valves Industry Volume (Billion), by End-user Industry 2025 & 2033
- Figure 45: South America Chemical Injection Metering Pumps and Valves Industry Revenue Share (%), by End-user Industry 2025 & 2033
- Figure 46: South America Chemical Injection Metering Pumps and Valves Industry Volume Share (%), by End-user Industry 2025 & 2033
- Figure 47: South America Chemical Injection Metering Pumps and Valves Industry Revenue (Million), by Country 2025 & 2033
- Figure 48: South America Chemical Injection Metering Pumps and Valves Industry Volume (Billion), by Country 2025 & 2033
- Figure 49: South America Chemical Injection Metering Pumps and Valves Industry Revenue Share (%), by Country 2025 & 2033
- Figure 50: South America Chemical Injection Metering Pumps and Valves Industry Volume Share (%), by Country 2025 & 2033
- Figure 51: Middle East and Africa Chemical Injection Metering Pumps and Valves Industry Revenue (Million), by Pump Type 2025 & 2033
- Figure 52: Middle East and Africa Chemical Injection Metering Pumps and Valves Industry Volume (Billion), by Pump Type 2025 & 2033
- Figure 53: Middle East and Africa Chemical Injection Metering Pumps and Valves Industry Revenue Share (%), by Pump Type 2025 & 2033
- Figure 54: Middle East and Africa Chemical Injection Metering Pumps and Valves Industry Volume Share (%), by Pump Type 2025 & 2033
- Figure 55: Middle East and Africa Chemical Injection Metering Pumps and Valves Industry Revenue (Million), by End-user Industry 2025 & 2033
- Figure 56: Middle East and Africa Chemical Injection Metering Pumps and Valves Industry Volume (Billion), by End-user Industry 2025 & 2033
- Figure 57: Middle East and Africa Chemical Injection Metering Pumps and Valves Industry Revenue Share (%), by End-user Industry 2025 & 2033
- Figure 58: Middle East and Africa Chemical Injection Metering Pumps and Valves Industry Volume Share (%), by End-user Industry 2025 & 2033
- Figure 59: Middle East and Africa Chemical Injection Metering Pumps and Valves Industry Revenue (Million), by Country 2025 & 2033
- Figure 60: Middle East and Africa Chemical Injection Metering Pumps and Valves Industry Volume (Billion), by Country 2025 & 2033
- Figure 61: Middle East and Africa Chemical Injection Metering Pumps and Valves Industry Revenue Share (%), by Country 2025 & 2033
- Figure 62: Middle East and Africa Chemical Injection Metering Pumps and Valves Industry Volume Share (%), by Country 2025 & 2033
List of Tables
- Table 1: Global Chemical Injection Metering Pumps and Valves Industry Revenue Million Forecast, by Pump Type 2020 & 2033
- Table 2: Global Chemical Injection Metering Pumps and Valves Industry Volume Billion Forecast, by Pump Type 2020 & 2033
- Table 3: Global Chemical Injection Metering Pumps and Valves Industry Revenue Million Forecast, by End-user Industry 2020 & 2033
- Table 4: Global Chemical Injection Metering Pumps and Valves Industry Volume Billion Forecast, by End-user Industry 2020 & 2033
- Table 5: Global Chemical Injection Metering Pumps and Valves Industry Revenue Million Forecast, by Region 2020 & 2033
- Table 6: Global Chemical Injection Metering Pumps and Valves Industry Volume Billion Forecast, by Region 2020 & 2033
- Table 7: Global Chemical Injection Metering Pumps and Valves Industry Revenue Million Forecast, by Pump Type 2020 & 2033
- Table 8: Global Chemical Injection Metering Pumps and Valves Industry Volume Billion Forecast, by Pump Type 2020 & 2033
- Table 9: Global Chemical Injection Metering Pumps and Valves Industry Revenue Million Forecast, by End-user Industry 2020 & 2033
- Table 10: Global Chemical Injection Metering Pumps and Valves Industry Volume Billion Forecast, by End-user Industry 2020 & 2033
- Table 11: Global Chemical Injection Metering Pumps and Valves Industry Revenue Million Forecast, by Country 2020 & 2033
- Table 12: Global Chemical Injection Metering Pumps and Valves Industry Volume Billion Forecast, by Country 2020 & 2033
- Table 13: China Chemical Injection Metering Pumps and Valves Industry Revenue (Million) Forecast, by Application 2020 & 2033
- Table 14: China Chemical Injection Metering Pumps and Valves Industry Volume (Billion) Forecast, by Application 2020 & 2033
- Table 15: India Chemical Injection Metering Pumps and Valves Industry Revenue (Million) Forecast, by Application 2020 & 2033
- Table 16: India Chemical Injection Metering Pumps and Valves Industry Volume (Billion) Forecast, by Application 2020 & 2033
- Table 17: Japan Chemical Injection Metering Pumps and Valves Industry Revenue (Million) Forecast, by Application 2020 & 2033
- Table 18: Japan Chemical Injection Metering Pumps and Valves Industry Volume (Billion) Forecast, by Application 2020 & 2033
- Table 19: South Korea Chemical Injection Metering Pumps and Valves Industry Revenue (Million) Forecast, by Application 2020 & 2033
- Table 20: South Korea Chemical Injection Metering Pumps and Valves Industry Volume (Billion) Forecast, by Application 2020 & 2033
- Table 21: ASEAN Countries Chemical Injection Metering Pumps and Valves Industry Revenue (Million) Forecast, by Application 2020 & 2033
- Table 22: ASEAN Countries Chemical Injection Metering Pumps and Valves Industry Volume (Billion) Forecast, by Application 2020 & 2033
- Table 23: Australia and New Zealand Chemical Injection Metering Pumps and Valves Industry Revenue (Million) Forecast, by Application 2020 & 2033
- Table 24: Australia and New Zealand Chemical Injection Metering Pumps and Valves Industry Volume (Billion) Forecast, by Application 2020 & 2033
- Table 25: Rest of Asia Pacific Chemical Injection Metering Pumps and Valves Industry Revenue (Million) Forecast, by Application 2020 & 2033
- Table 26: Rest of Asia Pacific Chemical Injection Metering Pumps and Valves Industry Volume (Billion) Forecast, by Application 2020 & 2033
- Table 27: Global Chemical Injection Metering Pumps and Valves Industry Revenue Million Forecast, by Pump Type 2020 & 2033
- Table 28: Global Chemical Injection Metering Pumps and Valves Industry Volume Billion Forecast, by Pump Type 2020 & 2033
- Table 29: Global Chemical Injection Metering Pumps and Valves Industry Revenue Million Forecast, by End-user Industry 2020 & 2033
- Table 30: Global Chemical Injection Metering Pumps and Valves Industry Volume Billion Forecast, by End-user Industry 2020 & 2033
- Table 31: Global Chemical Injection Metering Pumps and Valves Industry Revenue Million Forecast, by Country 2020 & 2033
- Table 32: Global Chemical Injection Metering Pumps and Valves Industry Volume Billion Forecast, by Country 2020 & 2033
- Table 33: United States Chemical Injection Metering Pumps and Valves Industry Revenue (Million) Forecast, by Application 2020 & 2033
- Table 34: United States Chemical Injection Metering Pumps and Valves Industry Volume (Billion) Forecast, by Application 2020 & 2033
- Table 35: Canada Chemical Injection Metering Pumps and Valves Industry Revenue (Million) Forecast, by Application 2020 & 2033
- Table 36: Canada Chemical Injection Metering Pumps and Valves Industry Volume (Billion) Forecast, by Application 2020 & 2033
- Table 37: Mexico Chemical Injection Metering Pumps and Valves Industry Revenue (Million) Forecast, by Application 2020 & 2033
- Table 38: Mexico Chemical Injection Metering Pumps and Valves Industry Volume (Billion) Forecast, by Application 2020 & 2033
- Table 39: Global Chemical Injection Metering Pumps and Valves Industry Revenue Million Forecast, by Pump Type 2020 & 2033
- Table 40: Global Chemical Injection Metering Pumps and Valves Industry Volume Billion Forecast, by Pump Type 2020 & 2033
- Table 41: Global Chemical Injection Metering Pumps and Valves Industry Revenue Million Forecast, by End-user Industry 2020 & 2033
- Table 42: Global Chemical Injection Metering Pumps and Valves Industry Volume Billion Forecast, by End-user Industry 2020 & 2033
- Table 43: Global Chemical Injection Metering Pumps and Valves Industry Revenue Million Forecast, by Country 2020 & 2033
- Table 44: Global Chemical Injection Metering Pumps and Valves Industry Volume Billion Forecast, by Country 2020 & 2033
- Table 45: Germany Chemical Injection Metering Pumps and Valves Industry Revenue (Million) Forecast, by Application 2020 & 2033
- Table 46: Germany Chemical Injection Metering Pumps and Valves Industry Volume (Billion) Forecast, by Application 2020 & 2033
- Table 47: United Kingdom Chemical Injection Metering Pumps and Valves Industry Revenue (Million) Forecast, by Application 2020 & 2033
- Table 48: United Kingdom Chemical Injection Metering Pumps and Valves Industry Volume (Billion) Forecast, by Application 2020 & 2033
- Table 49: Italy Chemical Injection Metering Pumps and Valves Industry Revenue (Million) Forecast, by Application 2020 & 2033
- Table 50: Italy Chemical Injection Metering Pumps and Valves Industry Volume (Billion) Forecast, by Application 2020 & 2033
- Table 51: France Chemical Injection Metering Pumps and Valves Industry Revenue (Million) Forecast, by Application 2020 & 2033
- Table 52: France Chemical Injection Metering Pumps and Valves Industry Volume (Billion) Forecast, by Application 2020 & 2033
- Table 53: Russia Chemical Injection Metering Pumps and Valves Industry Revenue (Million) Forecast, by Application 2020 & 2033
- Table 54: Russia Chemical Injection Metering Pumps and Valves Industry Volume (Billion) Forecast, by Application 2020 & 2033
- Table 55: Spain Chemical Injection Metering Pumps and Valves Industry Revenue (Million) Forecast, by Application 2020 & 2033
- Table 56: Spain Chemical Injection Metering Pumps and Valves Industry Volume (Billion) Forecast, by Application 2020 & 2033
- Table 57: Rest of Europe Chemical Injection Metering Pumps and Valves Industry Revenue (Million) Forecast, by Application 2020 & 2033
- Table 58: Rest of Europe Chemical Injection Metering Pumps and Valves Industry Volume (Billion) Forecast, by Application 2020 & 2033
- Table 59: Global Chemical Injection Metering Pumps and Valves Industry Revenue Million Forecast, by Pump Type 2020 & 2033
- Table 60: Global Chemical Injection Metering Pumps and Valves Industry Volume Billion Forecast, by Pump Type 2020 & 2033
- Table 61: Global Chemical Injection Metering Pumps and Valves Industry Revenue Million Forecast, by End-user Industry 2020 & 2033
- Table 62: Global Chemical Injection Metering Pumps and Valves Industry Volume Billion Forecast, by End-user Industry 2020 & 2033
- Table 63: Global Chemical Injection Metering Pumps and Valves Industry Revenue Million Forecast, by Country 2020 & 2033
- Table 64: Global Chemical Injection Metering Pumps and Valves Industry Volume Billion Forecast, by Country 2020 & 2033
- Table 65: Brazil Chemical Injection Metering Pumps and Valves Industry Revenue (Million) Forecast, by Application 2020 & 2033
- Table 66: Brazil Chemical Injection Metering Pumps and Valves Industry Volume (Billion) Forecast, by Application 2020 & 2033
- Table 67: Argentina Chemical Injection Metering Pumps and Valves Industry Revenue (Million) Forecast, by Application 2020 & 2033
- Table 68: Argentina Chemical Injection Metering Pumps and Valves Industry Volume (Billion) Forecast, by Application 2020 & 2033
- Table 69: Rest of South America Chemical Injection Metering Pumps and Valves Industry Revenue (Million) Forecast, by Application 2020 & 2033
- Table 70: Rest of South America Chemical Injection Metering Pumps and Valves Industry Volume (Billion) Forecast, by Application 2020 & 2033
- Table 71: Global Chemical Injection Metering Pumps and Valves Industry Revenue Million Forecast, by Pump Type 2020 & 2033
- Table 72: Global Chemical Injection Metering Pumps and Valves Industry Volume Billion Forecast, by Pump Type 2020 & 2033
- Table 73: Global Chemical Injection Metering Pumps and Valves Industry Revenue Million Forecast, by End-user Industry 2020 & 2033
- Table 74: Global Chemical Injection Metering Pumps and Valves Industry Volume Billion Forecast, by End-user Industry 2020 & 2033
- Table 75: Global Chemical Injection Metering Pumps and Valves Industry Revenue Million Forecast, by Country 2020 & 2033
- Table 76: Global Chemical Injection Metering Pumps and Valves Industry Volume Billion Forecast, by Country 2020 & 2033
- Table 77: Saudi Arabia Chemical Injection Metering Pumps and Valves Industry Revenue (Million) Forecast, by Application 2020 & 2033
- Table 78: Saudi Arabia Chemical Injection Metering Pumps and Valves Industry Volume (Billion) Forecast, by Application 2020 & 2033
- Table 79: South Africa Chemical Injection Metering Pumps and Valves Industry Revenue (Million) Forecast, by Application 2020 & 2033
- Table 80: South Africa Chemical Injection Metering Pumps and Valves Industry Volume (Billion) Forecast, by Application 2020 & 2033
- Table 81: Rest of Middle East and Africa Chemical Injection Metering Pumps and Valves Industry Revenue (Million) Forecast, by Application 2020 & 2033
- Table 82: Rest of Middle East and Africa Chemical Injection Metering Pumps and Valves Industry Volume (Billion) Forecast, by Application 2020 & 2033
Frequently Asked Questions
1. What is the projected Compound Annual Growth Rate (CAGR) of the Chemical Injection Metering Pumps and Valves Industry?
The projected CAGR is approximately 2.79%.
2. Which companies are prominent players in the Chemical Injection Metering Pumps and Valves Industry?
Key companies in the market include Cameron (Schlumberger), Hunting PLC, Idex Corporation, ITC Dosing Pumps, Lewa GmbH, McFarland-Tritan LLC, Milton Roy, ProMinent, Seepex GmbH, Seko SpA, SkoFlo Industries Inc, SPX FLOW Inc, Swelore Engineering Pvt Ltd *List Not Exhaustive.
3. What are the main segments of the Chemical Injection Metering Pumps and Valves Industry?
The market segments include Pump Type, End-user Industry.
4. Can you provide details about the market size?
The market size is estimated to be USD 4.57 Million as of 2022.
5. What are some drivers contributing to market growth?
Accelerating Demand from Wastewater Treatment Applications; Robust Operational Procedures for Regulating Environmental Concerns; Other Drivers.
6. What are the notable trends driving market growth?
Energy. Power. and Chemicals to Dominate the Market.
7. Are there any restraints impacting market growth?
Accelerating Demand from Wastewater Treatment Applications; Robust Operational Procedures for Regulating Environmental Concerns; Other Drivers.
8. Can you provide examples of recent developments in the market?
9. What pricing options are available for accessing the report?
Pricing options include single-user, multi-user, and enterprise licenses priced at USD 4750, USD 5250, and USD 8750 respectively.
10. Is the market size provided in terms of value or volume?
The market size is provided in terms of value, measured in Million and volume, measured in Billion.
11. Are there any specific market keywords associated with the report?
Yes, the market keyword associated with the report is "Chemical Injection Metering Pumps and Valves Industry," which aids in identifying and referencing the specific market segment covered.
12. How do I determine which pricing option suits my needs best?
The pricing options vary based on user requirements and access needs. Individual users may opt for single-user licenses, while businesses requiring broader access may choose multi-user or enterprise licenses for cost-effective access to the report.
13. Are there any additional resources or data provided in the Chemical Injection Metering Pumps and Valves Industry report?
While the report offers comprehensive insights, it's advisable to review the specific contents or supplementary materials provided to ascertain if additional resources or data are available.
14. How can I stay updated on further developments or reports in the Chemical Injection Metering Pumps and Valves Industry?
To stay informed about further developments, trends, and reports in the Chemical Injection Metering Pumps and Valves Industry, consider subscribing to industry newsletters, following relevant companies and organizations, or regularly checking reputable industry news sources and publications.
Methodology
Step 1 - Identification of Relevant Samples Size from Population Database


Step 2 - Approaches for Defining Global Market Size (Value, Volume* & Price*)

Note*: In applicable scenarios
Step 3 - Data Sources
Primary Research
- Web Analytics
- Survey Reports
- Research Institute
- Latest Research Reports
- Opinion Leaders
Secondary Research
- Annual Reports
- White Paper
- Latest Press Release
- Industry Association
- Paid Database
- Investor Presentations

Step 4 - Data Triangulation
Involves using different sources of information in order to increase the validity of a study
These sources are likely to be stakeholders in a program - participants, other researchers, program staff, other community members, and so on.
Then we put all data in single framework & apply various statistical tools to find out the dynamic on the market.
During the analysis stage, feedback from the stakeholder groups would be compared to determine areas of agreement as well as areas of divergence