

Key Insights
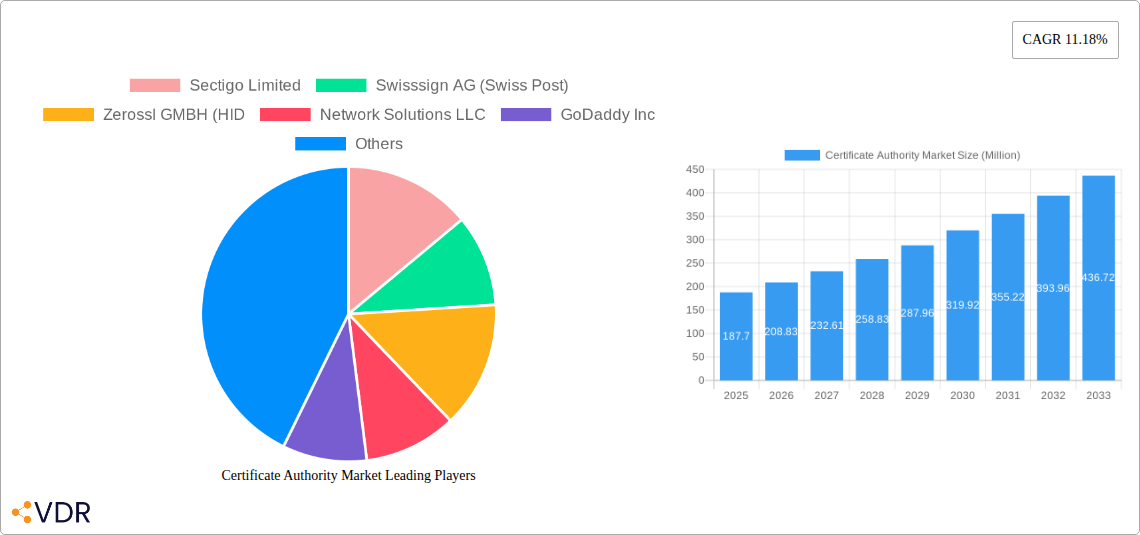
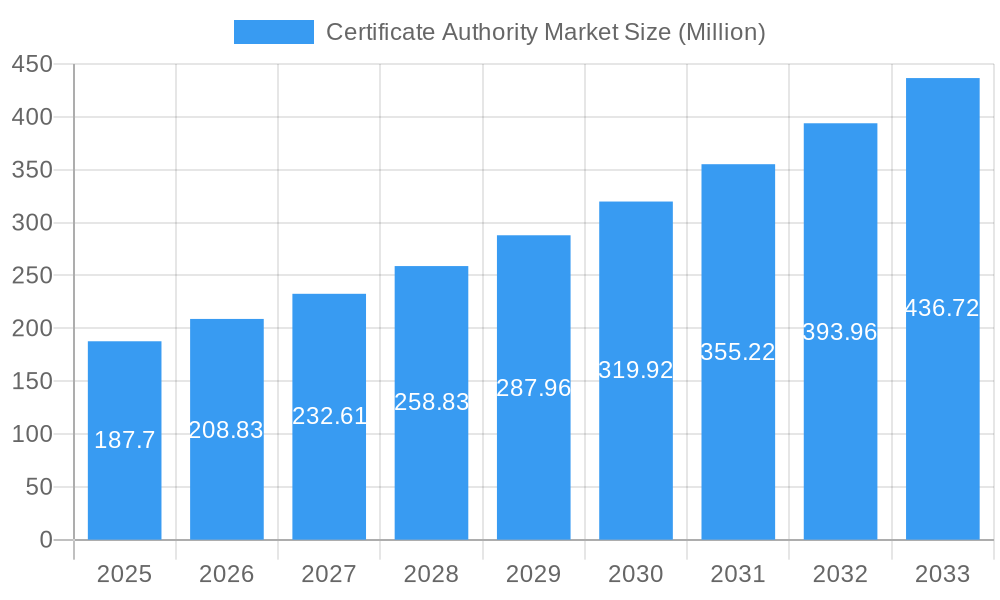
The Certificate Authority (CA) market is experiencing robust growth, projected to reach \$187.70 million in 2025 and maintain a Compound Annual Growth Rate (CAGR) of 11.18% from 2025 to 2033. This expansion is driven by the increasing reliance on digital certificates for secure online transactions, data encryption, and identity verification across various sectors. The surging adoption of e-commerce, cloud computing, and the Internet of Things (IoT) fuels the demand for secure digital identities and robust authentication mechanisms, bolstering the CA market's growth trajectory. Furthermore, stringent government regulations concerning data privacy and cybersecurity are compelling businesses to invest heavily in digital certificate solutions, creating a significant opportunity for CA providers. Segmentation analysis reveals that large enterprises dominate the market, followed by small and medium-sized enterprises (SMEs). The BFSI (Banking, Financial Services, and Insurance) sector leads in end-user verticals, with the healthcare and IT & Telecom sectors also showcasing significant demand. The market's competitive landscape includes established players like DigiCert, Sectigo, and GlobalSign, alongside emerging providers offering innovative certificate solutions and services. Geographic distribution indicates North America and Europe as currently dominant regions, but the Asia-Pacific region is poised for substantial growth fueled by increasing digitalization initiatives and expanding internet penetration.
Certificate Authority Market Market Size (In Million)
The market's growth, however, isn't without challenges. Concerns surrounding certificate lifecycle management, the risk of certificate-based attacks, and the complexities of implementing and maintaining robust PKI (Public Key Infrastructure) solutions could act as restraints. To effectively navigate these challenges, CA providers are increasingly focusing on offering comprehensive solutions that include automated certificate management tools, enhanced security protocols, and proactive threat detection capabilities. This includes increased emphasis on user-friendly interfaces and robust customer support to facilitate wider adoption across different business sizes and technical expertise levels. Strategic partnerships and acquisitions are also expected to play a key role in consolidating market share and extending reach to new segments.
Certificate Authority Market Company Market Share
Certificate Authority Market: A Comprehensive Report (2019-2033)
This in-depth report provides a comprehensive analysis of the Certificate Authority market, encompassing market dynamics, growth trends, regional dominance, product landscape, key players, and future outlook. The study period covers 2019-2033, with 2025 as the base and estimated year. The report segments the market by component (Certificate Types, Authentication Certificates, Services), organization size (Large Enterprises, Small and Medium-Sized Enterprises), and end-user vertical (BFSI, Retail, Healthcare, IT and Telecom, Other). The market size is valued in millions of units.
Certificate Authority Market Market Dynamics & Structure
The Certificate Authority (CA) market presents a dynamic and evolving landscape, characterized by a moderately concentrated structure featuring established global leaders and a growing number of specialized providers. The core of market dynamism stems from continuous technological innovation, spurred by the escalating demand for robust digital security and seamless automation across industries. Stringent global regulatory frameworks, such as GDPR and CCPA, play a pivotal role, dictating stringent compliance requirements and profoundly influencing market trajectory and growth. The market is not without its competitive pressures, with the emergence of sophisticated alternative authentication methods and the rise of decentralized identity solutions posing significant challenges to traditional CA models. End-user adoption patterns are shifting; while large enterprises have been early adopters, there's a discernible trend towards widespread adoption by Small and Medium-sized Enterprises (SMEs). Mergers and acquisitions (M&A) have been a notable feature, with approximately [Insert Number] significant deals recorded between 2019 and 2024. These strategic moves are primarily driven by the desire to broaden product portfolios, enhance technological capabilities, and expand geographical footprints. Projections indicate that the collective market share of the top 5 players will represent approximately 60% of the total market revenue in 2025, highlighting the consolidated nature of the leading segment.
- Market Concentration: Moderately concentrated, with the top 5 players collectively holding an estimated 60% market share in 2025.
- Technological Innovation: Primarily driven by the imperative for advanced automation, fortified security protocols (including advancements in quantum-resistant cryptography), and the specialized security needs of the Internet of Things (IoT).
- Regulatory Frameworks: The market's growth and operational scope are heavily shaped by stringent data privacy and security regulations like GDPR and CCPA, mandating robust compliance measures.
- Competitive Substitutes: Emerging alternative authentication solutions and the increasing prominence of decentralized identity frameworks introduce competitive pressure and necessitate adaptation by traditional CAs.
- M&A Trends: A consistent level of M&A activity is observed, with transactions predominantly focused on portfolio expansion, diversification of service offerings, and market penetration (approximately [Insert Number] deals from 2019-2024).
- Innovation Barriers: Significant challenges to innovation include high upfront investment costs, complexities in integrating new technologies with existing infrastructure, and the requirement for highly specialized technical expertise.
Certificate Authority Market Growth Trends & Insights
The Certificate Authority market experienced robust growth during the historical period (2019-2024), driven by the rising adoption of digital technologies, increased cybersecurity threats, and stringent regulatory compliance requirements. The market size grew from xx million in 2019 to xx million in 2024, registering a CAGR of xx%. This growth is expected to continue during the forecast period (2025-2033), albeit at a slightly moderated pace, with a projected CAGR of xx%, reaching xx million by 2033. Technological disruptions, including the rise of cloud-based solutions and the adoption of automation tools, are reshaping market dynamics. Consumer behavior shifts towards increased digital interactions and e-commerce further fuel market growth. Market penetration amongst SMEs is expected to grow significantly, contributing to overall market expansion.
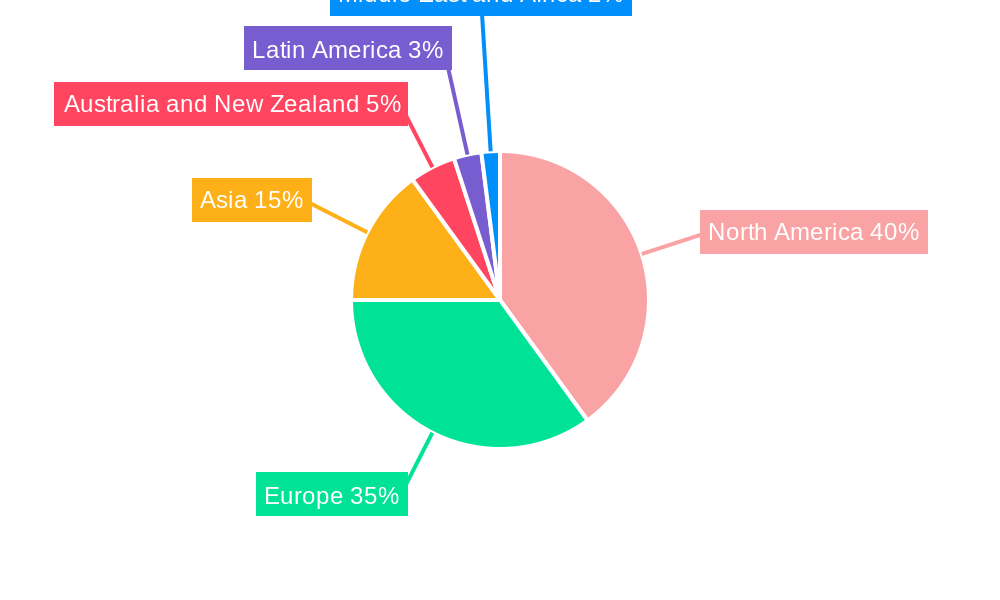
Dominant Regions, Countries, or Segments in Certificate Authority Market
North America currently holds the largest market share in the Certificate Authority market, driven by early adoption of digital technologies and a strong regulatory environment. However, the Asia-Pacific region is expected to exhibit the highest growth rate during the forecast period, fueled by rapid digitalization and increasing internet penetration. Within segments, the Large Enterprises segment dominates, owing to their higher security budgets and greater need for robust certificate management. However, the Small and Medium-Sized Enterprises (SMEs) segment is poised for significant growth, driven by increasing awareness of cyber risks and affordability of CA solutions. The BFSI (Banking, Financial Services, and Insurance) and IT and Telecom verticals are key end-user sectors, due to their heightened security needs.
- Leading Region: North America (Market share: xx% in 2025)
- Fastest-Growing Region: Asia-Pacific (CAGR: xx% during 2025-2033)
- Dominant Segment (By Organization Size): Large Enterprises (Market share: xx% in 2025)
- High-Growth Segment (By Organization Size): SMEs (CAGR: xx% during 2025-2033)
- Key End-User Verticals: BFSI and IT & Telecom
Certificate Authority Market Product Landscape
The Certificate Authority market offers a wide range of products, including various certificate types (e.g., SSL/TLS, code signing, email security), authentication services (e.g., multi-factor authentication, digital signatures), and managed certificate lifecycle solutions. Recent innovations include automation tools, cloud-based certificate management platforms, and solutions tailored for specific industries. These solutions incorporate advanced security features like enhanced validation and automated revocation management to improve security posture and streamline processes. The unique selling propositions often focus on ease of use, cost-effectiveness, and scalability, catering to different customer needs and technical expertise.
Key Drivers, Barriers & Challenges in Certificate Authority Market
Key Drivers:
- The escalating prevalence of sophisticated cyber threats and frequent data breaches are compelling organizations to invest in more robust security measures, thereby fueling the demand for trusted Certificate Authorities.
- Stringent data privacy regulations and evolving compliance mandates globally necessitate the implementation of secure digital identities and encrypted transactions, directly benefiting CA services.
- The continuous expansion of e-commerce, online services, and digital communication channels inherently requires secure online interactions and data integrity, driving the adoption of digital certificates.
- The increasing adoption of cloud computing and the proliferation of IoT devices create a growing need for scalable and secure certificate management solutions.
Key Challenges:
- The competitive threat posed by alternative authentication methods, coupled with the nascent but growing influence of decentralized identity solutions, can limit the traditional market expansion of CAs.
- High implementation and ongoing maintenance costs, along with the inherent complexity of integrating CA solutions, can present significant adoption barriers, particularly for Small and Medium-sized Enterprises (SMEs).
- Maintaining the unwavering trust and security of digital certificates in an environment of constantly evolving threats and increasingly sophisticated attack vectors remains a critical and ongoing challenge for all CAs.
- Ensuring interoperability and standardization across diverse platforms and ecosystems can be a complex undertaking for CA providers.
Emerging Opportunities in Certificate Authority Market
- The increasing adoption of IoT devices and cloud computing creates demand for secure identity management and authentication solutions.
- The rise of blockchain technology and decentralized identity platforms offers opportunities for innovative certificate management solutions.
- Untapped markets in emerging economies present potential for growth as digitalization accelerates.
Growth Accelerators in the Certificate Authority Market Industry
The long-term growth trajectory of the Certificate Authority market is significantly propelled by several strategic factors. Continuous technological advancements, such as the development of more efficient and secure cryptographic algorithms, are foundational. Furthermore, strategic partnerships and collaborations between CA providers and leading cybersecurity firms are expanding the reach and effectiveness of their offerings. Expansion into emerging markets, particularly in developing regions where digital transformation is accelerating, presents substantial growth opportunities. The increasing integration of CAs into broader, holistic security ecosystems, focusing on comprehensive risk management strategies, further solidifies their market position. The development and deployment of innovative solutions tailored to specific industry verticals (e.g., healthcare, finance, automotive) and the widespread adoption of automation technologies for certificate lifecycle management are creating significant positive momentum and unlocking new avenues for market expansion.
Key Players Shaping the Certificate Authority Market Market
- Sectigo Limited
- Swisssign AG (Swiss Post)
- ZeroSSL GMBH
- HID Global
- Network Solutions LLC
- GoDaddy Inc
- Trustwave Holdings Inc (Chertoff Group)
- GlobalSign
- Actalis S p A
- Camerfirma SA
- WISeKey International Holdings Ltd
- DigiCert Inc
- OneSpan Inc
- Asseco Data Systems SA (Asseco Poland SA)
- Buypass AS
- Entrust Corporation
- SSL Com
Notable Milestones in Certificate Authority Market Sector
- February 2024: GlobalSign, Inc. enhanced its Kubernetes security offering with the launch of a dedicated cert-manager issuer, streamlining certificate issuance and management within Kubernetes environments.
- January 2024: Aquion announced a strategic partnership with Trustwave, aiming to bolster cybersecurity solutions and expand their reach across the Australian and New Zealand markets.
- December 2023: DigiCert Inc. unveiled new advanced encryption solutions designed to address emerging threats, including those related to quantum computing.
- November 2023: Sectigo Limited introduced an automated certificate management platform to assist organizations in navigating the complexities of IoT security and device identity.
In-Depth Certificate Authority Market Market Outlook
The Certificate Authority market is poised for continued growth, driven by the increasing reliance on digital technologies and escalating cybersecurity concerns. Strategic partnerships, technological advancements, and expansion into new markets will continue to shape industry dynamics. The market’s future hinges on its ability to adapt to evolving threat landscapes and deliver innovative solutions that address the unique security challenges posed by the expanding digital ecosystem. The potential for growth within the SME segment and emerging markets remains significant, presenting substantial opportunities for established players and new entrants alike.
Certificate Authority Market Segmentation
-
1. Component
-
1.1. Certificate Types
- 1.1.1. SSL Certificates
- 1.1.2. Code Signing Certificates
- 1.1.3. Secure Email Certificates
- 1.1.4. Authentication Certificates
- 1.2. Services
-
1.1. Certificate Types
-
2. Organization Size
- 2.1. Large Enterprises
- 2.2. Small and Medium-Sized Enterprises
-
3. End-user Vertical
- 3.1. BFSI
- 3.2. Retail
- 3.3. Healthcare
- 3.4. IT and Telecom
- 3.5. Other End-user Verticals
Certificate Authority Market Segmentation By Geography
- 1. North America
- 2. Europe
- 3. Asia
- 4. Australia and New Zealand
- 5. Latin America
- 6. Middle East and Africa
Certificate Authority Market Regional Market Share
Geographic Coverage of Certificate Authority Market
Certificate Authority Market REPORT HIGHLIGHTS
| Aspects | Details |
|---|---|
| Study Period | 2020-2034 |
| Base Year | 2025 |
| Estimated Year | 2026 |
| Forecast Period | 2026-2034 |
| Historical Period | 2020-2025 |
| Growth Rate | CAGR of 11.18% from 2020-2034 |
| Segmentation |
|
Table of Contents
- 1. Introduction
- 1.1. Research Scope
- 1.2. Market Segmentation
- 1.3. Research Objective
- 1.4. Definitions and Assumptions
- 2. Executive Summary
- 2.1. Market Snapshot
- 3. Market Dynamics
- 3.1. Market Drivers
- 3.2. Market Restrains
- 3.3. Market Trends
- 3.4. Market Opportunities
- 4. Market Factor Analysis
- 4.1. Porters Five Forces
- 4.1.1. Bargaining Power of Suppliers
- 4.1.2. Bargaining Power of Buyers
- 4.1.3. Threat of New Entrants
- 4.1.4. Threat of Substitutes
- 4.1.5. Competitive Rivalry
- 4.2. PESTEL analysis
- 4.3. BCG Analysis
- 4.3.1. Stars (High Growth, High Market Share)
- 4.3.2. Cash Cows (Low Growth, High Market Share)
- 4.3.3. Question Mark (High Growth, Low Market Share)
- 4.3.4. Dogs (Low Growth, Low Market Share)
- 4.4. Ansoff Matrix Analysis
- 4.5. Supply Chain Analysis
- 4.6. Regulatory Landscape
- 4.7. Current Market Potential and Opportunity Assessment (TAM–SAM–SOM Framework)
- 4.8. VDR Analyst Note
- 4.1. Porters Five Forces
- 5. Market Analysis, Insights and Forecast 2021-2033
- 5.1. Market Analysis, Insights and Forecast - by Component
- 5.1.1. Certificate Types
- 5.1.1.1. SSL Certificates
- 5.1.1.2. Code Signing Certificates
- 5.1.1.3. Secure Email Certificates
- 5.1.1.4. Authentication Certificates
- 5.1.2. Services
- 5.1.1. Certificate Types
- 5.2. Market Analysis, Insights and Forecast - by Organization Size
- 5.2.1. Large Enterprises
- 5.2.2. Small and Medium-Sized Enterprises
- 5.3. Market Analysis, Insights and Forecast - by End-user Vertical
- 5.3.1. BFSI
- 5.3.2. Retail
- 5.3.3. Healthcare
- 5.3.4. IT and Telecom
- 5.3.5. Other End-user Verticals
- 5.4. Market Analysis, Insights and Forecast - by Region
- 5.4.1. North America
- 5.4.2. Europe
- 5.4.3. Asia
- 5.4.4. Australia and New Zealand
- 5.4.5. Latin America
- 5.4.6. Middle East and Africa
- 5.1. Market Analysis, Insights and Forecast - by Component
- 6. Global Certificate Authority Market Analysis, Insights and Forecast, 2021-2033
- 6.1. Market Analysis, Insights and Forecast - by Component
- 6.1.1. Certificate Types
- 6.1.1.1. SSL Certificates
- 6.1.1.2. Code Signing Certificates
- 6.1.1.3. Secure Email Certificates
- 6.1.1.4. Authentication Certificates
- 6.1.2. Services
- 6.1.1. Certificate Types
- 6.2. Market Analysis, Insights and Forecast - by Organization Size
- 6.2.1. Large Enterprises
- 6.2.2. Small and Medium-Sized Enterprises
- 6.3. Market Analysis, Insights and Forecast - by End-user Vertical
- 6.3.1. BFSI
- 6.3.2. Retail
- 6.3.3. Healthcare
- 6.3.4. IT and Telecom
- 6.3.5. Other End-user Verticals
- 6.1. Market Analysis, Insights and Forecast - by Component
- 7. North America Certificate Authority Market Analysis, Insights and Forecast, 2021-2033
- 7.1. Market Analysis, Insights and Forecast - by Component
- 7.1.1. Certificate Types
- 7.1.1.1. SSL Certificates
- 7.1.1.2. Code Signing Certificates
- 7.1.1.3. Secure Email Certificates
- 7.1.1.4. Authentication Certificates
- 7.1.2. Services
- 7.1.1. Certificate Types
- 7.2. Market Analysis, Insights and Forecast - by Organization Size
- 7.2.1. Large Enterprises
- 7.2.2. Small and Medium-Sized Enterprises
- 7.3. Market Analysis, Insights and Forecast - by End-user Vertical
- 7.3.1. BFSI
- 7.3.2. Retail
- 7.3.3. Healthcare
- 7.3.4. IT and Telecom
- 7.3.5. Other End-user Verticals
- 7.1. Market Analysis, Insights and Forecast - by Component
- 8. Europe Certificate Authority Market Analysis, Insights and Forecast, 2021-2033
- 8.1. Market Analysis, Insights and Forecast - by Component
- 8.1.1. Certificate Types
- 8.1.1.1. SSL Certificates
- 8.1.1.2. Code Signing Certificates
- 8.1.1.3. Secure Email Certificates
- 8.1.1.4. Authentication Certificates
- 8.1.2. Services
- 8.1.1. Certificate Types
- 8.2. Market Analysis, Insights and Forecast - by Organization Size
- 8.2.1. Large Enterprises
- 8.2.2. Small and Medium-Sized Enterprises
- 8.3. Market Analysis, Insights and Forecast - by End-user Vertical
- 8.3.1. BFSI
- 8.3.2. Retail
- 8.3.3. Healthcare
- 8.3.4. IT and Telecom
- 8.3.5. Other End-user Verticals
- 8.1. Market Analysis, Insights and Forecast - by Component
- 9. Asia Certificate Authority Market Analysis, Insights and Forecast, 2021-2033
- 9.1. Market Analysis, Insights and Forecast - by Component
- 9.1.1. Certificate Types
- 9.1.1.1. SSL Certificates
- 9.1.1.2. Code Signing Certificates
- 9.1.1.3. Secure Email Certificates
- 9.1.1.4. Authentication Certificates
- 9.1.2. Services
- 9.1.1. Certificate Types
- 9.2. Market Analysis, Insights and Forecast - by Organization Size
- 9.2.1. Large Enterprises
- 9.2.2. Small and Medium-Sized Enterprises
- 9.3. Market Analysis, Insights and Forecast - by End-user Vertical
- 9.3.1. BFSI
- 9.3.2. Retail
- 9.3.3. Healthcare
- 9.3.4. IT and Telecom
- 9.3.5. Other End-user Verticals
- 9.1. Market Analysis, Insights and Forecast - by Component
- 10. Australia and New Zealand Certificate Authority Market Analysis, Insights and Forecast, 2021-2033
- 10.1. Market Analysis, Insights and Forecast - by Component
- 10.1.1. Certificate Types
- 10.1.1.1. SSL Certificates
- 10.1.1.2. Code Signing Certificates
- 10.1.1.3. Secure Email Certificates
- 10.1.1.4. Authentication Certificates
- 10.1.2. Services
- 10.1.1. Certificate Types
- 10.2. Market Analysis, Insights and Forecast - by Organization Size
- 10.2.1. Large Enterprises
- 10.2.2. Small and Medium-Sized Enterprises
- 10.3. Market Analysis, Insights and Forecast - by End-user Vertical
- 10.3.1. BFSI
- 10.3.2. Retail
- 10.3.3. Healthcare
- 10.3.4. IT and Telecom
- 10.3.5. Other End-user Verticals
- 10.1. Market Analysis, Insights and Forecast - by Component
- 11. Latin America Certificate Authority Market Analysis, Insights and Forecast, 2021-2033
- 11.1. Market Analysis, Insights and Forecast - by Component
- 11.1.1. Certificate Types
- 11.1.1.1. SSL Certificates
- 11.1.1.2. Code Signing Certificates
- 11.1.1.3. Secure Email Certificates
- 11.1.1.4. Authentication Certificates
- 11.1.2. Services
- 11.1.1. Certificate Types
- 11.2. Market Analysis, Insights and Forecast - by Organization Size
- 11.2.1. Large Enterprises
- 11.2.2. Small and Medium-Sized Enterprises
- 11.3. Market Analysis, Insights and Forecast - by End-user Vertical
- 11.3.1. BFSI
- 11.3.2. Retail
- 11.3.3. Healthcare
- 11.3.4. IT and Telecom
- 11.3.5. Other End-user Verticals
- 11.1. Market Analysis, Insights and Forecast - by Component
- 12. Middle East and Africa Certificate Authority Market Analysis, Insights and Forecast, 2021-2033
- 12.1. Market Analysis, Insights and Forecast - by Component
- 12.1.1. Certificate Types
- 12.1.1.1. SSL Certificates
- 12.1.1.2. Code Signing Certificates
- 12.1.1.3. Secure Email Certificates
- 12.1.1.4. Authentication Certificates
- 12.1.2. Services
- 12.1.1. Certificate Types
- 12.2. Market Analysis, Insights and Forecast - by Organization Size
- 12.2.1. Large Enterprises
- 12.2.2. Small and Medium-Sized Enterprises
- 12.3. Market Analysis, Insights and Forecast - by End-user Vertical
- 12.3.1. BFSI
- 12.3.2. Retail
- 12.3.3. Healthcare
- 12.3.4. IT and Telecom
- 12.3.5. Other End-user Verticals
- 12.1. Market Analysis, Insights and Forecast - by Component
- 13. Competitive Analysis
- 13.1. Company Profiles
- 13.1.1 Sectigo Limited
- 13.1.1.1. Company Overview
- 13.1.1.2. Products
- 13.1.1.3. Company Financials
- 13.1.1.4. SWOT Analysis
- 13.1.2 Swisssign AG (Swiss Post)
- 13.1.2.1. Company Overview
- 13.1.2.2. Products
- 13.1.2.3. Company Financials
- 13.1.2.4. SWOT Analysis
- 13.1.3 Zerossl GMBH (HID
- 13.1.3.1. Company Overview
- 13.1.3.2. Products
- 13.1.3.3. Company Financials
- 13.1.3.4. SWOT Analysis
- 13.1.4 Network Solutions LLC
- 13.1.4.1. Company Overview
- 13.1.4.2. Products
- 13.1.4.3. Company Financials
- 13.1.4.4. SWOT Analysis
- 13.1.5 GoDaddy Inc
- 13.1.5.1. Company Overview
- 13.1.5.2. Products
- 13.1.5.3. Company Financials
- 13.1.5.4. SWOT Analysis
- 13.1.6 Trustwave Holdings Inc (Chertoff Group)
- 13.1.6.1. Company Overview
- 13.1.6.2. Products
- 13.1.6.3. Company Financials
- 13.1.6.4. SWOT Analysis
- 13.1.7 GlobalSign
- 13.1.7.1. Company Overview
- 13.1.7.2. Products
- 13.1.7.3. Company Financials
- 13.1.7.4. SWOT Analysis
- 13.1.8 Actalis S p A
- 13.1.8.1. Company Overview
- 13.1.8.2. Products
- 13.1.8.3. Company Financials
- 13.1.8.4. SWOT Analysis
- 13.1.9 Camerfirma SA
- 13.1.9.1. Company Overview
- 13.1.9.2. Products
- 13.1.9.3. Company Financials
- 13.1.9.4. SWOT Analysis
- 13.1.10 WISeKey International Holdings Ltd
- 13.1.10.1. Company Overview
- 13.1.10.2. Products
- 13.1.10.3. Company Financials
- 13.1.10.4. SWOT Analysis
- 13.1.11 DigiCert Inc
- 13.1.11.1. Company Overview
- 13.1.11.2. Products
- 13.1.11.3. Company Financials
- 13.1.11.4. SWOT Analysis
- 13.1.12 OneSpan Inc
- 13.1.12.1. Company Overview
- 13.1.12.2. Products
- 13.1.12.3. Company Financials
- 13.1.12.4. SWOT Analysis
- 13.1.13 Asseco Data Systems SA (Asseco Poland SA)
- 13.1.13.1. Company Overview
- 13.1.13.2. Products
- 13.1.13.3. Company Financials
- 13.1.13.4. SWOT Analysis
- 13.1.14 Buypass AS
- 13.1.14.1. Company Overview
- 13.1.14.2. Products
- 13.1.14.3. Company Financials
- 13.1.14.4. SWOT Analysis
- 13.1.15 Entrust Corporation
- 13.1.15.1. Company Overview
- 13.1.15.2. Products
- 13.1.15.3. Company Financials
- 13.1.15.4. SWOT Analysis
- 13.1.16 SSL Com
- 13.1.16.1. Company Overview
- 13.1.16.2. Products
- 13.1.16.3. Company Financials
- 13.1.16.4. SWOT Analysis
- 13.1.1 Sectigo Limited
- 13.2. Market Entropy
- 13.2.1 Company's Key Areas Served
- 13.2.2 Recent Developments
- 13.3. Company Market Share Analysis 2025
- 13.3.1 Top 5 Companies Market Share Analysis
- 13.3.2 Top 3 Companies Market Share Analysis
- 13.4. List of Potential Customers
- 14. Research Methodology
List of Figures
- Figure 1: Global Certificate Authority Market Revenue Breakdown (Million, %) by Region 2025 & 2033
- Figure 2: Global Certificate Authority Market Volume Breakdown (K Unit, %) by Region 2025 & 2033
- Figure 3: North America Certificate Authority Market Revenue (Million), by Component 2025 & 2033
- Figure 4: North America Certificate Authority Market Volume (K Unit), by Component 2025 & 2033
- Figure 5: North America Certificate Authority Market Revenue Share (%), by Component 2025 & 2033
- Figure 6: North America Certificate Authority Market Volume Share (%), by Component 2025 & 2033
- Figure 7: North America Certificate Authority Market Revenue (Million), by Organization Size 2025 & 2033
- Figure 8: North America Certificate Authority Market Volume (K Unit), by Organization Size 2025 & 2033
- Figure 9: North America Certificate Authority Market Revenue Share (%), by Organization Size 2025 & 2033
- Figure 10: North America Certificate Authority Market Volume Share (%), by Organization Size 2025 & 2033
- Figure 11: North America Certificate Authority Market Revenue (Million), by End-user Vertical 2025 & 2033
- Figure 12: North America Certificate Authority Market Volume (K Unit), by End-user Vertical 2025 & 2033
- Figure 13: North America Certificate Authority Market Revenue Share (%), by End-user Vertical 2025 & 2033
- Figure 14: North America Certificate Authority Market Volume Share (%), by End-user Vertical 2025 & 2033
- Figure 15: North America Certificate Authority Market Revenue (Million), by Country 2025 & 2033
- Figure 16: North America Certificate Authority Market Volume (K Unit), by Country 2025 & 2033
- Figure 17: North America Certificate Authority Market Revenue Share (%), by Country 2025 & 2033
- Figure 18: North America Certificate Authority Market Volume Share (%), by Country 2025 & 2033
- Figure 19: Europe Certificate Authority Market Revenue (Million), by Component 2025 & 2033
- Figure 20: Europe Certificate Authority Market Volume (K Unit), by Component 2025 & 2033
- Figure 21: Europe Certificate Authority Market Revenue Share (%), by Component 2025 & 2033
- Figure 22: Europe Certificate Authority Market Volume Share (%), by Component 2025 & 2033
- Figure 23: Europe Certificate Authority Market Revenue (Million), by Organization Size 2025 & 2033
- Figure 24: Europe Certificate Authority Market Volume (K Unit), by Organization Size 2025 & 2033
- Figure 25: Europe Certificate Authority Market Revenue Share (%), by Organization Size 2025 & 2033
- Figure 26: Europe Certificate Authority Market Volume Share (%), by Organization Size 2025 & 2033
- Figure 27: Europe Certificate Authority Market Revenue (Million), by End-user Vertical 2025 & 2033
- Figure 28: Europe Certificate Authority Market Volume (K Unit), by End-user Vertical 2025 & 2033
- Figure 29: Europe Certificate Authority Market Revenue Share (%), by End-user Vertical 2025 & 2033
- Figure 30: Europe Certificate Authority Market Volume Share (%), by End-user Vertical 2025 & 2033
- Figure 31: Europe Certificate Authority Market Revenue (Million), by Country 2025 & 2033
- Figure 32: Europe Certificate Authority Market Volume (K Unit), by Country 2025 & 2033
- Figure 33: Europe Certificate Authority Market Revenue Share (%), by Country 2025 & 2033
- Figure 34: Europe Certificate Authority Market Volume Share (%), by Country 2025 & 2033
- Figure 35: Asia Certificate Authority Market Revenue (Million), by Component 2025 & 2033
- Figure 36: Asia Certificate Authority Market Volume (K Unit), by Component 2025 & 2033
- Figure 37: Asia Certificate Authority Market Revenue Share (%), by Component 2025 & 2033
- Figure 38: Asia Certificate Authority Market Volume Share (%), by Component 2025 & 2033
- Figure 39: Asia Certificate Authority Market Revenue (Million), by Organization Size 2025 & 2033
- Figure 40: Asia Certificate Authority Market Volume (K Unit), by Organization Size 2025 & 2033
- Figure 41: Asia Certificate Authority Market Revenue Share (%), by Organization Size 2025 & 2033
- Figure 42: Asia Certificate Authority Market Volume Share (%), by Organization Size 2025 & 2033
- Figure 43: Asia Certificate Authority Market Revenue (Million), by End-user Vertical 2025 & 2033
- Figure 44: Asia Certificate Authority Market Volume (K Unit), by End-user Vertical 2025 & 2033
- Figure 45: Asia Certificate Authority Market Revenue Share (%), by End-user Vertical 2025 & 2033
- Figure 46: Asia Certificate Authority Market Volume Share (%), by End-user Vertical 2025 & 2033
- Figure 47: Asia Certificate Authority Market Revenue (Million), by Country 2025 & 2033
- Figure 48: Asia Certificate Authority Market Volume (K Unit), by Country 2025 & 2033
- Figure 49: Asia Certificate Authority Market Revenue Share (%), by Country 2025 & 2033
- Figure 50: Asia Certificate Authority Market Volume Share (%), by Country 2025 & 2033
- Figure 51: Australia and New Zealand Certificate Authority Market Revenue (Million), by Component 2025 & 2033
- Figure 52: Australia and New Zealand Certificate Authority Market Volume (K Unit), by Component 2025 & 2033
- Figure 53: Australia and New Zealand Certificate Authority Market Revenue Share (%), by Component 2025 & 2033
- Figure 54: Australia and New Zealand Certificate Authority Market Volume Share (%), by Component 2025 & 2033
- Figure 55: Australia and New Zealand Certificate Authority Market Revenue (Million), by Organization Size 2025 & 2033
- Figure 56: Australia and New Zealand Certificate Authority Market Volume (K Unit), by Organization Size 2025 & 2033
- Figure 57: Australia and New Zealand Certificate Authority Market Revenue Share (%), by Organization Size 2025 & 2033
- Figure 58: Australia and New Zealand Certificate Authority Market Volume Share (%), by Organization Size 2025 & 2033
- Figure 59: Australia and New Zealand Certificate Authority Market Revenue (Million), by End-user Vertical 2025 & 2033
- Figure 60: Australia and New Zealand Certificate Authority Market Volume (K Unit), by End-user Vertical 2025 & 2033
- Figure 61: Australia and New Zealand Certificate Authority Market Revenue Share (%), by End-user Vertical 2025 & 2033
- Figure 62: Australia and New Zealand Certificate Authority Market Volume Share (%), by End-user Vertical 2025 & 2033
- Figure 63: Australia and New Zealand Certificate Authority Market Revenue (Million), by Country 2025 & 2033
- Figure 64: Australia and New Zealand Certificate Authority Market Volume (K Unit), by Country 2025 & 2033
- Figure 65: Australia and New Zealand Certificate Authority Market Revenue Share (%), by Country 2025 & 2033
- Figure 66: Australia and New Zealand Certificate Authority Market Volume Share (%), by Country 2025 & 2033
- Figure 67: Latin America Certificate Authority Market Revenue (Million), by Component 2025 & 2033
- Figure 68: Latin America Certificate Authority Market Volume (K Unit), by Component 2025 & 2033
- Figure 69: Latin America Certificate Authority Market Revenue Share (%), by Component 2025 & 2033
- Figure 70: Latin America Certificate Authority Market Volume Share (%), by Component 2025 & 2033
- Figure 71: Latin America Certificate Authority Market Revenue (Million), by Organization Size 2025 & 2033
- Figure 72: Latin America Certificate Authority Market Volume (K Unit), by Organization Size 2025 & 2033
- Figure 73: Latin America Certificate Authority Market Revenue Share (%), by Organization Size 2025 & 2033
- Figure 74: Latin America Certificate Authority Market Volume Share (%), by Organization Size 2025 & 2033
- Figure 75: Latin America Certificate Authority Market Revenue (Million), by End-user Vertical 2025 & 2033
- Figure 76: Latin America Certificate Authority Market Volume (K Unit), by End-user Vertical 2025 & 2033
- Figure 77: Latin America Certificate Authority Market Revenue Share (%), by End-user Vertical 2025 & 2033
- Figure 78: Latin America Certificate Authority Market Volume Share (%), by End-user Vertical 2025 & 2033
- Figure 79: Latin America Certificate Authority Market Revenue (Million), by Country 2025 & 2033
- Figure 80: Latin America Certificate Authority Market Volume (K Unit), by Country 2025 & 2033
- Figure 81: Latin America Certificate Authority Market Revenue Share (%), by Country 2025 & 2033
- Figure 82: Latin America Certificate Authority Market Volume Share (%), by Country 2025 & 2033
- Figure 83: Middle East and Africa Certificate Authority Market Revenue (Million), by Component 2025 & 2033
- Figure 84: Middle East and Africa Certificate Authority Market Volume (K Unit), by Component 2025 & 2033
- Figure 85: Middle East and Africa Certificate Authority Market Revenue Share (%), by Component 2025 & 2033
- Figure 86: Middle East and Africa Certificate Authority Market Volume Share (%), by Component 2025 & 2033
- Figure 87: Middle East and Africa Certificate Authority Market Revenue (Million), by Organization Size 2025 & 2033
- Figure 88: Middle East and Africa Certificate Authority Market Volume (K Unit), by Organization Size 2025 & 2033
- Figure 89: Middle East and Africa Certificate Authority Market Revenue Share (%), by Organization Size 2025 & 2033
- Figure 90: Middle East and Africa Certificate Authority Market Volume Share (%), by Organization Size 2025 & 2033
- Figure 91: Middle East and Africa Certificate Authority Market Revenue (Million), by End-user Vertical 2025 & 2033
- Figure 92: Middle East and Africa Certificate Authority Market Volume (K Unit), by End-user Vertical 2025 & 2033
- Figure 93: Middle East and Africa Certificate Authority Market Revenue Share (%), by End-user Vertical 2025 & 2033
- Figure 94: Middle East and Africa Certificate Authority Market Volume Share (%), by End-user Vertical 2025 & 2033
- Figure 95: Middle East and Africa Certificate Authority Market Revenue (Million), by Country 2025 & 2033
- Figure 96: Middle East and Africa Certificate Authority Market Volume (K Unit), by Country 2025 & 2033
- Figure 97: Middle East and Africa Certificate Authority Market Revenue Share (%), by Country 2025 & 2033
- Figure 98: Middle East and Africa Certificate Authority Market Volume Share (%), by Country 2025 & 2033
List of Tables
- Table 1: Global Certificate Authority Market Revenue Million Forecast, by Component 2020 & 2033
- Table 2: Global Certificate Authority Market Volume K Unit Forecast, by Component 2020 & 2033
- Table 3: Global Certificate Authority Market Revenue Million Forecast, by Organization Size 2020 & 2033
- Table 4: Global Certificate Authority Market Volume K Unit Forecast, by Organization Size 2020 & 2033
- Table 5: Global Certificate Authority Market Revenue Million Forecast, by End-user Vertical 2020 & 2033
- Table 6: Global Certificate Authority Market Volume K Unit Forecast, by End-user Vertical 2020 & 2033
- Table 7: Global Certificate Authority Market Revenue Million Forecast, by Region 2020 & 2033
- Table 8: Global Certificate Authority Market Volume K Unit Forecast, by Region 2020 & 2033
- Table 9: Global Certificate Authority Market Revenue Million Forecast, by Component 2020 & 2033
- Table 10: Global Certificate Authority Market Volume K Unit Forecast, by Component 2020 & 2033
- Table 11: Global Certificate Authority Market Revenue Million Forecast, by Organization Size 2020 & 2033
- Table 12: Global Certificate Authority Market Volume K Unit Forecast, by Organization Size 2020 & 2033
- Table 13: Global Certificate Authority Market Revenue Million Forecast, by End-user Vertical 2020 & 2033
- Table 14: Global Certificate Authority Market Volume K Unit Forecast, by End-user Vertical 2020 & 2033
- Table 15: Global Certificate Authority Market Revenue Million Forecast, by Country 2020 & 2033
- Table 16: Global Certificate Authority Market Volume K Unit Forecast, by Country 2020 & 2033
- Table 17: Global Certificate Authority Market Revenue Million Forecast, by Component 2020 & 2033
- Table 18: Global Certificate Authority Market Volume K Unit Forecast, by Component 2020 & 2033
- Table 19: Global Certificate Authority Market Revenue Million Forecast, by Organization Size 2020 & 2033
- Table 20: Global Certificate Authority Market Volume K Unit Forecast, by Organization Size 2020 & 2033
- Table 21: Global Certificate Authority Market Revenue Million Forecast, by End-user Vertical 2020 & 2033
- Table 22: Global Certificate Authority Market Volume K Unit Forecast, by End-user Vertical 2020 & 2033
- Table 23: Global Certificate Authority Market Revenue Million Forecast, by Country 2020 & 2033
- Table 24: Global Certificate Authority Market Volume K Unit Forecast, by Country 2020 & 2033
- Table 25: Global Certificate Authority Market Revenue Million Forecast, by Component 2020 & 2033
- Table 26: Global Certificate Authority Market Volume K Unit Forecast, by Component 2020 & 2033
- Table 27: Global Certificate Authority Market Revenue Million Forecast, by Organization Size 2020 & 2033
- Table 28: Global Certificate Authority Market Volume K Unit Forecast, by Organization Size 2020 & 2033
- Table 29: Global Certificate Authority Market Revenue Million Forecast, by End-user Vertical 2020 & 2033
- Table 30: Global Certificate Authority Market Volume K Unit Forecast, by End-user Vertical 2020 & 2033
- Table 31: Global Certificate Authority Market Revenue Million Forecast, by Country 2020 & 2033
- Table 32: Global Certificate Authority Market Volume K Unit Forecast, by Country 2020 & 2033
- Table 33: Global Certificate Authority Market Revenue Million Forecast, by Component 2020 & 2033
- Table 34: Global Certificate Authority Market Volume K Unit Forecast, by Component 2020 & 2033
- Table 35: Global Certificate Authority Market Revenue Million Forecast, by Organization Size 2020 & 2033
- Table 36: Global Certificate Authority Market Volume K Unit Forecast, by Organization Size 2020 & 2033
- Table 37: Global Certificate Authority Market Revenue Million Forecast, by End-user Vertical 2020 & 2033
- Table 38: Global Certificate Authority Market Volume K Unit Forecast, by End-user Vertical 2020 & 2033
- Table 39: Global Certificate Authority Market Revenue Million Forecast, by Country 2020 & 2033
- Table 40: Global Certificate Authority Market Volume K Unit Forecast, by Country 2020 & 2033
- Table 41: Global Certificate Authority Market Revenue Million Forecast, by Component 2020 & 2033
- Table 42: Global Certificate Authority Market Volume K Unit Forecast, by Component 2020 & 2033
- Table 43: Global Certificate Authority Market Revenue Million Forecast, by Organization Size 2020 & 2033
- Table 44: Global Certificate Authority Market Volume K Unit Forecast, by Organization Size 2020 & 2033
- Table 45: Global Certificate Authority Market Revenue Million Forecast, by End-user Vertical 2020 & 2033
- Table 46: Global Certificate Authority Market Volume K Unit Forecast, by End-user Vertical 2020 & 2033
- Table 47: Global Certificate Authority Market Revenue Million Forecast, by Country 2020 & 2033
- Table 48: Global Certificate Authority Market Volume K Unit Forecast, by Country 2020 & 2033
- Table 49: Global Certificate Authority Market Revenue Million Forecast, by Component 2020 & 2033
- Table 50: Global Certificate Authority Market Volume K Unit Forecast, by Component 2020 & 2033
- Table 51: Global Certificate Authority Market Revenue Million Forecast, by Organization Size 2020 & 2033
- Table 52: Global Certificate Authority Market Volume K Unit Forecast, by Organization Size 2020 & 2033
- Table 53: Global Certificate Authority Market Revenue Million Forecast, by End-user Vertical 2020 & 2033
- Table 54: Global Certificate Authority Market Volume K Unit Forecast, by End-user Vertical 2020 & 2033
- Table 55: Global Certificate Authority Market Revenue Million Forecast, by Country 2020 & 2033
- Table 56: Global Certificate Authority Market Volume K Unit Forecast, by Country 2020 & 2033
Frequently Asked Questions
1. What is the projected Compound Annual Growth Rate (CAGR) of the Certificate Authority Market?
The projected CAGR is approximately 11.18%.
2. Which companies are prominent players in the Certificate Authority Market?
Key companies in the market include Sectigo Limited, Swisssign AG (Swiss Post), Zerossl GMBH (HID, Network Solutions LLC, GoDaddy Inc, Trustwave Holdings Inc (Chertoff Group), GlobalSign, Actalis S p A, Camerfirma SA, WISeKey International Holdings Ltd, DigiCert Inc, OneSpan Inc, Asseco Data Systems SA (Asseco Poland SA), Buypass AS, Entrust Corporation, SSL Com.
3. What are the main segments of the Certificate Authority Market?
The market segments include Component, Organization Size, End-user Vertical.
4. Can you provide details about the market size?
The market size is estimated to be USD 187.70 Million as of 2022.
5. What are some drivers contributing to market growth?
Growing Awareness Among Internet Users About Secure Web Access; Managing Strict Regulations and Compliance.
6. What are the notable trends driving market growth?
BFSI Sector to be the Largest End-user Industry.
7. Are there any restraints impacting market growth?
Lack of Awareness About the Importance of Security Certificates; Using of Self-Signed Certificates.
8. Can you provide examples of recent developments in the market?
February 2024 - The availability of an issuer for the Kubernetes cert-manager was confirmed by GlobalSign, Inc., a global Certificate Authority providing identity security, digital signature, and Internet of Things solutions. Made from an integration from GMO GlobalSign's certificate management platform, Atlas, the new Issuer enables cert-manager users to quickly obtain trusted TLS (X.509) certificates, improving the security of Kubernetes workflows. With over 5 million daily downloads, the open-source enterprise tool simplifies the certificate issuance and management process in Kubernetes.
9. What pricing options are available for accessing the report?
Pricing options include single-user, multi-user, and enterprise licenses priced at USD 4750, USD 5250, and USD 8750 respectively.
10. Is the market size provided in terms of value or volume?
The market size is provided in terms of value, measured in Million and volume, measured in K Unit.
11. Are there any specific market keywords associated with the report?
Yes, the market keyword associated with the report is "Certificate Authority Market," which aids in identifying and referencing the specific market segment covered.
12. How do I determine which pricing option suits my needs best?
The pricing options vary based on user requirements and access needs. Individual users may opt for single-user licenses, while businesses requiring broader access may choose multi-user or enterprise licenses for cost-effective access to the report.
13. Are there any additional resources or data provided in the Certificate Authority Market report?
While the report offers comprehensive insights, it's advisable to review the specific contents or supplementary materials provided to ascertain if additional resources or data are available.
14. How can I stay updated on further developments or reports in the Certificate Authority Market?
To stay informed about further developments, trends, and reports in the Certificate Authority Market, consider subscribing to industry newsletters, following relevant companies and organizations, or regularly checking reputable industry news sources and publications.
Methodology
Step 1 - Identification of Relevant Samples Size from Population Database


Step 2 - Approaches for Defining Global Market Size (Value, Volume* & Price*)

Note*: In applicable scenarios
Step 3 - Data Sources
Primary Research
- Web Analytics
- Survey Reports
- Research Institute
- Latest Research Reports
- Opinion Leaders
Secondary Research
- Annual Reports
- White Paper
- Latest Press Release
- Industry Association
- Paid Database
- Investor Presentations

Step 4 - Data Triangulation
Involves using different sources of information in order to increase the validity of a study
These sources are likely to be stakeholders in a program - participants, other researchers, program staff, other community members, and so on.
Then we put all data in single framework & apply various statistical tools to find out the dynamic on the market.
During the analysis stage, feedback from the stakeholder groups would be compared to determine areas of agreement as well as areas of divergence