

Key Insights
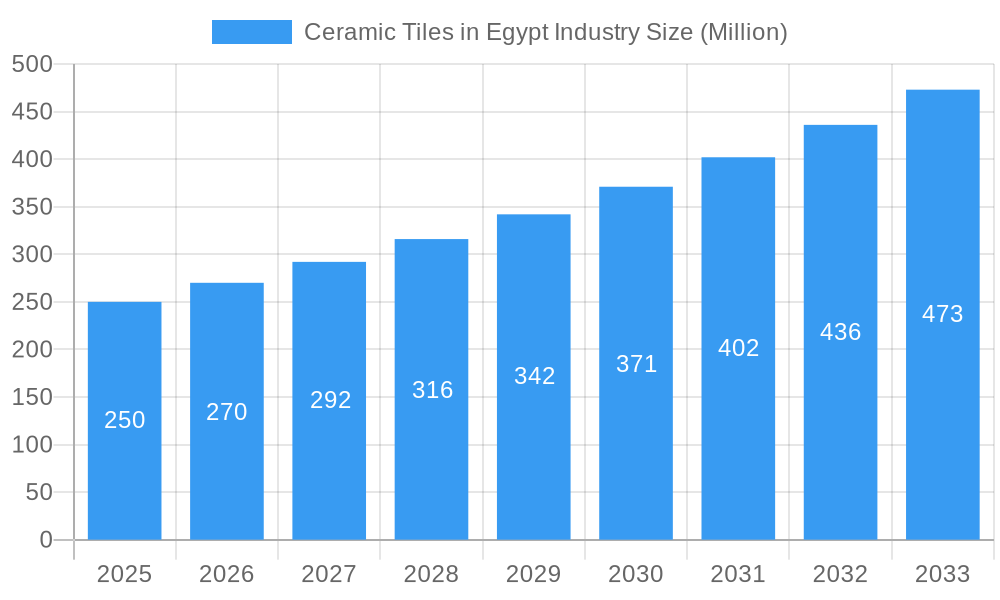
The Egyptian ceramic tile market is projected to reach $1.5 billion by 2024, with a compound annual growth rate (CAGR) of 8.3% from 2024 to 2033. This growth is driven by a robust construction sector, fueled by Egypt's expanding population and rising middle class, leading to increased demand in residential and commercial real estate. Consumers increasingly favor durable, low-maintenance, and aesthetically diverse ceramic tiles, such as glazed and porcelain options, over traditional materials. Government infrastructure development initiatives further support market expansion.
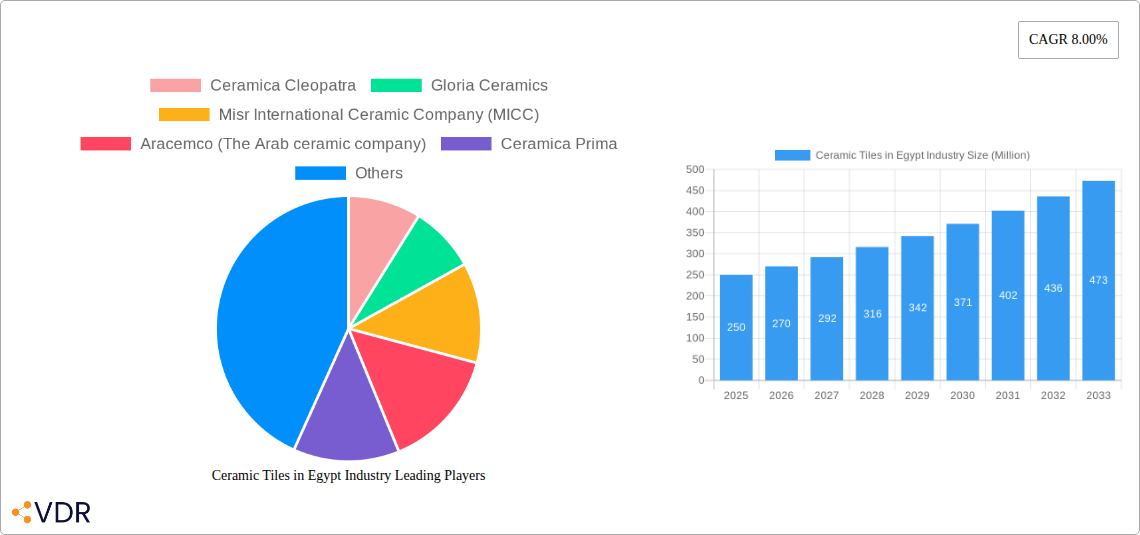
Ceramic Tiles in Egypt Industry Market Size (In Billion)
Challenges include price volatility of raw materials like clay and energy, and competition from lower-cost imported tiles. The market is segmented by product type (glazed, porcelain, scratch-free), application (floor, wall), construction type (new, renovation), and end-user (residential, commercial). Key players, including Ceramica Cleopatra, Gloria Ceramics, and Misr International Ceramic Company (MICC), are actively innovating and strategically positioning themselves to capture market share. Future growth depends on economic stability, sustained construction, and continued demand for high-quality ceramic tiles in all spaces.
Ceramic Tiles in Egypt Industry Company Market Share
Ceramic Tiles in Egypt Industry: A Comprehensive Market Report (2019-2033)
This comprehensive report provides an in-depth analysis of the Ceramic Tiles in Egypt industry, encompassing market dynamics, growth trends, competitive landscape, and future outlook. The report covers the period 2019-2033, with a base year of 2025 and a forecast period of 2025-2033. It segments the market by product type (Glazed, Porcelain, Scratch Free, Other Products), application (Floor Tiles, Wall Tiles, Other Applications), construction type (New Construction, Replacement and Renovation), and end-user (Residential, Commercial). The report utilizes data in million units.
Ceramic Tiles in Egypt Industry Market Dynamics & Structure
The Egyptian ceramic tile market is moderately concentrated, with key players like Ceramica Cleopatra, Gloria Ceramics, and Misr International Ceramic Company (MICC) holding significant market share. Technological innovation, primarily focused on improving durability, aesthetics, and eco-friendliness, is a key driver. Regulatory frameworks related to building codes and environmental standards influence production and consumption. Competitive substitutes include other flooring materials like vinyl and wood, impacting market growth. The end-user demographic is shifting towards younger, more design-conscious consumers, influencing product preferences. M&A activity has been moderate, with a few notable transactions in the past five years (xx deals).
- Market Concentration: Moderately concentrated, with top 5 players holding approximately xx% market share in 2024.
- Technological Innovation: Focus on larger format tiles, digital printing, and sustainable materials.
- Regulatory Framework: Compliance with building codes and environmental regulations impacting production costs.
- Competitive Substitutes: Vinyl, wood, and other flooring materials present competitive pressure.
- End-User Demographics: Growing middle class and shifting consumer preferences towards aesthetics and durability.
- M&A Activity: xx M&A deals recorded between 2019-2024.
Ceramic Tiles in Egypt Industry Growth Trends & Insights
The Egyptian ceramic tile market exhibited a CAGR of xx% during the historical period (2019-2024), reaching a market size of xx million units in 2024. This growth is driven by robust construction activity, particularly in the residential sector, fueled by population growth and urbanization. Adoption of advanced technologies, such as digital printing and improved manufacturing processes, has enhanced product quality and design options, leading to increased demand. Shifting consumer preferences toward premium and specialized tiles further contribute to the market's upward trajectory. The forecast period (2025-2033) projects a CAGR of xx%, driven by sustained infrastructure development and increasing disposable incomes. Market penetration is expected to increase by xx% by 2033. The rising adoption of sustainable and energy-efficient products is also contributing to the growth.
Dominant Regions, Countries, or Segments in Ceramic Tiles in Egypt Industry
The Greater Cairo region dominates the Egyptian ceramic tile market, driven by high population density, robust construction activity, and a strong concentration of key players. Within the product segments, porcelain tiles exhibit the highest growth, fueled by their superior durability and aesthetics. In terms of application, floor tiles hold the largest market share, with strong growth anticipated in wall tiles. New construction accounts for the major portion of demand, with renovation and replacement also contributing significantly. The residential sector remains the dominant end-user segment, with commercial projects showcasing steady growth.
- Key Drivers (Greater Cairo Region): High population density, robust construction activity, and central location of manufacturers.
- Product Segment Dominance: Porcelain tiles – high demand due to durability and aesthetics.
- Application Segment Dominance: Floor tiles – largest market share, with growing demand for wall tiles.
- Construction Type Dominance: New construction – largest market share, complemented by steady growth in renovation.
- End-User Segment Dominance: Residential – largest market share, with strong growth in commercial projects.
Ceramic Tiles in Egypt Industry Product Landscape
The Egyptian ceramic tile market showcases a diverse product range, encompassing glazed, porcelain, scratch-free, and other specialized tiles. Innovation focuses on enhancing durability, aesthetics, and functionality, including larger format tiles, improved surface textures, and digital printing capabilities. Unique selling propositions revolve around design innovation, eco-friendly materials, and high-performance characteristics, providing customers with a wide array of choices to match varied design needs and preferences.
Key Drivers, Barriers & Challenges in Ceramic Tiles in Egypt Industry
Key Drivers: Increased government investment in infrastructure, growing urbanization, rising disposable incomes, and technological advancements improving tile quality and aesthetics.
Challenges: Fluctuations in raw material prices, intense competition, energy costs, and economic instability. Supply chain disruptions also pose a threat, potentially impacting production and delivery schedules, with estimated quantifiable impact on costs at xx% in 2024.
Emerging Opportunities in Ceramic Tiles in Egypt Industry
Untapped markets in smaller cities and rural areas present substantial growth potential. The increasing demand for eco-friendly and sustainable tiles provides an opportunity to develop and market environmentally responsible products. Developing specialized tiles for specific applications, such as swimming pools or industrial settings, also offers significant opportunities.
Growth Accelerators in the Ceramic Tiles in Egypt Industry Industry
Technological breakthroughs in digital printing and manufacturing processes will continue driving product innovation. Strategic partnerships between manufacturers and designers can foster the development of innovative and aesthetically appealing tiles. Expansion into new markets, both domestically and internationally, offers significant growth potential.
Key Players Shaping the Ceramic Tiles in Egypt Industry Market
- Ceramica Cleopatra
- Gloria Ceramics
- Misr International Ceramic Company (MICC)
- Aracemco (The Arab ceramic company)
- Ceramica Prima
- Ceramica Venzia
- Lecico Egypt
- Al-Ezz Ceramics and Porcelain (Gemma)
- Al Amir Ceramics
- Alfa Ceramic
- Royal Ceramica
- Pharaohs Ceramics Group (Ceramica Innova)
Notable Milestones in Ceramic Tiles in Egypt Industry Sector
- 2021-Q3: Launch of a new eco-friendly tile line by Ceramica Cleopatra.
- 2022-Q1: Acquisition of a smaller tile manufacturer by Gloria Ceramics.
- 2023-Q4: Introduction of advanced digital printing technology by MICC. (Specific details pending availability)
In-Depth Ceramic Tiles in Egypt Industry Market Outlook
The Egyptian ceramic tile market is poised for sustained growth, driven by ongoing urbanization, infrastructure development, and rising consumer demand. Strategic investments in technology and innovation, coupled with targeted marketing and expansion strategies, will further propel market growth. The focus on sustainable and eco-friendly products will continue to drive demand. The market’s potential lies in capitalizing on the growing middle class and expanding into new geographic areas.
Ceramic Tiles in Egypt Industry Segmentation
-
1. Product
- 1.1. Glazed
- 1.2. Porcelain
- 1.3. Scratch Free
- 1.4. Other Products
-
2. Application
- 2.1. Floor Tiles
- 2.2. Wall Tiles
- 2.3. Other Applications
-
3. Construction Type
- 3.1. New Construction
- 3.2. Replacement and Renovation
-
4. End User
- 4.1. Residential
- 4.2. Commercial
Ceramic Tiles in Egypt Industry Segmentation By Geography
-
1. North America
- 1.1. United States
- 1.2. Canada
- 1.3. Mexico
-
2. South America
- 2.1. Brazil
- 2.2. Argentina
- 2.3. Rest of South America
-
3. Europe
- 3.1. United Kingdom
- 3.2. Germany
- 3.3. France
- 3.4. Italy
- 3.5. Spain
- 3.6. Russia
- 3.7. Benelux
- 3.8. Nordics
- 3.9. Rest of Europe
-
4. Middle East & Africa
- 4.1. Turkey
- 4.2. Israel
- 4.3. GCC
- 4.4. North Africa
- 4.5. South Africa
- 4.6. Rest of Middle East & Africa
-
5. Asia Pacific
- 5.1. China
- 5.2. India
- 5.3. Japan
- 5.4. South Korea
- 5.5. ASEAN
- 5.6. Oceania
- 5.7. Rest of Asia Pacific
Ceramic Tiles in Egypt Industry Regional Market Share
Geographic Coverage of Ceramic Tiles in Egypt Industry
Ceramic Tiles in Egypt Industry REPORT HIGHLIGHTS
| Aspects | Details |
|---|---|
| Study Period | 2020-2034 |
| Base Year | 2025 |
| Estimated Year | 2026 |
| Forecast Period | 2026-2034 |
| Historical Period | 2020-2025 |
| Growth Rate | CAGR of 8.3% from 2020-2034 |
| Segmentation |
|
Table of Contents
- 1. Introduction
- 1.1. Research Scope
- 1.2. Market Segmentation
- 1.3. Research Objective
- 1.4. Definitions and Assumptions
- 2. Executive Summary
- 2.1. Market Snapshot
- 3. Market Dynamics
- 3.1. Market Drivers
- 3.2. Market Restrains
- 3.3. Market Trends
- 3.4. Market Opportunities
- 4. Market Factor Analysis
- 4.1. Porters Five Forces
- 4.1.1. Bargaining Power of Suppliers
- 4.1.2. Bargaining Power of Buyers
- 4.1.3. Threat of New Entrants
- 4.1.4. Threat of Substitutes
- 4.1.5. Competitive Rivalry
- 4.2. PESTEL analysis
- 4.3. BCG Analysis
- 4.3.1. Stars (High Growth, High Market Share)
- 4.3.2. Cash Cows (Low Growth, High Market Share)
- 4.3.3. Question Mark (High Growth, Low Market Share)
- 4.3.4. Dogs (Low Growth, Low Market Share)
- 4.4. Ansoff Matrix Analysis
- 4.5. Supply Chain Analysis
- 4.6. Regulatory Landscape
- 4.7. Current Market Potential and Opportunity Assessment (TAM–SAM–SOM Framework)
- 4.8. VDR Analyst Note
- 4.1. Porters Five Forces
- 5. Market Analysis, Insights and Forecast 2021-2033
- 5.1. Market Analysis, Insights and Forecast - by Product
- 5.1.1. Glazed
- 5.1.2. Porcelain
- 5.1.3. Scratch Free
- 5.1.4. Other Products
- 5.2. Market Analysis, Insights and Forecast - by Application
- 5.2.1. Floor Tiles
- 5.2.2. Wall Tiles
- 5.2.3. Other Applications
- 5.3. Market Analysis, Insights and Forecast - by Construction Type
- 5.3.1. New Construction
- 5.3.2. Replacement and Renovation
- 5.4. Market Analysis, Insights and Forecast - by End User
- 5.4.1. Residential
- 5.4.2. Commercial
- 5.5. Market Analysis, Insights and Forecast - by Region
- 5.5.1. North America
- 5.5.2. South America
- 5.5.3. Europe
- 5.5.4. Middle East & Africa
- 5.5.5. Asia Pacific
- 5.1. Market Analysis, Insights and Forecast - by Product
- 6. Global Ceramic Tiles in Egypt Industry Analysis, Insights and Forecast, 2021-2033
- 6.1. Market Analysis, Insights and Forecast - by Product
- 6.1.1. Glazed
- 6.1.2. Porcelain
- 6.1.3. Scratch Free
- 6.1.4. Other Products
- 6.2. Market Analysis, Insights and Forecast - by Application
- 6.2.1. Floor Tiles
- 6.2.2. Wall Tiles
- 6.2.3. Other Applications
- 6.3. Market Analysis, Insights and Forecast - by Construction Type
- 6.3.1. New Construction
- 6.3.2. Replacement and Renovation
- 6.4. Market Analysis, Insights and Forecast - by End User
- 6.4.1. Residential
- 6.4.2. Commercial
- 6.1. Market Analysis, Insights and Forecast - by Product
- 7. North America Ceramic Tiles in Egypt Industry Analysis, Insights and Forecast, 2021-2033
- 7.1. Market Analysis, Insights and Forecast - by Product
- 7.1.1. Glazed
- 7.1.2. Porcelain
- 7.1.3. Scratch Free
- 7.1.4. Other Products
- 7.2. Market Analysis, Insights and Forecast - by Application
- 7.2.1. Floor Tiles
- 7.2.2. Wall Tiles
- 7.2.3. Other Applications
- 7.3. Market Analysis, Insights and Forecast - by Construction Type
- 7.3.1. New Construction
- 7.3.2. Replacement and Renovation
- 7.4. Market Analysis, Insights and Forecast - by End User
- 7.4.1. Residential
- 7.4.2. Commercial
- 7.1. Market Analysis, Insights and Forecast - by Product
- 8. South America Ceramic Tiles in Egypt Industry Analysis, Insights and Forecast, 2021-2033
- 8.1. Market Analysis, Insights and Forecast - by Product
- 8.1.1. Glazed
- 8.1.2. Porcelain
- 8.1.3. Scratch Free
- 8.1.4. Other Products
- 8.2. Market Analysis, Insights and Forecast - by Application
- 8.2.1. Floor Tiles
- 8.2.2. Wall Tiles
- 8.2.3. Other Applications
- 8.3. Market Analysis, Insights and Forecast - by Construction Type
- 8.3.1. New Construction
- 8.3.2. Replacement and Renovation
- 8.4. Market Analysis, Insights and Forecast - by End User
- 8.4.1. Residential
- 8.4.2. Commercial
- 8.1. Market Analysis, Insights and Forecast - by Product
- 9. Europe Ceramic Tiles in Egypt Industry Analysis, Insights and Forecast, 2021-2033
- 9.1. Market Analysis, Insights and Forecast - by Product
- 9.1.1. Glazed
- 9.1.2. Porcelain
- 9.1.3. Scratch Free
- 9.1.4. Other Products
- 9.2. Market Analysis, Insights and Forecast - by Application
- 9.2.1. Floor Tiles
- 9.2.2. Wall Tiles
- 9.2.3. Other Applications
- 9.3. Market Analysis, Insights and Forecast - by Construction Type
- 9.3.1. New Construction
- 9.3.2. Replacement and Renovation
- 9.4. Market Analysis, Insights and Forecast - by End User
- 9.4.1. Residential
- 9.4.2. Commercial
- 9.1. Market Analysis, Insights and Forecast - by Product
- 10. Middle East & Africa Ceramic Tiles in Egypt Industry Analysis, Insights and Forecast, 2021-2033
- 10.1. Market Analysis, Insights and Forecast - by Product
- 10.1.1. Glazed
- 10.1.2. Porcelain
- 10.1.3. Scratch Free
- 10.1.4. Other Products
- 10.2. Market Analysis, Insights and Forecast - by Application
- 10.2.1. Floor Tiles
- 10.2.2. Wall Tiles
- 10.2.3. Other Applications
- 10.3. Market Analysis, Insights and Forecast - by Construction Type
- 10.3.1. New Construction
- 10.3.2. Replacement and Renovation
- 10.4. Market Analysis, Insights and Forecast - by End User
- 10.4.1. Residential
- 10.4.2. Commercial
- 10.1. Market Analysis, Insights and Forecast - by Product
- 11. Asia Pacific Ceramic Tiles in Egypt Industry Analysis, Insights and Forecast, 2021-2033
- 11.1. Market Analysis, Insights and Forecast - by Product
- 11.1.1. Glazed
- 11.1.2. Porcelain
- 11.1.3. Scratch Free
- 11.1.4. Other Products
- 11.2. Market Analysis, Insights and Forecast - by Application
- 11.2.1. Floor Tiles
- 11.2.2. Wall Tiles
- 11.2.3. Other Applications
- 11.3. Market Analysis, Insights and Forecast - by Construction Type
- 11.3.1. New Construction
- 11.3.2. Replacement and Renovation
- 11.4. Market Analysis, Insights and Forecast - by End User
- 11.4.1. Residential
- 11.4.2. Commercial
- 11.1. Market Analysis, Insights and Forecast - by Product
- 12. Competitive Analysis
- 12.1. Company Profiles
- 12.1.1 Ceramica Cleopatra
- 12.1.1.1. Company Overview
- 12.1.1.2. Products
- 12.1.1.3. Company Financials
- 12.1.1.4. SWOT Analysis
- 12.1.2 Gloria Ceramics
- 12.1.2.1. Company Overview
- 12.1.2.2. Products
- 12.1.2.3. Company Financials
- 12.1.2.4. SWOT Analysis
- 12.1.3 Misr International Ceramic Company (MICC)
- 12.1.3.1. Company Overview
- 12.1.3.2. Products
- 12.1.3.3. Company Financials
- 12.1.3.4. SWOT Analysis
- 12.1.4 Aracemco (The Arab ceramic company)
- 12.1.4.1. Company Overview
- 12.1.4.2. Products
- 12.1.4.3. Company Financials
- 12.1.4.4. SWOT Analysis
- 12.1.5 Ceramica Prima
- 12.1.5.1. Company Overview
- 12.1.5.2. Products
- 12.1.5.3. Company Financials
- 12.1.5.4. SWOT Analysis
- 12.1.6 Ceramica Venzia
- 12.1.6.1. Company Overview
- 12.1.6.2. Products
- 12.1.6.3. Company Financials
- 12.1.6.4. SWOT Analysis
- 12.1.7 Lecico Egypt
- 12.1.7.1. Company Overview
- 12.1.7.2. Products
- 12.1.7.3. Company Financials
- 12.1.7.4. SWOT Analysis
- 12.1.8 Al-Ezz Ceramics and Porcelain (Gemma)
- 12.1.8.1. Company Overview
- 12.1.8.2. Products
- 12.1.8.3. Company Financials
- 12.1.8.4. SWOT Analysis
- 12.1.9 Al Amir Ceramics
- 12.1.9.1. Company Overview
- 12.1.9.2. Products
- 12.1.9.3. Company Financials
- 12.1.9.4. SWOT Analysis
- 12.1.10 Alfa Ceramic
- 12.1.10.1. Company Overview
- 12.1.10.2. Products
- 12.1.10.3. Company Financials
- 12.1.10.4. SWOT Analysis
- 12.1.11 Royal Ceramica
- 12.1.11.1. Company Overview
- 12.1.11.2. Products
- 12.1.11.3. Company Financials
- 12.1.11.4. SWOT Analysis
- 12.1.12 Pharaohs Ceramics Group (Ceramica Innova)
- 12.1.12.1. Company Overview
- 12.1.12.2. Products
- 12.1.12.3. Company Financials
- 12.1.12.4. SWOT Analysis
- 12.1.1 Ceramica Cleopatra
- 12.2. Market Entropy
- 12.2.1 Company's Key Areas Served
- 12.2.2 Recent Developments
- 12.3. Company Market Share Analysis 2025
- 12.3.1 Top 5 Companies Market Share Analysis
- 12.3.2 Top 3 Companies Market Share Analysis
- 12.4. List of Potential Customers
- 13. Research Methodology
List of Figures
- Figure 1: Global Ceramic Tiles in Egypt Industry Revenue Breakdown (billion, %) by Region 2025 & 2033
- Figure 2: Global Ceramic Tiles in Egypt Industry Volume Breakdown (K Unit, %) by Region 2025 & 2033
- Figure 3: North America Ceramic Tiles in Egypt Industry Revenue (billion), by Product 2025 & 2033
- Figure 4: North America Ceramic Tiles in Egypt Industry Volume (K Unit), by Product 2025 & 2033
- Figure 5: North America Ceramic Tiles in Egypt Industry Revenue Share (%), by Product 2025 & 2033
- Figure 6: North America Ceramic Tiles in Egypt Industry Volume Share (%), by Product 2025 & 2033
- Figure 7: North America Ceramic Tiles in Egypt Industry Revenue (billion), by Application 2025 & 2033
- Figure 8: North America Ceramic Tiles in Egypt Industry Volume (K Unit), by Application 2025 & 2033
- Figure 9: North America Ceramic Tiles in Egypt Industry Revenue Share (%), by Application 2025 & 2033
- Figure 10: North America Ceramic Tiles in Egypt Industry Volume Share (%), by Application 2025 & 2033
- Figure 11: North America Ceramic Tiles in Egypt Industry Revenue (billion), by Construction Type 2025 & 2033
- Figure 12: North America Ceramic Tiles in Egypt Industry Volume (K Unit), by Construction Type 2025 & 2033
- Figure 13: North America Ceramic Tiles in Egypt Industry Revenue Share (%), by Construction Type 2025 & 2033
- Figure 14: North America Ceramic Tiles in Egypt Industry Volume Share (%), by Construction Type 2025 & 2033
- Figure 15: North America Ceramic Tiles in Egypt Industry Revenue (billion), by End User 2025 & 2033
- Figure 16: North America Ceramic Tiles in Egypt Industry Volume (K Unit), by End User 2025 & 2033
- Figure 17: North America Ceramic Tiles in Egypt Industry Revenue Share (%), by End User 2025 & 2033
- Figure 18: North America Ceramic Tiles in Egypt Industry Volume Share (%), by End User 2025 & 2033
- Figure 19: North America Ceramic Tiles in Egypt Industry Revenue (billion), by Country 2025 & 2033
- Figure 20: North America Ceramic Tiles in Egypt Industry Volume (K Unit), by Country 2025 & 2033
- Figure 21: North America Ceramic Tiles in Egypt Industry Revenue Share (%), by Country 2025 & 2033
- Figure 22: North America Ceramic Tiles in Egypt Industry Volume Share (%), by Country 2025 & 2033
- Figure 23: South America Ceramic Tiles in Egypt Industry Revenue (billion), by Product 2025 & 2033
- Figure 24: South America Ceramic Tiles in Egypt Industry Volume (K Unit), by Product 2025 & 2033
- Figure 25: South America Ceramic Tiles in Egypt Industry Revenue Share (%), by Product 2025 & 2033
- Figure 26: South America Ceramic Tiles in Egypt Industry Volume Share (%), by Product 2025 & 2033
- Figure 27: South America Ceramic Tiles in Egypt Industry Revenue (billion), by Application 2025 & 2033
- Figure 28: South America Ceramic Tiles in Egypt Industry Volume (K Unit), by Application 2025 & 2033
- Figure 29: South America Ceramic Tiles in Egypt Industry Revenue Share (%), by Application 2025 & 2033
- Figure 30: South America Ceramic Tiles in Egypt Industry Volume Share (%), by Application 2025 & 2033
- Figure 31: South America Ceramic Tiles in Egypt Industry Revenue (billion), by Construction Type 2025 & 2033
- Figure 32: South America Ceramic Tiles in Egypt Industry Volume (K Unit), by Construction Type 2025 & 2033
- Figure 33: South America Ceramic Tiles in Egypt Industry Revenue Share (%), by Construction Type 2025 & 2033
- Figure 34: South America Ceramic Tiles in Egypt Industry Volume Share (%), by Construction Type 2025 & 2033
- Figure 35: South America Ceramic Tiles in Egypt Industry Revenue (billion), by End User 2025 & 2033
- Figure 36: South America Ceramic Tiles in Egypt Industry Volume (K Unit), by End User 2025 & 2033
- Figure 37: South America Ceramic Tiles in Egypt Industry Revenue Share (%), by End User 2025 & 2033
- Figure 38: South America Ceramic Tiles in Egypt Industry Volume Share (%), by End User 2025 & 2033
- Figure 39: South America Ceramic Tiles in Egypt Industry Revenue (billion), by Country 2025 & 2033
- Figure 40: South America Ceramic Tiles in Egypt Industry Volume (K Unit), by Country 2025 & 2033
- Figure 41: South America Ceramic Tiles in Egypt Industry Revenue Share (%), by Country 2025 & 2033
- Figure 42: South America Ceramic Tiles in Egypt Industry Volume Share (%), by Country 2025 & 2033
- Figure 43: Europe Ceramic Tiles in Egypt Industry Revenue (billion), by Product 2025 & 2033
- Figure 44: Europe Ceramic Tiles in Egypt Industry Volume (K Unit), by Product 2025 & 2033
- Figure 45: Europe Ceramic Tiles in Egypt Industry Revenue Share (%), by Product 2025 & 2033
- Figure 46: Europe Ceramic Tiles in Egypt Industry Volume Share (%), by Product 2025 & 2033
- Figure 47: Europe Ceramic Tiles in Egypt Industry Revenue (billion), by Application 2025 & 2033
- Figure 48: Europe Ceramic Tiles in Egypt Industry Volume (K Unit), by Application 2025 & 2033
- Figure 49: Europe Ceramic Tiles in Egypt Industry Revenue Share (%), by Application 2025 & 2033
- Figure 50: Europe Ceramic Tiles in Egypt Industry Volume Share (%), by Application 2025 & 2033
- Figure 51: Europe Ceramic Tiles in Egypt Industry Revenue (billion), by Construction Type 2025 & 2033
- Figure 52: Europe Ceramic Tiles in Egypt Industry Volume (K Unit), by Construction Type 2025 & 2033
- Figure 53: Europe Ceramic Tiles in Egypt Industry Revenue Share (%), by Construction Type 2025 & 2033
- Figure 54: Europe Ceramic Tiles in Egypt Industry Volume Share (%), by Construction Type 2025 & 2033
- Figure 55: Europe Ceramic Tiles in Egypt Industry Revenue (billion), by End User 2025 & 2033
- Figure 56: Europe Ceramic Tiles in Egypt Industry Volume (K Unit), by End User 2025 & 2033
- Figure 57: Europe Ceramic Tiles in Egypt Industry Revenue Share (%), by End User 2025 & 2033
- Figure 58: Europe Ceramic Tiles in Egypt Industry Volume Share (%), by End User 2025 & 2033
- Figure 59: Europe Ceramic Tiles in Egypt Industry Revenue (billion), by Country 2025 & 2033
- Figure 60: Europe Ceramic Tiles in Egypt Industry Volume (K Unit), by Country 2025 & 2033
- Figure 61: Europe Ceramic Tiles in Egypt Industry Revenue Share (%), by Country 2025 & 2033
- Figure 62: Europe Ceramic Tiles in Egypt Industry Volume Share (%), by Country 2025 & 2033
- Figure 63: Middle East & Africa Ceramic Tiles in Egypt Industry Revenue (billion), by Product 2025 & 2033
- Figure 64: Middle East & Africa Ceramic Tiles in Egypt Industry Volume (K Unit), by Product 2025 & 2033
- Figure 65: Middle East & Africa Ceramic Tiles in Egypt Industry Revenue Share (%), by Product 2025 & 2033
- Figure 66: Middle East & Africa Ceramic Tiles in Egypt Industry Volume Share (%), by Product 2025 & 2033
- Figure 67: Middle East & Africa Ceramic Tiles in Egypt Industry Revenue (billion), by Application 2025 & 2033
- Figure 68: Middle East & Africa Ceramic Tiles in Egypt Industry Volume (K Unit), by Application 2025 & 2033
- Figure 69: Middle East & Africa Ceramic Tiles in Egypt Industry Revenue Share (%), by Application 2025 & 2033
- Figure 70: Middle East & Africa Ceramic Tiles in Egypt Industry Volume Share (%), by Application 2025 & 2033
- Figure 71: Middle East & Africa Ceramic Tiles in Egypt Industry Revenue (billion), by Construction Type 2025 & 2033
- Figure 72: Middle East & Africa Ceramic Tiles in Egypt Industry Volume (K Unit), by Construction Type 2025 & 2033
- Figure 73: Middle East & Africa Ceramic Tiles in Egypt Industry Revenue Share (%), by Construction Type 2025 & 2033
- Figure 74: Middle East & Africa Ceramic Tiles in Egypt Industry Volume Share (%), by Construction Type 2025 & 2033
- Figure 75: Middle East & Africa Ceramic Tiles in Egypt Industry Revenue (billion), by End User 2025 & 2033
- Figure 76: Middle East & Africa Ceramic Tiles in Egypt Industry Volume (K Unit), by End User 2025 & 2033
- Figure 77: Middle East & Africa Ceramic Tiles in Egypt Industry Revenue Share (%), by End User 2025 & 2033
- Figure 78: Middle East & Africa Ceramic Tiles in Egypt Industry Volume Share (%), by End User 2025 & 2033
- Figure 79: Middle East & Africa Ceramic Tiles in Egypt Industry Revenue (billion), by Country 2025 & 2033
- Figure 80: Middle East & Africa Ceramic Tiles in Egypt Industry Volume (K Unit), by Country 2025 & 2033
- Figure 81: Middle East & Africa Ceramic Tiles in Egypt Industry Revenue Share (%), by Country 2025 & 2033
- Figure 82: Middle East & Africa Ceramic Tiles in Egypt Industry Volume Share (%), by Country 2025 & 2033
- Figure 83: Asia Pacific Ceramic Tiles in Egypt Industry Revenue (billion), by Product 2025 & 2033
- Figure 84: Asia Pacific Ceramic Tiles in Egypt Industry Volume (K Unit), by Product 2025 & 2033
- Figure 85: Asia Pacific Ceramic Tiles in Egypt Industry Revenue Share (%), by Product 2025 & 2033
- Figure 86: Asia Pacific Ceramic Tiles in Egypt Industry Volume Share (%), by Product 2025 & 2033
- Figure 87: Asia Pacific Ceramic Tiles in Egypt Industry Revenue (billion), by Application 2025 & 2033
- Figure 88: Asia Pacific Ceramic Tiles in Egypt Industry Volume (K Unit), by Application 2025 & 2033
- Figure 89: Asia Pacific Ceramic Tiles in Egypt Industry Revenue Share (%), by Application 2025 & 2033
- Figure 90: Asia Pacific Ceramic Tiles in Egypt Industry Volume Share (%), by Application 2025 & 2033
- Figure 91: Asia Pacific Ceramic Tiles in Egypt Industry Revenue (billion), by Construction Type 2025 & 2033
- Figure 92: Asia Pacific Ceramic Tiles in Egypt Industry Volume (K Unit), by Construction Type 2025 & 2033
- Figure 93: Asia Pacific Ceramic Tiles in Egypt Industry Revenue Share (%), by Construction Type 2025 & 2033
- Figure 94: Asia Pacific Ceramic Tiles in Egypt Industry Volume Share (%), by Construction Type 2025 & 2033
- Figure 95: Asia Pacific Ceramic Tiles in Egypt Industry Revenue (billion), by End User 2025 & 2033
- Figure 96: Asia Pacific Ceramic Tiles in Egypt Industry Volume (K Unit), by End User 2025 & 2033
- Figure 97: Asia Pacific Ceramic Tiles in Egypt Industry Revenue Share (%), by End User 2025 & 2033
- Figure 98: Asia Pacific Ceramic Tiles in Egypt Industry Volume Share (%), by End User 2025 & 2033
- Figure 99: Asia Pacific Ceramic Tiles in Egypt Industry Revenue (billion), by Country 2025 & 2033
- Figure 100: Asia Pacific Ceramic Tiles in Egypt Industry Volume (K Unit), by Country 2025 & 2033
- Figure 101: Asia Pacific Ceramic Tiles in Egypt Industry Revenue Share (%), by Country 2025 & 2033
- Figure 102: Asia Pacific Ceramic Tiles in Egypt Industry Volume Share (%), by Country 2025 & 2033
List of Tables
- Table 1: Global Ceramic Tiles in Egypt Industry Revenue billion Forecast, by Product 2020 & 2033
- Table 2: Global Ceramic Tiles in Egypt Industry Volume K Unit Forecast, by Product 2020 & 2033
- Table 3: Global Ceramic Tiles in Egypt Industry Revenue billion Forecast, by Application 2020 & 2033
- Table 4: Global Ceramic Tiles in Egypt Industry Volume K Unit Forecast, by Application 2020 & 2033
- Table 5: Global Ceramic Tiles in Egypt Industry Revenue billion Forecast, by Construction Type 2020 & 2033
- Table 6: Global Ceramic Tiles in Egypt Industry Volume K Unit Forecast, by Construction Type 2020 & 2033
- Table 7: Global Ceramic Tiles in Egypt Industry Revenue billion Forecast, by End User 2020 & 2033
- Table 8: Global Ceramic Tiles in Egypt Industry Volume K Unit Forecast, by End User 2020 & 2033
- Table 9: Global Ceramic Tiles in Egypt Industry Revenue billion Forecast, by Region 2020 & 2033
- Table 10: Global Ceramic Tiles in Egypt Industry Volume K Unit Forecast, by Region 2020 & 2033
- Table 11: Global Ceramic Tiles in Egypt Industry Revenue billion Forecast, by Product 2020 & 2033
- Table 12: Global Ceramic Tiles in Egypt Industry Volume K Unit Forecast, by Product 2020 & 2033
- Table 13: Global Ceramic Tiles in Egypt Industry Revenue billion Forecast, by Application 2020 & 2033
- Table 14: Global Ceramic Tiles in Egypt Industry Volume K Unit Forecast, by Application 2020 & 2033
- Table 15: Global Ceramic Tiles in Egypt Industry Revenue billion Forecast, by Construction Type 2020 & 2033
- Table 16: Global Ceramic Tiles in Egypt Industry Volume K Unit Forecast, by Construction Type 2020 & 2033
- Table 17: Global Ceramic Tiles in Egypt Industry Revenue billion Forecast, by End User 2020 & 2033
- Table 18: Global Ceramic Tiles in Egypt Industry Volume K Unit Forecast, by End User 2020 & 2033
- Table 19: Global Ceramic Tiles in Egypt Industry Revenue billion Forecast, by Country 2020 & 2033
- Table 20: Global Ceramic Tiles in Egypt Industry Volume K Unit Forecast, by Country 2020 & 2033
- Table 21: United States Ceramic Tiles in Egypt Industry Revenue (billion) Forecast, by Application 2020 & 2033
- Table 22: United States Ceramic Tiles in Egypt Industry Volume (K Unit) Forecast, by Application 2020 & 2033
- Table 23: Canada Ceramic Tiles in Egypt Industry Revenue (billion) Forecast, by Application 2020 & 2033
- Table 24: Canada Ceramic Tiles in Egypt Industry Volume (K Unit) Forecast, by Application 2020 & 2033
- Table 25: Mexico Ceramic Tiles in Egypt Industry Revenue (billion) Forecast, by Application 2020 & 2033
- Table 26: Mexico Ceramic Tiles in Egypt Industry Volume (K Unit) Forecast, by Application 2020 & 2033
- Table 27: Global Ceramic Tiles in Egypt Industry Revenue billion Forecast, by Product 2020 & 2033
- Table 28: Global Ceramic Tiles in Egypt Industry Volume K Unit Forecast, by Product 2020 & 2033
- Table 29: Global Ceramic Tiles in Egypt Industry Revenue billion Forecast, by Application 2020 & 2033
- Table 30: Global Ceramic Tiles in Egypt Industry Volume K Unit Forecast, by Application 2020 & 2033
- Table 31: Global Ceramic Tiles in Egypt Industry Revenue billion Forecast, by Construction Type 2020 & 2033
- Table 32: Global Ceramic Tiles in Egypt Industry Volume K Unit Forecast, by Construction Type 2020 & 2033
- Table 33: Global Ceramic Tiles in Egypt Industry Revenue billion Forecast, by End User 2020 & 2033
- Table 34: Global Ceramic Tiles in Egypt Industry Volume K Unit Forecast, by End User 2020 & 2033
- Table 35: Global Ceramic Tiles in Egypt Industry Revenue billion Forecast, by Country 2020 & 2033
- Table 36: Global Ceramic Tiles in Egypt Industry Volume K Unit Forecast, by Country 2020 & 2033
- Table 37: Brazil Ceramic Tiles in Egypt Industry Revenue (billion) Forecast, by Application 2020 & 2033
- Table 38: Brazil Ceramic Tiles in Egypt Industry Volume (K Unit) Forecast, by Application 2020 & 2033
- Table 39: Argentina Ceramic Tiles in Egypt Industry Revenue (billion) Forecast, by Application 2020 & 2033
- Table 40: Argentina Ceramic Tiles in Egypt Industry Volume (K Unit) Forecast, by Application 2020 & 2033
- Table 41: Rest of South America Ceramic Tiles in Egypt Industry Revenue (billion) Forecast, by Application 2020 & 2033
- Table 42: Rest of South America Ceramic Tiles in Egypt Industry Volume (K Unit) Forecast, by Application 2020 & 2033
- Table 43: Global Ceramic Tiles in Egypt Industry Revenue billion Forecast, by Product 2020 & 2033
- Table 44: Global Ceramic Tiles in Egypt Industry Volume K Unit Forecast, by Product 2020 & 2033
- Table 45: Global Ceramic Tiles in Egypt Industry Revenue billion Forecast, by Application 2020 & 2033
- Table 46: Global Ceramic Tiles in Egypt Industry Volume K Unit Forecast, by Application 2020 & 2033
- Table 47: Global Ceramic Tiles in Egypt Industry Revenue billion Forecast, by Construction Type 2020 & 2033
- Table 48: Global Ceramic Tiles in Egypt Industry Volume K Unit Forecast, by Construction Type 2020 & 2033
- Table 49: Global Ceramic Tiles in Egypt Industry Revenue billion Forecast, by End User 2020 & 2033
- Table 50: Global Ceramic Tiles in Egypt Industry Volume K Unit Forecast, by End User 2020 & 2033
- Table 51: Global Ceramic Tiles in Egypt Industry Revenue billion Forecast, by Country 2020 & 2033
- Table 52: Global Ceramic Tiles in Egypt Industry Volume K Unit Forecast, by Country 2020 & 2033
- Table 53: United Kingdom Ceramic Tiles in Egypt Industry Revenue (billion) Forecast, by Application 2020 & 2033
- Table 54: United Kingdom Ceramic Tiles in Egypt Industry Volume (K Unit) Forecast, by Application 2020 & 2033
- Table 55: Germany Ceramic Tiles in Egypt Industry Revenue (billion) Forecast, by Application 2020 & 2033
- Table 56: Germany Ceramic Tiles in Egypt Industry Volume (K Unit) Forecast, by Application 2020 & 2033
- Table 57: France Ceramic Tiles in Egypt Industry Revenue (billion) Forecast, by Application 2020 & 2033
- Table 58: France Ceramic Tiles in Egypt Industry Volume (K Unit) Forecast, by Application 2020 & 2033
- Table 59: Italy Ceramic Tiles in Egypt Industry Revenue (billion) Forecast, by Application 2020 & 2033
- Table 60: Italy Ceramic Tiles in Egypt Industry Volume (K Unit) Forecast, by Application 2020 & 2033
- Table 61: Spain Ceramic Tiles in Egypt Industry Revenue (billion) Forecast, by Application 2020 & 2033
- Table 62: Spain Ceramic Tiles in Egypt Industry Volume (K Unit) Forecast, by Application 2020 & 2033
- Table 63: Russia Ceramic Tiles in Egypt Industry Revenue (billion) Forecast, by Application 2020 & 2033
- Table 64: Russia Ceramic Tiles in Egypt Industry Volume (K Unit) Forecast, by Application 2020 & 2033
- Table 65: Benelux Ceramic Tiles in Egypt Industry Revenue (billion) Forecast, by Application 2020 & 2033
- Table 66: Benelux Ceramic Tiles in Egypt Industry Volume (K Unit) Forecast, by Application 2020 & 2033
- Table 67: Nordics Ceramic Tiles in Egypt Industry Revenue (billion) Forecast, by Application 2020 & 2033
- Table 68: Nordics Ceramic Tiles in Egypt Industry Volume (K Unit) Forecast, by Application 2020 & 2033
- Table 69: Rest of Europe Ceramic Tiles in Egypt Industry Revenue (billion) Forecast, by Application 2020 & 2033
- Table 70: Rest of Europe Ceramic Tiles in Egypt Industry Volume (K Unit) Forecast, by Application 2020 & 2033
- Table 71: Global Ceramic Tiles in Egypt Industry Revenue billion Forecast, by Product 2020 & 2033
- Table 72: Global Ceramic Tiles in Egypt Industry Volume K Unit Forecast, by Product 2020 & 2033
- Table 73: Global Ceramic Tiles in Egypt Industry Revenue billion Forecast, by Application 2020 & 2033
- Table 74: Global Ceramic Tiles in Egypt Industry Volume K Unit Forecast, by Application 2020 & 2033
- Table 75: Global Ceramic Tiles in Egypt Industry Revenue billion Forecast, by Construction Type 2020 & 2033
- Table 76: Global Ceramic Tiles in Egypt Industry Volume K Unit Forecast, by Construction Type 2020 & 2033
- Table 77: Global Ceramic Tiles in Egypt Industry Revenue billion Forecast, by End User 2020 & 2033
- Table 78: Global Ceramic Tiles in Egypt Industry Volume K Unit Forecast, by End User 2020 & 2033
- Table 79: Global Ceramic Tiles in Egypt Industry Revenue billion Forecast, by Country 2020 & 2033
- Table 80: Global Ceramic Tiles in Egypt Industry Volume K Unit Forecast, by Country 2020 & 2033
- Table 81: Turkey Ceramic Tiles in Egypt Industry Revenue (billion) Forecast, by Application 2020 & 2033
- Table 82: Turkey Ceramic Tiles in Egypt Industry Volume (K Unit) Forecast, by Application 2020 & 2033
- Table 83: Israel Ceramic Tiles in Egypt Industry Revenue (billion) Forecast, by Application 2020 & 2033
- Table 84: Israel Ceramic Tiles in Egypt Industry Volume (K Unit) Forecast, by Application 2020 & 2033
- Table 85: GCC Ceramic Tiles in Egypt Industry Revenue (billion) Forecast, by Application 2020 & 2033
- Table 86: GCC Ceramic Tiles in Egypt Industry Volume (K Unit) Forecast, by Application 2020 & 2033
- Table 87: North Africa Ceramic Tiles in Egypt Industry Revenue (billion) Forecast, by Application 2020 & 2033
- Table 88: North Africa Ceramic Tiles in Egypt Industry Volume (K Unit) Forecast, by Application 2020 & 2033
- Table 89: South Africa Ceramic Tiles in Egypt Industry Revenue (billion) Forecast, by Application 2020 & 2033
- Table 90: South Africa Ceramic Tiles in Egypt Industry Volume (K Unit) Forecast, by Application 2020 & 2033
- Table 91: Rest of Middle East & Africa Ceramic Tiles in Egypt Industry Revenue (billion) Forecast, by Application 2020 & 2033
- Table 92: Rest of Middle East & Africa Ceramic Tiles in Egypt Industry Volume (K Unit) Forecast, by Application 2020 & 2033
- Table 93: Global Ceramic Tiles in Egypt Industry Revenue billion Forecast, by Product 2020 & 2033
- Table 94: Global Ceramic Tiles in Egypt Industry Volume K Unit Forecast, by Product 2020 & 2033
- Table 95: Global Ceramic Tiles in Egypt Industry Revenue billion Forecast, by Application 2020 & 2033
- Table 96: Global Ceramic Tiles in Egypt Industry Volume K Unit Forecast, by Application 2020 & 2033
- Table 97: Global Ceramic Tiles in Egypt Industry Revenue billion Forecast, by Construction Type 2020 & 2033
- Table 98: Global Ceramic Tiles in Egypt Industry Volume K Unit Forecast, by Construction Type 2020 & 2033
- Table 99: Global Ceramic Tiles in Egypt Industry Revenue billion Forecast, by End User 2020 & 2033
- Table 100: Global Ceramic Tiles in Egypt Industry Volume K Unit Forecast, by End User 2020 & 2033
- Table 101: Global Ceramic Tiles in Egypt Industry Revenue billion Forecast, by Country 2020 & 2033
- Table 102: Global Ceramic Tiles in Egypt Industry Volume K Unit Forecast, by Country 2020 & 2033
- Table 103: China Ceramic Tiles in Egypt Industry Revenue (billion) Forecast, by Application 2020 & 2033
- Table 104: China Ceramic Tiles in Egypt Industry Volume (K Unit) Forecast, by Application 2020 & 2033
- Table 105: India Ceramic Tiles in Egypt Industry Revenue (billion) Forecast, by Application 2020 & 2033
- Table 106: India Ceramic Tiles in Egypt Industry Volume (K Unit) Forecast, by Application 2020 & 2033
- Table 107: Japan Ceramic Tiles in Egypt Industry Revenue (billion) Forecast, by Application 2020 & 2033
- Table 108: Japan Ceramic Tiles in Egypt Industry Volume (K Unit) Forecast, by Application 2020 & 2033
- Table 109: South Korea Ceramic Tiles in Egypt Industry Revenue (billion) Forecast, by Application 2020 & 2033
- Table 110: South Korea Ceramic Tiles in Egypt Industry Volume (K Unit) Forecast, by Application 2020 & 2033
- Table 111: ASEAN Ceramic Tiles in Egypt Industry Revenue (billion) Forecast, by Application 2020 & 2033
- Table 112: ASEAN Ceramic Tiles in Egypt Industry Volume (K Unit) Forecast, by Application 2020 & 2033
- Table 113: Oceania Ceramic Tiles in Egypt Industry Revenue (billion) Forecast, by Application 2020 & 2033
- Table 114: Oceania Ceramic Tiles in Egypt Industry Volume (K Unit) Forecast, by Application 2020 & 2033
- Table 115: Rest of Asia Pacific Ceramic Tiles in Egypt Industry Revenue (billion) Forecast, by Application 2020 & 2033
- Table 116: Rest of Asia Pacific Ceramic Tiles in Egypt Industry Volume (K Unit) Forecast, by Application 2020 & 2033
Frequently Asked Questions
1. What is the projected Compound Annual Growth Rate (CAGR) of the Ceramic Tiles in Egypt Industry?
The projected CAGR is approximately 8.3%.
2. Which companies are prominent players in the Ceramic Tiles in Egypt Industry?
Key companies in the market include Ceramica Cleopatra, Gloria Ceramics, Misr International Ceramic Company (MICC), Aracemco (The Arab ceramic company), Ceramica Prima, Ceramica Venzia, Lecico Egypt, Al-Ezz Ceramics and Porcelain (Gemma), Al Amir Ceramics, Alfa Ceramic, Royal Ceramica, Pharaohs Ceramics Group (Ceramica Innova).
3. What are the main segments of the Ceramic Tiles in Egypt Industry?
The market segments include Product, Application, Construction Type, End User.
4. Can you provide details about the market size?
The market size is estimated to be USD 1.5 billion as of 2022.
5. What are some drivers contributing to market growth?
Rising Construction Sector is Driving the Floor Covering Market; Growing Urbanization is Driving the Market.
6. What are the notable trends driving market growth?
Increasing Production of Ceramic Tiles in Egypt.
7. Are there any restraints impacting market growth?
Skill Gap and Labor Shortages Strikes as Major Restraints For Floor Covering Manufacturing And Maintenance.
8. Can you provide examples of recent developments in the market?
N/A
9. What pricing options are available for accessing the report?
Pricing options include single-user, multi-user, and enterprise licenses priced at USD 3800, USD 4500, and USD 5800 respectively.
10. Is the market size provided in terms of value or volume?
The market size is provided in terms of value, measured in billion and volume, measured in K Unit.
11. Are there any specific market keywords associated with the report?
Yes, the market keyword associated with the report is "Ceramic Tiles in Egypt Industry," which aids in identifying and referencing the specific market segment covered.
12. How do I determine which pricing option suits my needs best?
The pricing options vary based on user requirements and access needs. Individual users may opt for single-user licenses, while businesses requiring broader access may choose multi-user or enterprise licenses for cost-effective access to the report.
13. Are there any additional resources or data provided in the Ceramic Tiles in Egypt Industry report?
While the report offers comprehensive insights, it's advisable to review the specific contents or supplementary materials provided to ascertain if additional resources or data are available.
14. How can I stay updated on further developments or reports in the Ceramic Tiles in Egypt Industry?
To stay informed about further developments, trends, and reports in the Ceramic Tiles in Egypt Industry, consider subscribing to industry newsletters, following relevant companies and organizations, or regularly checking reputable industry news sources and publications.
Methodology
Step 1 - Identification of Relevant Samples Size from Population Database


Step 2 - Approaches for Defining Global Market Size (Value, Volume* & Price*)

Note*: In applicable scenarios
Step 3 - Data Sources
Primary Research
- Web Analytics
- Survey Reports
- Research Institute
- Latest Research Reports
- Opinion Leaders
Secondary Research
- Annual Reports
- White Paper
- Latest Press Release
- Industry Association
- Paid Database
- Investor Presentations

Step 4 - Data Triangulation
Involves using different sources of information in order to increase the validity of a study
These sources are likely to be stakeholders in a program - participants, other researchers, program staff, other community members, and so on.
Then we put all data in single framework & apply various statistical tools to find out the dynamic on the market.
During the analysis stage, feedback from the stakeholder groups would be compared to determine areas of agreement as well as areas of divergence