

Key Insights
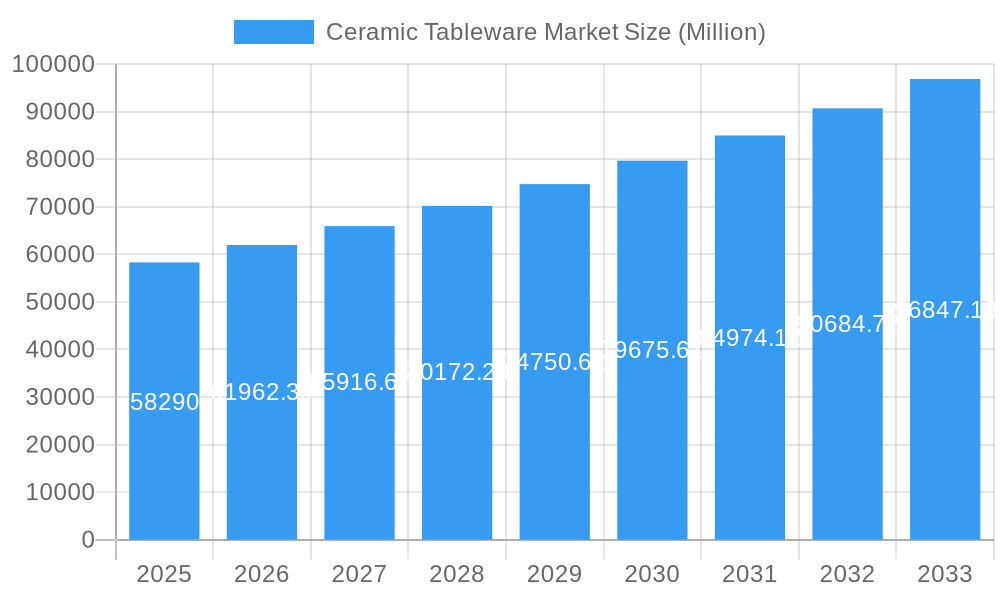
The global ceramic tableware market, valued at $58.29 billion in 2025, is projected to experience robust growth, exhibiting a Compound Annual Growth Rate (CAGR) of 6.21% from 2025 to 2033. This expansion is driven by several key factors. The rising disposable incomes in developing economies, coupled with a growing preference for aesthetically pleasing and durable tableware, fuels demand. Furthermore, the increasing popularity of casual dining and home entertaining contributes significantly to market growth. The shift towards online retail channels offers convenient access to a wider selection of products, further boosting sales. Within the market segmentation, porcelain and bone china continue to hold a significant share due to their premium quality and elegance. However, stoneware, owing to its durability and affordability, is experiencing a surge in popularity. The household segment remains the largest end-user, although the commercial sector, encompassing restaurants and hotels, is witnessing strong growth. Geographic distribution shows strong market presence across North America and Europe, with Asia-Pacific emerging as a key growth region driven by burgeoning economies like China and India. Competitive dynamics are intense, with established players like Portmeirion Group PLC, Rosenthal GmbH, and Villeroy & Boch facing competition from emerging regional brands. Innovation in designs, materials, and functionality, along with sustainable manufacturing practices, will be crucial factors shaping future market trajectories.
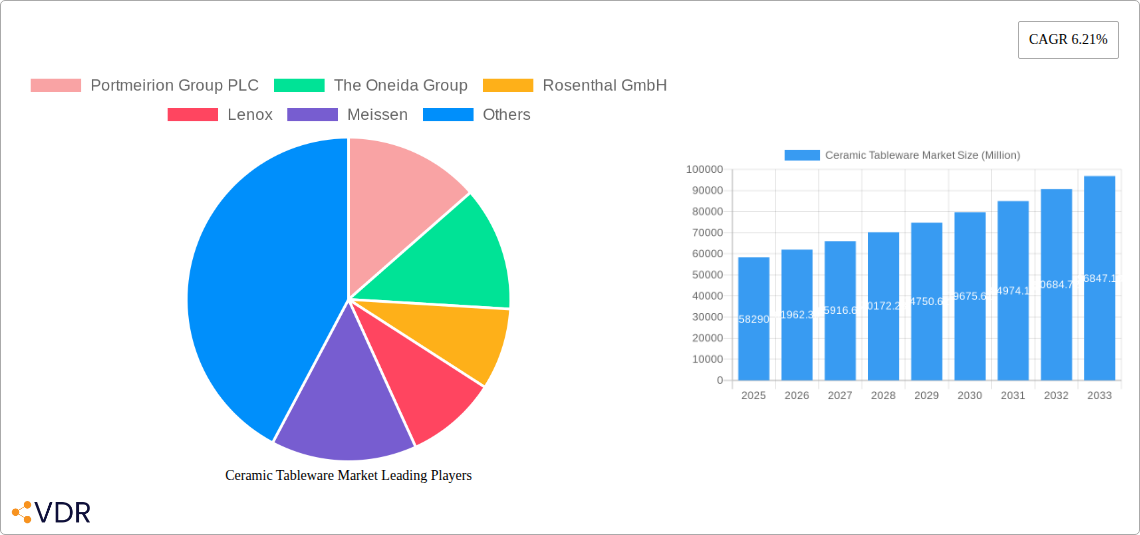
Ceramic Tableware Market Market Size (In Billion)
The market faces challenges, primarily fluctuating raw material prices and increasing concerns about the environmental impact of ceramic production. Meeting the rising consumer demand for eco-friendly and ethically sourced products is vital for manufacturers. Strategies focused on sustainable sourcing, reducing carbon footprint, and developing innovative, recyclable tableware will be pivotal. The competitive landscape necessitates ongoing product diversification, strategic partnerships, and robust branding to maintain market share. Expanding distribution networks, especially in emerging markets, and capitalizing on e-commerce opportunities will be crucial for achieving sustained growth. The potential for customization and personalization in tableware also presents a significant opportunity for manufacturers to cater to individual consumer preferences. Overall, the future of the ceramic tableware market is promising, with consistent growth potential driven by evolving consumer preferences and innovative product offerings.
Ceramic Tableware Market Company Market Share
Ceramic Tableware Market: A Comprehensive Market Report (2019-2033)
This comprehensive report provides an in-depth analysis of the global Ceramic Tableware Market, offering invaluable insights for industry professionals, investors, and strategic decision-makers. The study covers the period 2019-2033, with a focus on the base year 2025 and a forecast period of 2025-2033. The report segments the market by type (Porcelain and Bone China, Stoneware (Ceramic), Others), end-user (Household, Commercial), and distribution channel (Supermarkets & Hypermarkets, Specialty Stores, Wholesalers, Online, Others). Key players analyzed include Portmeirion Group PLC, The Oneida Group, Rosenthal GmbH, Lenox, Meissen, Libbey, Seltmann Weiden, RAK Porcelain, Narumi, KAHLA Porzellan, WMF, SCHONWALD, Churchill China, Villeroy & Boch, TATA ceramics, Sitong Group, and Fiskars Group. The total market size in 2025 is estimated at xx Million units.
Ceramic Tableware Market Dynamics & Structure
The Ceramic Tableware market is characterized by a moderately concentrated structure, with several established players holding significant market share. Technological innovations, particularly in material science and design, are key drivers, pushing boundaries in durability, aesthetics, and functionality. Stringent regulatory frameworks concerning food safety and material composition influence manufacturing processes and product development. The market faces competition from substitute materials like melamine and plastic tableware, but the enduring appeal of ceramic for its aesthetic and perceived quality advantages ensures continued relevance. End-user demographics, particularly evolving consumer preferences towards premium quality and sustainable products, significantly impact market segmentation. The last five years have seen xx M&A deals, primarily driven by strategic expansion and consolidation within the industry.
- Market Concentration: Moderately concentrated, with top 5 players holding approximately xx% market share in 2025.
- Technological Innovation: Focus on lightweight, durable materials, innovative designs, and sustainable manufacturing.
- Regulatory Frameworks: Stringent food safety regulations and environmental standards impacting production.
- Competitive Substitutes: Growing competition from melamine and plastic tableware, particularly in the budget segment.
- End-User Demographics: Shifting consumer preferences toward premium quality, sustainable, and aesthetically pleasing tableware.
- M&A Trends: xx M&A deals observed between 2019 and 2024, indicating a trend towards consolidation.
Ceramic Tableware Market Growth Trends & Insights
The global Ceramic Tableware market experienced a CAGR of xx% during the historical period (2019-2024), reaching xx Million units in 2024. This growth is primarily attributed to rising disposable incomes in developing economies, increasing urbanization, and a growing preference for formal dining experiences. Technological advancements, such as the introduction of advanced glazing techniques and new material compositions, have also contributed to market expansion. Changes in consumer behavior, including a shift toward online purchasing and a demand for personalized products, are further shaping market dynamics. The forecast period (2025-2033) projects continued growth, with a projected CAGR of xx%, driven by factors such as the expanding middle class, increasing tourism, and the rise of the food service industry. Market penetration is expected to reach xx% by 2033. (Note: XXX refers to the data source used for analysis, which should be specified in the full report).
Dominant Regions, Countries, or Segments in Ceramic Tableware Market
The Asia-Pacific region is expected to dominate the Ceramic Tableware market during the forecast period, driven by rapid economic growth, a large and growing middle class, and a rising demand for premium tableware. Within this region, China and India are major growth contributors due to their large populations and developing economies.
By Type: Porcelain and Bone China segment holds the largest market share due to its superior quality, durability, and aesthetic appeal.
By End-User: The Household segment accounts for the majority of market revenue, indicating a strong preference for ceramic tableware in homes.
By Distribution Channel: Supermarkets & Hypermarkets dominate the distribution channels owing to their wide reach and ease of access.
- Key Drivers (Asia-Pacific): Rapid economic growth, expanding middle class, increasing urbanization, and rising tourism.
- Dominance Factors: Large population base, increasing disposable incomes, and growing preference for premium tableware.
- Growth Potential: Significant untapped potential in emerging markets within the region.
Ceramic Tableware Market Product Landscape
The Ceramic Tableware market showcases a diverse product landscape with continuous innovation in designs, materials, and functionalities. Manufacturers are increasingly focusing on developing lightweight yet durable products, incorporating sustainable materials, and offering personalized designs to cater to evolving consumer preferences. Technological advancements are evident in the use of innovative glazing techniques to enhance product durability and aesthetic appeal. Unique selling propositions include intricate designs, enhanced durability, and microwave/dishwasher compatibility.
Key Drivers, Barriers & Challenges in Ceramic Tableware Market
Key Drivers:
- Rising disposable incomes globally driving demand for premium tableware.
- Growing popularity of home-based dining experiences.
- Technological advancements leading to improved product quality and durability.
- Increasing demand for sustainable and eco-friendly tableware.
Challenges & Restraints:
- Fluctuating raw material prices impacting production costs.
- Intense competition from substitute materials.
- Stringent environmental regulations and their implementation costs.
- Supply chain disruptions potentially impacting production and delivery.
Emerging Opportunities in Ceramic Tableware Market
- Growing demand for personalized and customized tableware.
- Expansion into untapped markets in developing economies.
- Development of eco-friendly and sustainable ceramic tableware options.
- Increasing use of technology in product design and manufacturing processes.
Growth Accelerators in the Ceramic Tableware Market Industry
Strategic partnerships and collaborations among manufacturers, designers, and retailers are crucial for accelerating growth. This enables efficient resource allocation and market reach. Furthermore, investments in research and development leading to technological breakthroughs, particularly in sustainable material sourcing and advanced manufacturing techniques, will play a key role in future market leadership. Expanding distribution channels into emerging markets and leveraging online platforms for direct sales will significantly boost market reach and accessibility.
Key Players Shaping the Ceramic Tableware Market Market
- Portmeirion Group PLC
- The Oneida Group
- Rosenthal GmbH
- Lenox
- Meissen
- Libbey
- Seltmann Weiden
- RAK Porcelain
- Narumi
- KAHLA Porzellan
- WMF
- SCHONWALD
- Churchill China
- Villeroy & Boch
- TATA ceramics
- Sitong Group
- Fiskars Group
Notable Milestones in Ceramic Tableware Market Sector
- 2020: Introduction of a new line of sustainable ceramic tableware by [Company Name].
- 2021: Merger between [Company Name] and [Company Name], expanding market reach.
- 2022: Launch of a new 3D-printed ceramic tableware collection by [Company Name].
- 2023: Significant investment in R&D for eco-friendly ceramic production by [Company Name].
- 2024: Expansion of online sales channels by several major players.
In-Depth Ceramic Tableware Market Market Outlook
The future of the Ceramic Tableware market is bright, driven by continued technological advancements, evolving consumer preferences, and expanding global markets. Strategic opportunities lie in focusing on sustainable production methods, personalization, and expanding into emerging markets. The market is poised for robust growth, particularly in the premium segment, with increasing demand for high-quality, durable, and aesthetically pleasing tableware. The focus on innovation, sustainability, and consumer preferences will define the success of market players in the coming years.
Ceramic Tableware Market Segmentation
-
1. Type
- 1.1. Porcelain and Bone China
- 1.2. Stoneware (Ceramic)
- 1.3. Others
-
2. End User
- 2.1. Household
-
2.2. Commercial
- 2.2.1. Accommodation and Hospitality Segment
- 2.2.2. Food Service Segment
- 2.2.3. Others
-
3. Distribution Channel
- 3.1. Supermarkets & Hypermarkets
- 3.2. Specialty Stores
- 3.3. Wholesalers
- 3.4. Online
- 3.5. Others
Ceramic Tableware Market Segmentation By Geography
- 1. North America
- 2. Asia Pacific
- 3. Europe
- 4. Latin America
- 5. Middle East and Africa
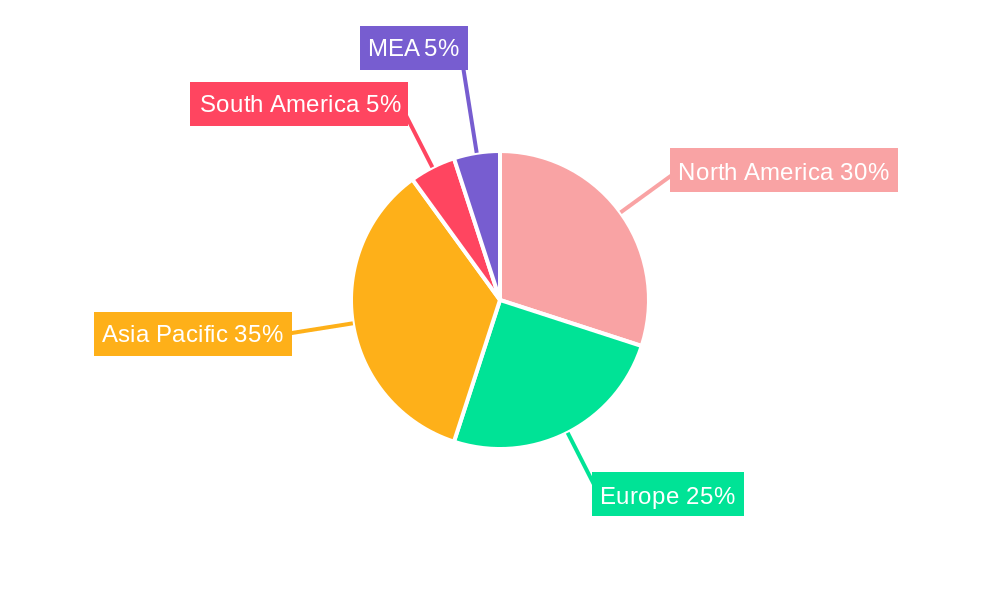
Ceramic Tableware Market Regional Market Share
Geographic Coverage of Ceramic Tableware Market
Ceramic Tableware Market REPORT HIGHLIGHTS
| Aspects | Details |
|---|---|
| Study Period | 2020-2034 |
| Base Year | 2025 |
| Estimated Year | 2026 |
| Forecast Period | 2026-2034 |
| Historical Period | 2020-2025 |
| Growth Rate | CAGR of 6.21% from 2020-2034 |
| Segmentation |
|
Table of Contents
- 1. Introduction
- 1.1. Research Scope
- 1.2. Market Segmentation
- 1.3. Research Objective
- 1.4. Definitions and Assumptions
- 2. Executive Summary
- 2.1. Market Snapshot
- 3. Market Dynamics
- 3.1. Market Drivers
- 3.2. Market Restrains
- 3.3. Market Trends
- 3.4. Market Opportunities
- 4. Market Factor Analysis
- 4.1. Porters Five Forces
- 4.1.1. Bargaining Power of Suppliers
- 4.1.2. Bargaining Power of Buyers
- 4.1.3. Threat of New Entrants
- 4.1.4. Threat of Substitutes
- 4.1.5. Competitive Rivalry
- 4.2. PESTEL analysis
- 4.3. BCG Analysis
- 4.3.1. Stars (High Growth, High Market Share)
- 4.3.2. Cash Cows (Low Growth, High Market Share)
- 4.3.3. Question Mark (High Growth, Low Market Share)
- 4.3.4. Dogs (Low Growth, Low Market Share)
- 4.4. Ansoff Matrix Analysis
- 4.5. Supply Chain Analysis
- 4.6. Regulatory Landscape
- 4.7. Current Market Potential and Opportunity Assessment (TAM–SAM–SOM Framework)
- 4.8. VDR Analyst Note
- 4.1. Porters Five Forces
- 5. Market Analysis, Insights and Forecast 2021-2033
- 5.1. Market Analysis, Insights and Forecast - by Type
- 5.1.1. Porcelain and Bone China
- 5.1.2. Stoneware (Ceramic)
- 5.1.3. Others
- 5.2. Market Analysis, Insights and Forecast - by End User
- 5.2.1. Household
- 5.2.2. Commercial
- 5.2.2.1. Accommodation and Hospitality Segment
- 5.2.2.2. Food Service Segment
- 5.2.2.3. Others
- 5.3. Market Analysis, Insights and Forecast - by Distribution Channel
- 5.3.1. Supermarkets & Hypermarkets
- 5.3.2. Specialty Stores
- 5.3.3. Wholesalers
- 5.3.4. Online
- 5.3.5. Others
- 5.4. Market Analysis, Insights and Forecast - by Region
- 5.4.1. North America
- 5.4.2. Asia Pacific
- 5.4.3. Europe
- 5.4.4. Latin America
- 5.4.5. Middle East and Africa
- 5.1. Market Analysis, Insights and Forecast - by Type
- 6. Global Ceramic Tableware Market Analysis, Insights and Forecast, 2021-2033
- 6.1. Market Analysis, Insights and Forecast - by Type
- 6.1.1. Porcelain and Bone China
- 6.1.2. Stoneware (Ceramic)
- 6.1.3. Others
- 6.2. Market Analysis, Insights and Forecast - by End User
- 6.2.1. Household
- 6.2.2. Commercial
- 6.2.2.1. Accommodation and Hospitality Segment
- 6.2.2.2. Food Service Segment
- 6.2.2.3. Others
- 6.3. Market Analysis, Insights and Forecast - by Distribution Channel
- 6.3.1. Supermarkets & Hypermarkets
- 6.3.2. Specialty Stores
- 6.3.3. Wholesalers
- 6.3.4. Online
- 6.3.5. Others
- 6.1. Market Analysis, Insights and Forecast - by Type
- 7. North America Ceramic Tableware Market Analysis, Insights and Forecast, 2021-2033
- 7.1. Market Analysis, Insights and Forecast - by Type
- 7.1.1. Porcelain and Bone China
- 7.1.2. Stoneware (Ceramic)
- 7.1.3. Others
- 7.2. Market Analysis, Insights and Forecast - by End User
- 7.2.1. Household
- 7.2.2. Commercial
- 7.2.2.1. Accommodation and Hospitality Segment
- 7.2.2.2. Food Service Segment
- 7.2.2.3. Others
- 7.3. Market Analysis, Insights and Forecast - by Distribution Channel
- 7.3.1. Supermarkets & Hypermarkets
- 7.3.2. Specialty Stores
- 7.3.3. Wholesalers
- 7.3.4. Online
- 7.3.5. Others
- 7.1. Market Analysis, Insights and Forecast - by Type
- 8. Asia Pacific Ceramic Tableware Market Analysis, Insights and Forecast, 2021-2033
- 8.1. Market Analysis, Insights and Forecast - by Type
- 8.1.1. Porcelain and Bone China
- 8.1.2. Stoneware (Ceramic)
- 8.1.3. Others
- 8.2. Market Analysis, Insights and Forecast - by End User
- 8.2.1. Household
- 8.2.2. Commercial
- 8.2.2.1. Accommodation and Hospitality Segment
- 8.2.2.2. Food Service Segment
- 8.2.2.3. Others
- 8.3. Market Analysis, Insights and Forecast - by Distribution Channel
- 8.3.1. Supermarkets & Hypermarkets
- 8.3.2. Specialty Stores
- 8.3.3. Wholesalers
- 8.3.4. Online
- 8.3.5. Others
- 8.1. Market Analysis, Insights and Forecast - by Type
- 9. Europe Ceramic Tableware Market Analysis, Insights and Forecast, 2021-2033
- 9.1. Market Analysis, Insights and Forecast - by Type
- 9.1.1. Porcelain and Bone China
- 9.1.2. Stoneware (Ceramic)
- 9.1.3. Others
- 9.2. Market Analysis, Insights and Forecast - by End User
- 9.2.1. Household
- 9.2.2. Commercial
- 9.2.2.1. Accommodation and Hospitality Segment
- 9.2.2.2. Food Service Segment
- 9.2.2.3. Others
- 9.3. Market Analysis, Insights and Forecast - by Distribution Channel
- 9.3.1. Supermarkets & Hypermarkets
- 9.3.2. Specialty Stores
- 9.3.3. Wholesalers
- 9.3.4. Online
- 9.3.5. Others
- 9.1. Market Analysis, Insights and Forecast - by Type
- 10. Latin America Ceramic Tableware Market Analysis, Insights and Forecast, 2021-2033
- 10.1. Market Analysis, Insights and Forecast - by Type
- 10.1.1. Porcelain and Bone China
- 10.1.2. Stoneware (Ceramic)
- 10.1.3. Others
- 10.2. Market Analysis, Insights and Forecast - by End User
- 10.2.1. Household
- 10.2.2. Commercial
- 10.2.2.1. Accommodation and Hospitality Segment
- 10.2.2.2. Food Service Segment
- 10.2.2.3. Others
- 10.3. Market Analysis, Insights and Forecast - by Distribution Channel
- 10.3.1. Supermarkets & Hypermarkets
- 10.3.2. Specialty Stores
- 10.3.3. Wholesalers
- 10.3.4. Online
- 10.3.5. Others
- 10.1. Market Analysis, Insights and Forecast - by Type
- 11. Middle East and Africa Ceramic Tableware Market Analysis, Insights and Forecast, 2021-2033
- 11.1. Market Analysis, Insights and Forecast - by Type
- 11.1.1. Porcelain and Bone China
- 11.1.2. Stoneware (Ceramic)
- 11.1.3. Others
- 11.2. Market Analysis, Insights and Forecast - by End User
- 11.2.1. Household
- 11.2.2. Commercial
- 11.2.2.1. Accommodation and Hospitality Segment
- 11.2.2.2. Food Service Segment
- 11.2.2.3. Others
- 11.3. Market Analysis, Insights and Forecast - by Distribution Channel
- 11.3.1. Supermarkets & Hypermarkets
- 11.3.2. Specialty Stores
- 11.3.3. Wholesalers
- 11.3.4. Online
- 11.3.5. Others
- 11.1. Market Analysis, Insights and Forecast - by Type
- 12. Competitive Analysis
- 12.1. Company Profiles
- 12.1.1 Portmeirion Group PLC
- 12.1.1.1. Company Overview
- 12.1.1.2. Products
- 12.1.1.3. Company Financials
- 12.1.1.4. SWOT Analysis
- 12.1.2 The Oneida Group
- 12.1.2.1. Company Overview
- 12.1.2.2. Products
- 12.1.2.3. Company Financials
- 12.1.2.4. SWOT Analysis
- 12.1.3 Rosenthal GmbH
- 12.1.3.1. Company Overview
- 12.1.3.2. Products
- 12.1.3.3. Company Financials
- 12.1.3.4. SWOT Analysis
- 12.1.4 Lenox
- 12.1.4.1. Company Overview
- 12.1.4.2. Products
- 12.1.4.3. Company Financials
- 12.1.4.4. SWOT Analysis
- 12.1.5 Meissen
- 12.1.5.1. Company Overview
- 12.1.5.2. Products
- 12.1.5.3. Company Financials
- 12.1.5.4. SWOT Analysis
- 12.1.6 Libbey
- 12.1.6.1. Company Overview
- 12.1.6.2. Products
- 12.1.6.3. Company Financials
- 12.1.6.4. SWOT Analysis
- 12.1.7 Seltmann Weiden
- 12.1.7.1. Company Overview
- 12.1.7.2. Products
- 12.1.7.3. Company Financials
- 12.1.7.4. SWOT Analysis
- 12.1.8 RAK Porcelain
- 12.1.8.1. Company Overview
- 12.1.8.2. Products
- 12.1.8.3. Company Financials
- 12.1.8.4. SWOT Analysis
- 12.1.9 Narumi
- 12.1.9.1. Company Overview
- 12.1.9.2. Products
- 12.1.9.3. Company Financials
- 12.1.9.4. SWOT Analysis
- 12.1.10 KAHLA Porzellan
- 12.1.10.1. Company Overview
- 12.1.10.2. Products
- 12.1.10.3. Company Financials
- 12.1.10.4. SWOT Analysis
- 12.1.11 WMF
- 12.1.11.1. Company Overview
- 12.1.11.2. Products
- 12.1.11.3. Company Financials
- 12.1.11.4. SWOT Analysis
- 12.1.12 SCHONWALD
- 12.1.12.1. Company Overview
- 12.1.12.2. Products
- 12.1.12.3. Company Financials
- 12.1.12.4. SWOT Analysis
- 12.1.13 Churchill China
- 12.1.13.1. Company Overview
- 12.1.13.2. Products
- 12.1.13.3. Company Financials
- 12.1.13.4. SWOT Analysis
- 12.1.14 Villeroy & Boch
- 12.1.14.1. Company Overview
- 12.1.14.2. Products
- 12.1.14.3. Company Financials
- 12.1.14.4. SWOT Analysis
- 12.1.15 TATA ceramics
- 12.1.15.1. Company Overview
- 12.1.15.2. Products
- 12.1.15.3. Company Financials
- 12.1.15.4. SWOT Analysis
- 12.1.16 Sitong Group
- 12.1.16.1. Company Overview
- 12.1.16.2. Products
- 12.1.16.3. Company Financials
- 12.1.16.4. SWOT Analysis
- 12.1.17 Fiskars Group
- 12.1.17.1. Company Overview
- 12.1.17.2. Products
- 12.1.17.3. Company Financials
- 12.1.17.4. SWOT Analysis
- 12.1.1 Portmeirion Group PLC
- 12.2. Market Entropy
- 12.2.1 Company's Key Areas Served
- 12.2.2 Recent Developments
- 12.3. Company Market Share Analysis 2025
- 12.3.1 Top 5 Companies Market Share Analysis
- 12.3.2 Top 3 Companies Market Share Analysis
- 12.4. List of Potential Customers
- 13. Research Methodology
List of Figures
- Figure 1: Global Ceramic Tableware Market Revenue Breakdown (Million, %) by Region 2025 & 2033
- Figure 2: Global Ceramic Tableware Market Volume Breakdown (K Unit, %) by Region 2025 & 2033
- Figure 3: North America Ceramic Tableware Market Revenue (Million), by Type 2025 & 2033
- Figure 4: North America Ceramic Tableware Market Volume (K Unit), by Type 2025 & 2033
- Figure 5: North America Ceramic Tableware Market Revenue Share (%), by Type 2025 & 2033
- Figure 6: North America Ceramic Tableware Market Volume Share (%), by Type 2025 & 2033
- Figure 7: North America Ceramic Tableware Market Revenue (Million), by End User 2025 & 2033
- Figure 8: North America Ceramic Tableware Market Volume (K Unit), by End User 2025 & 2033
- Figure 9: North America Ceramic Tableware Market Revenue Share (%), by End User 2025 & 2033
- Figure 10: North America Ceramic Tableware Market Volume Share (%), by End User 2025 & 2033
- Figure 11: North America Ceramic Tableware Market Revenue (Million), by Distribution Channel 2025 & 2033
- Figure 12: North America Ceramic Tableware Market Volume (K Unit), by Distribution Channel 2025 & 2033
- Figure 13: North America Ceramic Tableware Market Revenue Share (%), by Distribution Channel 2025 & 2033
- Figure 14: North America Ceramic Tableware Market Volume Share (%), by Distribution Channel 2025 & 2033
- Figure 15: North America Ceramic Tableware Market Revenue (Million), by Country 2025 & 2033
- Figure 16: North America Ceramic Tableware Market Volume (K Unit), by Country 2025 & 2033
- Figure 17: North America Ceramic Tableware Market Revenue Share (%), by Country 2025 & 2033
- Figure 18: North America Ceramic Tableware Market Volume Share (%), by Country 2025 & 2033
- Figure 19: Asia Pacific Ceramic Tableware Market Revenue (Million), by Type 2025 & 2033
- Figure 20: Asia Pacific Ceramic Tableware Market Volume (K Unit), by Type 2025 & 2033
- Figure 21: Asia Pacific Ceramic Tableware Market Revenue Share (%), by Type 2025 & 2033
- Figure 22: Asia Pacific Ceramic Tableware Market Volume Share (%), by Type 2025 & 2033
- Figure 23: Asia Pacific Ceramic Tableware Market Revenue (Million), by End User 2025 & 2033
- Figure 24: Asia Pacific Ceramic Tableware Market Volume (K Unit), by End User 2025 & 2033
- Figure 25: Asia Pacific Ceramic Tableware Market Revenue Share (%), by End User 2025 & 2033
- Figure 26: Asia Pacific Ceramic Tableware Market Volume Share (%), by End User 2025 & 2033
- Figure 27: Asia Pacific Ceramic Tableware Market Revenue (Million), by Distribution Channel 2025 & 2033
- Figure 28: Asia Pacific Ceramic Tableware Market Volume (K Unit), by Distribution Channel 2025 & 2033
- Figure 29: Asia Pacific Ceramic Tableware Market Revenue Share (%), by Distribution Channel 2025 & 2033
- Figure 30: Asia Pacific Ceramic Tableware Market Volume Share (%), by Distribution Channel 2025 & 2033
- Figure 31: Asia Pacific Ceramic Tableware Market Revenue (Million), by Country 2025 & 2033
- Figure 32: Asia Pacific Ceramic Tableware Market Volume (K Unit), by Country 2025 & 2033
- Figure 33: Asia Pacific Ceramic Tableware Market Revenue Share (%), by Country 2025 & 2033
- Figure 34: Asia Pacific Ceramic Tableware Market Volume Share (%), by Country 2025 & 2033
- Figure 35: Europe Ceramic Tableware Market Revenue (Million), by Type 2025 & 2033
- Figure 36: Europe Ceramic Tableware Market Volume (K Unit), by Type 2025 & 2033
- Figure 37: Europe Ceramic Tableware Market Revenue Share (%), by Type 2025 & 2033
- Figure 38: Europe Ceramic Tableware Market Volume Share (%), by Type 2025 & 2033
- Figure 39: Europe Ceramic Tableware Market Revenue (Million), by End User 2025 & 2033
- Figure 40: Europe Ceramic Tableware Market Volume (K Unit), by End User 2025 & 2033
- Figure 41: Europe Ceramic Tableware Market Revenue Share (%), by End User 2025 & 2033
- Figure 42: Europe Ceramic Tableware Market Volume Share (%), by End User 2025 & 2033
- Figure 43: Europe Ceramic Tableware Market Revenue (Million), by Distribution Channel 2025 & 2033
- Figure 44: Europe Ceramic Tableware Market Volume (K Unit), by Distribution Channel 2025 & 2033
- Figure 45: Europe Ceramic Tableware Market Revenue Share (%), by Distribution Channel 2025 & 2033
- Figure 46: Europe Ceramic Tableware Market Volume Share (%), by Distribution Channel 2025 & 2033
- Figure 47: Europe Ceramic Tableware Market Revenue (Million), by Country 2025 & 2033
- Figure 48: Europe Ceramic Tableware Market Volume (K Unit), by Country 2025 & 2033
- Figure 49: Europe Ceramic Tableware Market Revenue Share (%), by Country 2025 & 2033
- Figure 50: Europe Ceramic Tableware Market Volume Share (%), by Country 2025 & 2033
- Figure 51: Latin America Ceramic Tableware Market Revenue (Million), by Type 2025 & 2033
- Figure 52: Latin America Ceramic Tableware Market Volume (K Unit), by Type 2025 & 2033
- Figure 53: Latin America Ceramic Tableware Market Revenue Share (%), by Type 2025 & 2033
- Figure 54: Latin America Ceramic Tableware Market Volume Share (%), by Type 2025 & 2033
- Figure 55: Latin America Ceramic Tableware Market Revenue (Million), by End User 2025 & 2033
- Figure 56: Latin America Ceramic Tableware Market Volume (K Unit), by End User 2025 & 2033
- Figure 57: Latin America Ceramic Tableware Market Revenue Share (%), by End User 2025 & 2033
- Figure 58: Latin America Ceramic Tableware Market Volume Share (%), by End User 2025 & 2033
- Figure 59: Latin America Ceramic Tableware Market Revenue (Million), by Distribution Channel 2025 & 2033
- Figure 60: Latin America Ceramic Tableware Market Volume (K Unit), by Distribution Channel 2025 & 2033
- Figure 61: Latin America Ceramic Tableware Market Revenue Share (%), by Distribution Channel 2025 & 2033
- Figure 62: Latin America Ceramic Tableware Market Volume Share (%), by Distribution Channel 2025 & 2033
- Figure 63: Latin America Ceramic Tableware Market Revenue (Million), by Country 2025 & 2033
- Figure 64: Latin America Ceramic Tableware Market Volume (K Unit), by Country 2025 & 2033
- Figure 65: Latin America Ceramic Tableware Market Revenue Share (%), by Country 2025 & 2033
- Figure 66: Latin America Ceramic Tableware Market Volume Share (%), by Country 2025 & 2033
- Figure 67: Middle East and Africa Ceramic Tableware Market Revenue (Million), by Type 2025 & 2033
- Figure 68: Middle East and Africa Ceramic Tableware Market Volume (K Unit), by Type 2025 & 2033
- Figure 69: Middle East and Africa Ceramic Tableware Market Revenue Share (%), by Type 2025 & 2033
- Figure 70: Middle East and Africa Ceramic Tableware Market Volume Share (%), by Type 2025 & 2033
- Figure 71: Middle East and Africa Ceramic Tableware Market Revenue (Million), by End User 2025 & 2033
- Figure 72: Middle East and Africa Ceramic Tableware Market Volume (K Unit), by End User 2025 & 2033
- Figure 73: Middle East and Africa Ceramic Tableware Market Revenue Share (%), by End User 2025 & 2033
- Figure 74: Middle East and Africa Ceramic Tableware Market Volume Share (%), by End User 2025 & 2033
- Figure 75: Middle East and Africa Ceramic Tableware Market Revenue (Million), by Distribution Channel 2025 & 2033
- Figure 76: Middle East and Africa Ceramic Tableware Market Volume (K Unit), by Distribution Channel 2025 & 2033
- Figure 77: Middle East and Africa Ceramic Tableware Market Revenue Share (%), by Distribution Channel 2025 & 2033
- Figure 78: Middle East and Africa Ceramic Tableware Market Volume Share (%), by Distribution Channel 2025 & 2033
- Figure 79: Middle East and Africa Ceramic Tableware Market Revenue (Million), by Country 2025 & 2033
- Figure 80: Middle East and Africa Ceramic Tableware Market Volume (K Unit), by Country 2025 & 2033
- Figure 81: Middle East and Africa Ceramic Tableware Market Revenue Share (%), by Country 2025 & 2033
- Figure 82: Middle East and Africa Ceramic Tableware Market Volume Share (%), by Country 2025 & 2033
List of Tables
- Table 1: Global Ceramic Tableware Market Revenue Million Forecast, by Type 2020 & 2033
- Table 2: Global Ceramic Tableware Market Volume K Unit Forecast, by Type 2020 & 2033
- Table 3: Global Ceramic Tableware Market Revenue Million Forecast, by End User 2020 & 2033
- Table 4: Global Ceramic Tableware Market Volume K Unit Forecast, by End User 2020 & 2033
- Table 5: Global Ceramic Tableware Market Revenue Million Forecast, by Distribution Channel 2020 & 2033
- Table 6: Global Ceramic Tableware Market Volume K Unit Forecast, by Distribution Channel 2020 & 2033
- Table 7: Global Ceramic Tableware Market Revenue Million Forecast, by Region 2020 & 2033
- Table 8: Global Ceramic Tableware Market Volume K Unit Forecast, by Region 2020 & 2033
- Table 9: Global Ceramic Tableware Market Revenue Million Forecast, by Type 2020 & 2033
- Table 10: Global Ceramic Tableware Market Volume K Unit Forecast, by Type 2020 & 2033
- Table 11: Global Ceramic Tableware Market Revenue Million Forecast, by End User 2020 & 2033
- Table 12: Global Ceramic Tableware Market Volume K Unit Forecast, by End User 2020 & 2033
- Table 13: Global Ceramic Tableware Market Revenue Million Forecast, by Distribution Channel 2020 & 2033
- Table 14: Global Ceramic Tableware Market Volume K Unit Forecast, by Distribution Channel 2020 & 2033
- Table 15: Global Ceramic Tableware Market Revenue Million Forecast, by Country 2020 & 2033
- Table 16: Global Ceramic Tableware Market Volume K Unit Forecast, by Country 2020 & 2033
- Table 17: Global Ceramic Tableware Market Revenue Million Forecast, by Type 2020 & 2033
- Table 18: Global Ceramic Tableware Market Volume K Unit Forecast, by Type 2020 & 2033
- Table 19: Global Ceramic Tableware Market Revenue Million Forecast, by End User 2020 & 2033
- Table 20: Global Ceramic Tableware Market Volume K Unit Forecast, by End User 2020 & 2033
- Table 21: Global Ceramic Tableware Market Revenue Million Forecast, by Distribution Channel 2020 & 2033
- Table 22: Global Ceramic Tableware Market Volume K Unit Forecast, by Distribution Channel 2020 & 2033
- Table 23: Global Ceramic Tableware Market Revenue Million Forecast, by Country 2020 & 2033
- Table 24: Global Ceramic Tableware Market Volume K Unit Forecast, by Country 2020 & 2033
- Table 25: Global Ceramic Tableware Market Revenue Million Forecast, by Type 2020 & 2033
- Table 26: Global Ceramic Tableware Market Volume K Unit Forecast, by Type 2020 & 2033
- Table 27: Global Ceramic Tableware Market Revenue Million Forecast, by End User 2020 & 2033
- Table 28: Global Ceramic Tableware Market Volume K Unit Forecast, by End User 2020 & 2033
- Table 29: Global Ceramic Tableware Market Revenue Million Forecast, by Distribution Channel 2020 & 2033
- Table 30: Global Ceramic Tableware Market Volume K Unit Forecast, by Distribution Channel 2020 & 2033
- Table 31: Global Ceramic Tableware Market Revenue Million Forecast, by Country 2020 & 2033
- Table 32: Global Ceramic Tableware Market Volume K Unit Forecast, by Country 2020 & 2033
- Table 33: Global Ceramic Tableware Market Revenue Million Forecast, by Type 2020 & 2033
- Table 34: Global Ceramic Tableware Market Volume K Unit Forecast, by Type 2020 & 2033
- Table 35: Global Ceramic Tableware Market Revenue Million Forecast, by End User 2020 & 2033
- Table 36: Global Ceramic Tableware Market Volume K Unit Forecast, by End User 2020 & 2033
- Table 37: Global Ceramic Tableware Market Revenue Million Forecast, by Distribution Channel 2020 & 2033
- Table 38: Global Ceramic Tableware Market Volume K Unit Forecast, by Distribution Channel 2020 & 2033
- Table 39: Global Ceramic Tableware Market Revenue Million Forecast, by Country 2020 & 2033
- Table 40: Global Ceramic Tableware Market Volume K Unit Forecast, by Country 2020 & 2033
- Table 41: Global Ceramic Tableware Market Revenue Million Forecast, by Type 2020 & 2033
- Table 42: Global Ceramic Tableware Market Volume K Unit Forecast, by Type 2020 & 2033
- Table 43: Global Ceramic Tableware Market Revenue Million Forecast, by End User 2020 & 2033
- Table 44: Global Ceramic Tableware Market Volume K Unit Forecast, by End User 2020 & 2033
- Table 45: Global Ceramic Tableware Market Revenue Million Forecast, by Distribution Channel 2020 & 2033
- Table 46: Global Ceramic Tableware Market Volume K Unit Forecast, by Distribution Channel 2020 & 2033
- Table 47: Global Ceramic Tableware Market Revenue Million Forecast, by Country 2020 & 2033
- Table 48: Global Ceramic Tableware Market Volume K Unit Forecast, by Country 2020 & 2033
Frequently Asked Questions
1. What is the projected Compound Annual Growth Rate (CAGR) of the Ceramic Tableware Market?
The projected CAGR is approximately 6.21%.
2. Which companies are prominent players in the Ceramic Tableware Market?
Key companies in the market include Portmeirion Group PLC, The Oneida Group, Rosenthal GmbH, Lenox, Meissen, Libbey, Seltmann Weiden, RAK Porcelain, Narumi, KAHLA Porzellan, WMF, SCHONWALD, Churchill China, Villeroy & Boch, TATA ceramics, Sitong Group, Fiskars Group.
3. What are the main segments of the Ceramic Tableware Market?
The market segments include Type, End User, Distribution Channel.
4. Can you provide details about the market size?
The market size is estimated to be USD 58.29 Million as of 2022.
5. What are some drivers contributing to market growth?
Increasing Demand for Office Supplies; Growing E-commerce Trends.
6. What are the notable trends driving market growth?
Rapid Growth of Online Sales is Driving the Market.
7. Are there any restraints impacting market growth?
Increasing Digitization of Work and Communication.
8. Can you provide examples of recent developments in the market?
N/A
9. What pricing options are available for accessing the report?
Pricing options include single-user, multi-user, and enterprise licenses priced at USD 4750, USD 5250, and USD 8750 respectively.
10. Is the market size provided in terms of value or volume?
The market size is provided in terms of value, measured in Million and volume, measured in K Unit.
11. Are there any specific market keywords associated with the report?
Yes, the market keyword associated with the report is "Ceramic Tableware Market," which aids in identifying and referencing the specific market segment covered.
12. How do I determine which pricing option suits my needs best?
The pricing options vary based on user requirements and access needs. Individual users may opt for single-user licenses, while businesses requiring broader access may choose multi-user or enterprise licenses for cost-effective access to the report.
13. Are there any additional resources or data provided in the Ceramic Tableware Market report?
While the report offers comprehensive insights, it's advisable to review the specific contents or supplementary materials provided to ascertain if additional resources or data are available.
14. How can I stay updated on further developments or reports in the Ceramic Tableware Market?
To stay informed about further developments, trends, and reports in the Ceramic Tableware Market, consider subscribing to industry newsletters, following relevant companies and organizations, or regularly checking reputable industry news sources and publications.
Methodology
Step 1 - Identification of Relevant Samples Size from Population Database


Step 2 - Approaches for Defining Global Market Size (Value, Volume* & Price*)

Note*: In applicable scenarios
Step 3 - Data Sources
Primary Research
- Web Analytics
- Survey Reports
- Research Institute
- Latest Research Reports
- Opinion Leaders
Secondary Research
- Annual Reports
- White Paper
- Latest Press Release
- Industry Association
- Paid Database
- Investor Presentations

Step 4 - Data Triangulation
Involves using different sources of information in order to increase the validity of a study
These sources are likely to be stakeholders in a program - participants, other researchers, program staff, other community members, and so on.
Then we put all data in single framework & apply various statistical tools to find out the dynamic on the market.
During the analysis stage, feedback from the stakeholder groups would be compared to determine areas of agreement as well as areas of divergence