

Key Insights
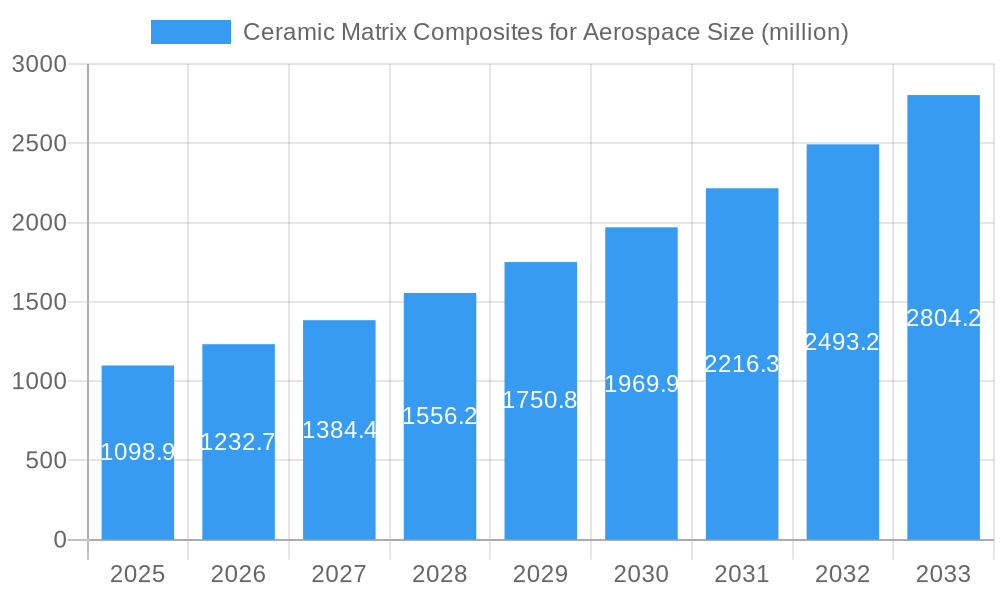
The global Ceramic Matrix Composites (CMCs) for Aerospace market is poised for significant growth, projected to reach $1098.9 million in 2025 and experience a Compound Annual Growth Rate (CAGR) of 12.1% from 2025 to 2033. This robust expansion is driven primarily by the increasing demand for lightweight, high-temperature resistant materials in next-generation aircraft engines and other aerospace applications. The inherent advantages of CMCs, including superior strength-to-weight ratios, excellent thermal shock resistance, and enhanced oxidation resistance compared to traditional metallic components, are fueling their adoption. Key trends shaping the market include advancements in manufacturing techniques, such as chemical vapor infiltration (CVI) and polymer-derived ceramic (PDC) methods, enabling the production of more complex and high-performance components. Further driving growth is the rising focus on fuel efficiency and reduced emissions within the aerospace sector, making CMCs a crucial material for achieving sustainability goals. While challenges such as high manufacturing costs and potential brittleness remain, ongoing research and development efforts are addressing these limitations, paving the way for broader CMC adoption.
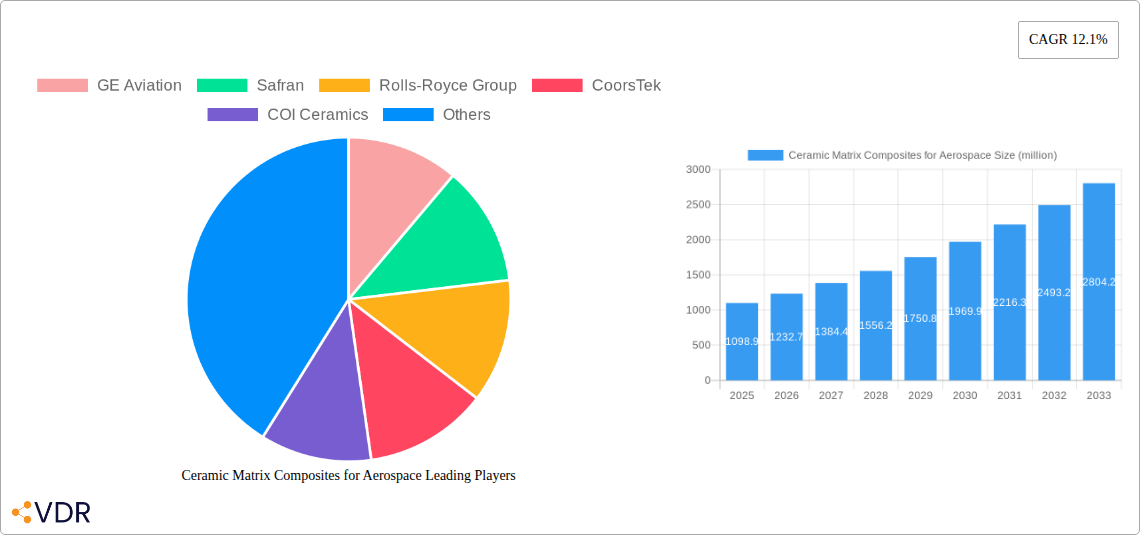
Ceramic Matrix Composites for Aerospace Market Size (In Billion)
The competitive landscape features established players like GE Aviation, Safran, and Rolls-Royce Group, alongside specialized ceramics manufacturers such as CoorsTek and COI Ceramics. These companies are actively investing in research and development to improve the performance and cost-effectiveness of CMCs. The market is segmented geographically, with North America and Europe currently holding substantial market share due to the presence of major aerospace manufacturers and established supply chains. However, the Asia-Pacific region is expected to witness significant growth in the coming years, fueled by rising investments in aerospace infrastructure and manufacturing capabilities in countries like China and India. The forecast period, extending to 2033, anticipates continued strong growth, driven by sustained technological advancements, increasing demand for high-performance aerospace components, and a growing focus on sustainability within the industry.
Ceramic Matrix Composites for Aerospace Company Market Share
Ceramic Matrix Composites for Aerospace Market Report: 2019-2033
A comprehensive analysis of the Ceramic Matrix Composites (CMCs) market in the aerospace industry, offering invaluable insights for industry professionals, investors, and strategic decision-makers. This report provides a detailed examination of market dynamics, growth trends, regional analysis, competitive landscape, and future outlook for CMCs in aerospace applications. The study period covers 2019-2033, with a base year of 2025 and a forecast period of 2025-2033. The market value is presented in millions of USD.
Ceramic Matrix Composites for Aerospace Market Dynamics & Structure
This section delves into the intricate dynamics of the Ceramic Matrix Composites for Aerospace market, encompassing market concentration, technological advancements, regulatory landscapes, competitive substitutions, end-user demographics, and mergers & acquisitions (M&A) activities. The global market size in 2025 is estimated at $xx million and is projected to reach $xx million by 2033, exhibiting a CAGR of xx%.
Market Concentration: The market is moderately concentrated, with key players holding significant market share. GE Aviation and Safran together account for approximately xx% of the market. Smaller players like CoorsTek and Ultramet focus on niche applications and specialized components.
Technological Innovation: Ongoing R&D focuses on enhancing CMCs' high-temperature strength, oxidation resistance, and damage tolerance. Innovations in manufacturing techniques, such as chemical vapor infiltration (CVI) and polymer-derived ceramics (PDCs), are driving growth.
Regulatory Framework: Stringent safety and certification standards imposed by regulatory bodies like the FAA and EASA influence material selection and adoption rates. These regulations push for continuous improvement in CMC performance and reliability.
Competitive Substitutes: Metallic alloys and other advanced composites pose competitive challenges. However, CMCs offer unique advantages in high-temperature environments, making them irreplaceable in certain applications.
End-User Demographics: The primary end-users are major aerospace OEMs (Original Equipment Manufacturers) and Tier 1 suppliers. The growth of the commercial aerospace sector fuels demand for lightweight and high-performance CMC components.
M&A Trends: The past five years have witnessed xx M&A deals in the CMC aerospace sector, driven by the need for technological integration and market expansion. These transactions consolidate industry expertise and resources. Innovation barriers include high manufacturing costs, complex processing techniques and achieving consistent quality.
Ceramic Matrix Composites for Aerospace Growth Trends & Insights
This section provides a detailed analysis of the market's growth trajectory, adoption rates, technological disruptions, and evolving consumer behavior. Data from industry reports, company filings, and expert interviews were used to create this analysis. Utilizing a variety of statistical modelling techniques, including regression analysis and time-series forecasting, we projected a robust and comprehensive market outlook for CMCs in the aerospace industry. The total addressable market (TAM) is projected to grow from $xx million in 2025 to $xx million by 2033.
The significant increase is driven by the increasing demand for fuel-efficient aircraft, the rising adoption of CMCs in next-generation engines, and advancements in manufacturing technologies. The adoption rate is expected to increase significantly with improved cost-effectiveness and reliability. The market is anticipated to witness a significant transformation due to the growing integration of artificial intelligence (AI) and machine learning (ML) in CMC component design and production. Furthermore, the shift towards sustainable aviation fuels (SAFs) and the rising demand for lightweight aircraft structures are key factors contributing to the growth of the CMC aerospace market. The penetration rate in 2025 is estimated at xx%, rising to xx% by 2033.
Dominant Regions, Countries, or Segments in Ceramic Matrix Composites for Aerospace
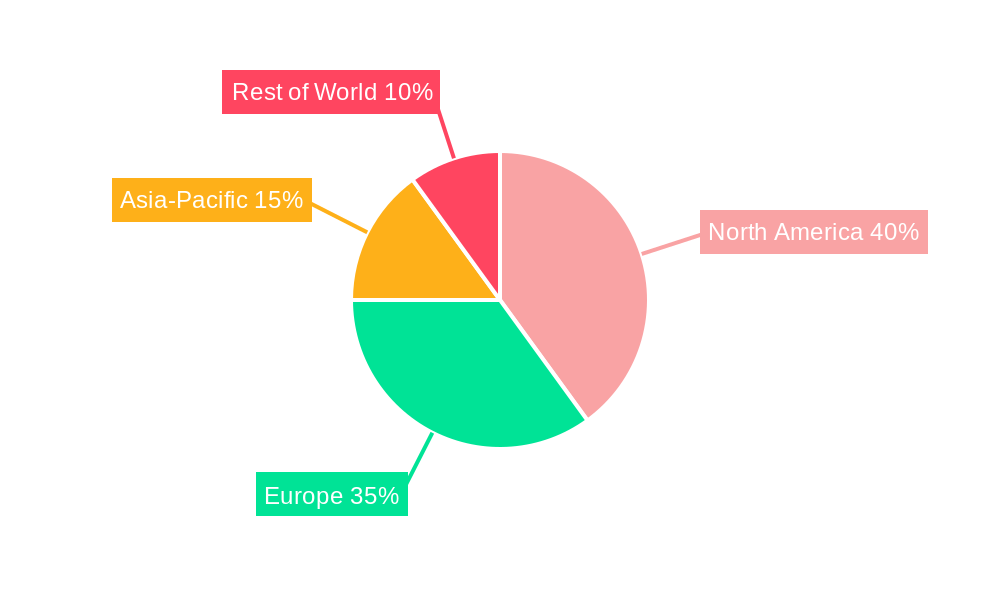
North America currently holds the largest market share, driven by strong aerospace manufacturing capabilities and substantial R&D investments. Europe follows closely, with significant contributions from established aerospace players. The Asia-Pacific region is anticipated to experience the highest growth rate over the forecast period, fueled by expansion in the commercial aviation sector.
North America: Strong presence of major aerospace OEMs, robust R&D ecosystem, and government support for advanced materials development.
Europe: Well-established aerospace industry, substantial government funding for R&D, and presence of key CMC material suppliers.
Asia-Pacific: Rapid growth in commercial aviation, increasing demand for fuel-efficient aircraft, and government initiatives promoting technological advancement.
The dominance of North America stems from the presence of major aerospace OEMs like Boeing and Lockheed Martin, coupled with strong government support for advanced materials research. Europe benefits from its robust aerospace industry and a strong technological base. The Asia-Pacific region is poised for rapid growth, primarily driven by the expansion of the commercial aviation sector in countries like China and India.
Ceramic Matrix Composites for Aerospace Product Landscape
CMCs find applications in various aerospace components, including turbine engine components (stators, combustors, and hot gas path components), hypersonic vehicle structures, and rocket nozzles. Continuous advancements in CMC processing and design lead to improved performance metrics. Unique selling propositions include higher temperature capabilities, reduced weight, and increased engine efficiency compared to traditional materials. Advanced CMC designs are exhibiting enhanced durability, allowing for extended component lifespans.
Key Drivers, Barriers & Challenges in Ceramic Matrix Composites for Aerospace
Key Drivers:
- Rising demand for fuel-efficient aircraft.
- Increasing adoption of CMCs in next-generation engines.
- Advancements in manufacturing technologies (e.g., CVI, PDCs).
- Government support and investments in advanced materials research.
Key Challenges:
- High manufacturing costs significantly restrict broader adoption.
- Complex processing and quality control are limiting factors for scalability.
- Limited supply chain infrastructure for CMC components.
- Durability and reliability concerns in real-world applications. Estimated cost reduction of xx% is needed for wider adoption by 2033.
Emerging Opportunities in Ceramic Matrix Composites for Aerospace
- Development of high-performance CMCs for hypersonic flight applications.
- Expansion into emerging markets with growing aerospace sectors (e.g., India, China).
- Exploring novel applications for CMCs beyond engine components (e.g., lightweight airframes).
- Utilizing additive manufacturing techniques to create complex CMC parts.
Growth Accelerators in the Ceramic Matrix Composites for Aerospace Industry
Long-term growth is fueled by advancements in material science, leading to CMCs with enhanced properties and reduced production costs. Strategic partnerships between material suppliers and aerospace OEMs accelerate innovation and market penetration. Government investments in research and development further catalyze the growth trajectory of the CMC market in aerospace.
Key Players Shaping the Ceramic Matrix Composites for Aerospace Market
- GE Aviation
- Safran
- Rolls-Royce Group
- CoorsTek
- COI Ceramics
- BJS Ceramics GmbH
- Composites Horizons
- Ultramet
- WPX Faser Keramik
- Applied Thin Films
- Walter E. C. Pritzkow Spezialkeramik
Notable Milestones in Ceramic Matrix Composites for Aerospace Sector
- 2020: GE Aviation successfully completed flight testing of a CMC component in a commercial aircraft engine.
- 2022: Safran announced the development of a new CMC manufacturing process, improving production efficiency.
- 2023: Rolls-Royce initiated a joint venture to accelerate CMC component development for future engine programs.
In-Depth Ceramic Matrix Composites for Aerospace Market Outlook
The future of CMCs in aerospace is promising, with significant growth potential driven by ongoing technological advancements and rising demand for fuel-efficient aircraft. Strategic partnerships, coupled with increased investment in R&D, will further accelerate market expansion and wider adoption. The market is poised for substantial growth, offering lucrative opportunities for industry stakeholders who proactively adapt to the evolving landscape.
Ceramic Matrix Composites for Aerospace Segmentation
-
1. Application
- 1.1. Commercial
- 1.2. Military
-
2. Types
- 2.1. Oxide
- 2.2. Silicon Carbide
- 2.3. Carbon
- 2.4. Others
Ceramic Matrix Composites for Aerospace Segmentation By Geography
-
1. North America
- 1.1. United States
- 1.2. Canada
- 1.3. Mexico
-
2. South America
- 2.1. Brazil
- 2.2. Argentina
- 2.3. Rest of South America
-
3. Europe
- 3.1. United Kingdom
- 3.2. Germany
- 3.3. France
- 3.4. Italy
- 3.5. Spain
- 3.6. Russia
- 3.7. Benelux
- 3.8. Nordics
- 3.9. Rest of Europe
-
4. Middle East & Africa
- 4.1. Turkey
- 4.2. Israel
- 4.3. GCC
- 4.4. North Africa
- 4.5. South Africa
- 4.6. Rest of Middle East & Africa
-
5. Asia Pacific
- 5.1. China
- 5.2. India
- 5.3. Japan
- 5.4. South Korea
- 5.5. ASEAN
- 5.6. Oceania
- 5.7. Rest of Asia Pacific
Ceramic Matrix Composites for Aerospace Regional Market Share
Geographic Coverage of Ceramic Matrix Composites for Aerospace
Ceramic Matrix Composites for Aerospace REPORT HIGHLIGHTS
| Aspects | Details |
|---|---|
| Study Period | 2020-2034 |
| Base Year | 2025 |
| Estimated Year | 2026 |
| Forecast Period | 2026-2034 |
| Historical Period | 2020-2025 |
| Growth Rate | CAGR of 12.1% from 2020-2034 |
| Segmentation |
|
Table of Contents
- 1. Introduction
- 1.1. Research Scope
- 1.2. Market Segmentation
- 1.3. Research Methodology
- 1.4. Definitions and Assumptions
- 2. Executive Summary
- 2.1. Introduction
- 3. Market Dynamics
- 3.1. Introduction
- 3.2. Market Drivers
- 3.3. Market Restrains
- 3.4. Market Trends
- 4. Market Factor Analysis
- 4.1. Porters Five Forces
- 4.2. Supply/Value Chain
- 4.3. PESTEL analysis
- 4.4. Market Entropy
- 4.5. Patent/Trademark Analysis
- 5. Global Ceramic Matrix Composites for Aerospace Analysis, Insights and Forecast, 2020-2032
- 5.1. Market Analysis, Insights and Forecast - by Application
- 5.1.1. Commercial
- 5.1.2. Military
- 5.2. Market Analysis, Insights and Forecast - by Types
- 5.2.1. Oxide
- 5.2.2. Silicon Carbide
- 5.2.3. Carbon
- 5.2.4. Others
- 5.3. Market Analysis, Insights and Forecast - by Region
- 5.3.1. North America
- 5.3.2. South America
- 5.3.3. Europe
- 5.3.4. Middle East & Africa
- 5.3.5. Asia Pacific
- 5.1. Market Analysis, Insights and Forecast - by Application
- 6. North America Ceramic Matrix Composites for Aerospace Analysis, Insights and Forecast, 2020-2032
- 6.1. Market Analysis, Insights and Forecast - by Application
- 6.1.1. Commercial
- 6.1.2. Military
- 6.2. Market Analysis, Insights and Forecast - by Types
- 6.2.1. Oxide
- 6.2.2. Silicon Carbide
- 6.2.3. Carbon
- 6.2.4. Others
- 6.1. Market Analysis, Insights and Forecast - by Application
- 7. South America Ceramic Matrix Composites for Aerospace Analysis, Insights and Forecast, 2020-2032
- 7.1. Market Analysis, Insights and Forecast - by Application
- 7.1.1. Commercial
- 7.1.2. Military
- 7.2. Market Analysis, Insights and Forecast - by Types
- 7.2.1. Oxide
- 7.2.2. Silicon Carbide
- 7.2.3. Carbon
- 7.2.4. Others
- 7.1. Market Analysis, Insights and Forecast - by Application
- 8. Europe Ceramic Matrix Composites for Aerospace Analysis, Insights and Forecast, 2020-2032
- 8.1. Market Analysis, Insights and Forecast - by Application
- 8.1.1. Commercial
- 8.1.2. Military
- 8.2. Market Analysis, Insights and Forecast - by Types
- 8.2.1. Oxide
- 8.2.2. Silicon Carbide
- 8.2.3. Carbon
- 8.2.4. Others
- 8.1. Market Analysis, Insights and Forecast - by Application
- 9. Middle East & Africa Ceramic Matrix Composites for Aerospace Analysis, Insights and Forecast, 2020-2032
- 9.1. Market Analysis, Insights and Forecast - by Application
- 9.1.1. Commercial
- 9.1.2. Military
- 9.2. Market Analysis, Insights and Forecast - by Types
- 9.2.1. Oxide
- 9.2.2. Silicon Carbide
- 9.2.3. Carbon
- 9.2.4. Others
- 9.1. Market Analysis, Insights and Forecast - by Application
- 10. Asia Pacific Ceramic Matrix Composites for Aerospace Analysis, Insights and Forecast, 2020-2032
- 10.1. Market Analysis, Insights and Forecast - by Application
- 10.1.1. Commercial
- 10.1.2. Military
- 10.2. Market Analysis, Insights and Forecast - by Types
- 10.2.1. Oxide
- 10.2.2. Silicon Carbide
- 10.2.3. Carbon
- 10.2.4. Others
- 10.1. Market Analysis, Insights and Forecast - by Application
- 11. Competitive Analysis
- 11.1. Global Market Share Analysis 2025
- 11.2. Company Profiles
- 11.2.1 GE Aviation
- 11.2.1.1. Overview
- 11.2.1.2. Products
- 11.2.1.3. SWOT Analysis
- 11.2.1.4. Recent Developments
- 11.2.1.5. Financials (Based on Availability)
- 11.2.2 Safran
- 11.2.2.1. Overview
- 11.2.2.2. Products
- 11.2.2.3. SWOT Analysis
- 11.2.2.4. Recent Developments
- 11.2.2.5. Financials (Based on Availability)
- 11.2.3 Rolls-Royce Group
- 11.2.3.1. Overview
- 11.2.3.2. Products
- 11.2.3.3. SWOT Analysis
- 11.2.3.4. Recent Developments
- 11.2.3.5. Financials (Based on Availability)
- 11.2.4 CoorsTek
- 11.2.4.1. Overview
- 11.2.4.2. Products
- 11.2.4.3. SWOT Analysis
- 11.2.4.4. Recent Developments
- 11.2.4.5. Financials (Based on Availability)
- 11.2.5 COI Ceramics
- 11.2.5.1. Overview
- 11.2.5.2. Products
- 11.2.5.3. SWOT Analysis
- 11.2.5.4. Recent Developments
- 11.2.5.5. Financials (Based on Availability)
- 11.2.6 BJS Ceramics GmbH
- 11.2.6.1. Overview
- 11.2.6.2. Products
- 11.2.6.3. SWOT Analysis
- 11.2.6.4. Recent Developments
- 11.2.6.5. Financials (Based on Availability)
- 11.2.7 Composites Horizo??ns
- 11.2.7.1. Overview
- 11.2.7.2. Products
- 11.2.7.3. SWOT Analysis
- 11.2.7.4. Recent Developments
- 11.2.7.5. Financials (Based on Availability)
- 11.2.8 Ultramet
- 11.2.8.1. Overview
- 11.2.8.2. Products
- 11.2.8.3. SWOT Analysis
- 11.2.8.4. Recent Developments
- 11.2.8.5. Financials (Based on Availability)
- 11.2.9 WPX Faser Keramik
- 11.2.9.1. Overview
- 11.2.9.2. Products
- 11.2.9.3. SWOT Analysis
- 11.2.9.4. Recent Developments
- 11.2.9.5. Financials (Based on Availability)
- 11.2.10 Applied Thin Films
- 11.2.10.1. Overview
- 11.2.10.2. Products
- 11.2.10.3. SWOT Analysis
- 11.2.10.4. Recent Developments
- 11.2.10.5. Financials (Based on Availability)
- 11.2.11 Walter E. C. Pritzkow Spezialkeramik
- 11.2.11.1. Overview
- 11.2.11.2. Products
- 11.2.11.3. SWOT Analysis
- 11.2.11.4. Recent Developments
- 11.2.11.5. Financials (Based on Availability)
- 11.2.1 GE Aviation
List of Figures
- Figure 1: Global Ceramic Matrix Composites for Aerospace Revenue Breakdown (million, %) by Region 2025 & 2033
- Figure 2: North America Ceramic Matrix Composites for Aerospace Revenue (million), by Application 2025 & 2033
- Figure 3: North America Ceramic Matrix Composites for Aerospace Revenue Share (%), by Application 2025 & 2033
- Figure 4: North America Ceramic Matrix Composites for Aerospace Revenue (million), by Types 2025 & 2033
- Figure 5: North America Ceramic Matrix Composites for Aerospace Revenue Share (%), by Types 2025 & 2033
- Figure 6: North America Ceramic Matrix Composites for Aerospace Revenue (million), by Country 2025 & 2033
- Figure 7: North America Ceramic Matrix Composites for Aerospace Revenue Share (%), by Country 2025 & 2033
- Figure 8: South America Ceramic Matrix Composites for Aerospace Revenue (million), by Application 2025 & 2033
- Figure 9: South America Ceramic Matrix Composites for Aerospace Revenue Share (%), by Application 2025 & 2033
- Figure 10: South America Ceramic Matrix Composites for Aerospace Revenue (million), by Types 2025 & 2033
- Figure 11: South America Ceramic Matrix Composites for Aerospace Revenue Share (%), by Types 2025 & 2033
- Figure 12: South America Ceramic Matrix Composites for Aerospace Revenue (million), by Country 2025 & 2033
- Figure 13: South America Ceramic Matrix Composites for Aerospace Revenue Share (%), by Country 2025 & 2033
- Figure 14: Europe Ceramic Matrix Composites for Aerospace Revenue (million), by Application 2025 & 2033
- Figure 15: Europe Ceramic Matrix Composites for Aerospace Revenue Share (%), by Application 2025 & 2033
- Figure 16: Europe Ceramic Matrix Composites for Aerospace Revenue (million), by Types 2025 & 2033
- Figure 17: Europe Ceramic Matrix Composites for Aerospace Revenue Share (%), by Types 2025 & 2033
- Figure 18: Europe Ceramic Matrix Composites for Aerospace Revenue (million), by Country 2025 & 2033
- Figure 19: Europe Ceramic Matrix Composites for Aerospace Revenue Share (%), by Country 2025 & 2033
- Figure 20: Middle East & Africa Ceramic Matrix Composites for Aerospace Revenue (million), by Application 2025 & 2033
- Figure 21: Middle East & Africa Ceramic Matrix Composites for Aerospace Revenue Share (%), by Application 2025 & 2033
- Figure 22: Middle East & Africa Ceramic Matrix Composites for Aerospace Revenue (million), by Types 2025 & 2033
- Figure 23: Middle East & Africa Ceramic Matrix Composites for Aerospace Revenue Share (%), by Types 2025 & 2033
- Figure 24: Middle East & Africa Ceramic Matrix Composites for Aerospace Revenue (million), by Country 2025 & 2033
- Figure 25: Middle East & Africa Ceramic Matrix Composites for Aerospace Revenue Share (%), by Country 2025 & 2033
- Figure 26: Asia Pacific Ceramic Matrix Composites for Aerospace Revenue (million), by Application 2025 & 2033
- Figure 27: Asia Pacific Ceramic Matrix Composites for Aerospace Revenue Share (%), by Application 2025 & 2033
- Figure 28: Asia Pacific Ceramic Matrix Composites for Aerospace Revenue (million), by Types 2025 & 2033
- Figure 29: Asia Pacific Ceramic Matrix Composites for Aerospace Revenue Share (%), by Types 2025 & 2033
- Figure 30: Asia Pacific Ceramic Matrix Composites for Aerospace Revenue (million), by Country 2025 & 2033
- Figure 31: Asia Pacific Ceramic Matrix Composites for Aerospace Revenue Share (%), by Country 2025 & 2033
List of Tables
- Table 1: Global Ceramic Matrix Composites for Aerospace Revenue million Forecast, by Application 2020 & 2033
- Table 2: Global Ceramic Matrix Composites for Aerospace Revenue million Forecast, by Types 2020 & 2033
- Table 3: Global Ceramic Matrix Composites for Aerospace Revenue million Forecast, by Region 2020 & 2033
- Table 4: Global Ceramic Matrix Composites for Aerospace Revenue million Forecast, by Application 2020 & 2033
- Table 5: Global Ceramic Matrix Composites for Aerospace Revenue million Forecast, by Types 2020 & 2033
- Table 6: Global Ceramic Matrix Composites for Aerospace Revenue million Forecast, by Country 2020 & 2033
- Table 7: United States Ceramic Matrix Composites for Aerospace Revenue (million) Forecast, by Application 2020 & 2033
- Table 8: Canada Ceramic Matrix Composites for Aerospace Revenue (million) Forecast, by Application 2020 & 2033
- Table 9: Mexico Ceramic Matrix Composites for Aerospace Revenue (million) Forecast, by Application 2020 & 2033
- Table 10: Global Ceramic Matrix Composites for Aerospace Revenue million Forecast, by Application 2020 & 2033
- Table 11: Global Ceramic Matrix Composites for Aerospace Revenue million Forecast, by Types 2020 & 2033
- Table 12: Global Ceramic Matrix Composites for Aerospace Revenue million Forecast, by Country 2020 & 2033
- Table 13: Brazil Ceramic Matrix Composites for Aerospace Revenue (million) Forecast, by Application 2020 & 2033
- Table 14: Argentina Ceramic Matrix Composites for Aerospace Revenue (million) Forecast, by Application 2020 & 2033
- Table 15: Rest of South America Ceramic Matrix Composites for Aerospace Revenue (million) Forecast, by Application 2020 & 2033
- Table 16: Global Ceramic Matrix Composites for Aerospace Revenue million Forecast, by Application 2020 & 2033
- Table 17: Global Ceramic Matrix Composites for Aerospace Revenue million Forecast, by Types 2020 & 2033
- Table 18: Global Ceramic Matrix Composites for Aerospace Revenue million Forecast, by Country 2020 & 2033
- Table 19: United Kingdom Ceramic Matrix Composites for Aerospace Revenue (million) Forecast, by Application 2020 & 2033
- Table 20: Germany Ceramic Matrix Composites for Aerospace Revenue (million) Forecast, by Application 2020 & 2033
- Table 21: France Ceramic Matrix Composites for Aerospace Revenue (million) Forecast, by Application 2020 & 2033
- Table 22: Italy Ceramic Matrix Composites for Aerospace Revenue (million) Forecast, by Application 2020 & 2033
- Table 23: Spain Ceramic Matrix Composites for Aerospace Revenue (million) Forecast, by Application 2020 & 2033
- Table 24: Russia Ceramic Matrix Composites for Aerospace Revenue (million) Forecast, by Application 2020 & 2033
- Table 25: Benelux Ceramic Matrix Composites for Aerospace Revenue (million) Forecast, by Application 2020 & 2033
- Table 26: Nordics Ceramic Matrix Composites for Aerospace Revenue (million) Forecast, by Application 2020 & 2033
- Table 27: Rest of Europe Ceramic Matrix Composites for Aerospace Revenue (million) Forecast, by Application 2020 & 2033
- Table 28: Global Ceramic Matrix Composites for Aerospace Revenue million Forecast, by Application 2020 & 2033
- Table 29: Global Ceramic Matrix Composites for Aerospace Revenue million Forecast, by Types 2020 & 2033
- Table 30: Global Ceramic Matrix Composites for Aerospace Revenue million Forecast, by Country 2020 & 2033
- Table 31: Turkey Ceramic Matrix Composites for Aerospace Revenue (million) Forecast, by Application 2020 & 2033
- Table 32: Israel Ceramic Matrix Composites for Aerospace Revenue (million) Forecast, by Application 2020 & 2033
- Table 33: GCC Ceramic Matrix Composites for Aerospace Revenue (million) Forecast, by Application 2020 & 2033
- Table 34: North Africa Ceramic Matrix Composites for Aerospace Revenue (million) Forecast, by Application 2020 & 2033
- Table 35: South Africa Ceramic Matrix Composites for Aerospace Revenue (million) Forecast, by Application 2020 & 2033
- Table 36: Rest of Middle East & Africa Ceramic Matrix Composites for Aerospace Revenue (million) Forecast, by Application 2020 & 2033
- Table 37: Global Ceramic Matrix Composites for Aerospace Revenue million Forecast, by Application 2020 & 2033
- Table 38: Global Ceramic Matrix Composites for Aerospace Revenue million Forecast, by Types 2020 & 2033
- Table 39: Global Ceramic Matrix Composites for Aerospace Revenue million Forecast, by Country 2020 & 2033
- Table 40: China Ceramic Matrix Composites for Aerospace Revenue (million) Forecast, by Application 2020 & 2033
- Table 41: India Ceramic Matrix Composites for Aerospace Revenue (million) Forecast, by Application 2020 & 2033
- Table 42: Japan Ceramic Matrix Composites for Aerospace Revenue (million) Forecast, by Application 2020 & 2033
- Table 43: South Korea Ceramic Matrix Composites for Aerospace Revenue (million) Forecast, by Application 2020 & 2033
- Table 44: ASEAN Ceramic Matrix Composites for Aerospace Revenue (million) Forecast, by Application 2020 & 2033
- Table 45: Oceania Ceramic Matrix Composites for Aerospace Revenue (million) Forecast, by Application 2020 & 2033
- Table 46: Rest of Asia Pacific Ceramic Matrix Composites for Aerospace Revenue (million) Forecast, by Application 2020 & 2033
Frequently Asked Questions
1. What is the projected Compound Annual Growth Rate (CAGR) of the Ceramic Matrix Composites for Aerospace?
The projected CAGR is approximately 12.1%.
2. Which companies are prominent players in the Ceramic Matrix Composites for Aerospace?
Key companies in the market include GE Aviation, Safran, Rolls-Royce Group, CoorsTek, COI Ceramics, BJS Ceramics GmbH, Composites Horizo??ns, Ultramet, WPX Faser Keramik, Applied Thin Films, Walter E. C. Pritzkow Spezialkeramik.
3. What are the main segments of the Ceramic Matrix Composites for Aerospace?
The market segments include Application, Types.
4. Can you provide details about the market size?
The market size is estimated to be USD 1098.9 million as of 2022.
5. What are some drivers contributing to market growth?
N/A
6. What are the notable trends driving market growth?
N/A
7. Are there any restraints impacting market growth?
N/A
8. Can you provide examples of recent developments in the market?
N/A
9. What pricing options are available for accessing the report?
Pricing options include single-user, multi-user, and enterprise licenses priced at USD 4900.00, USD 7350.00, and USD 9800.00 respectively.
10. Is the market size provided in terms of value or volume?
The market size is provided in terms of value, measured in million.
11. Are there any specific market keywords associated with the report?
Yes, the market keyword associated with the report is "Ceramic Matrix Composites for Aerospace," which aids in identifying and referencing the specific market segment covered.
12. How do I determine which pricing option suits my needs best?
The pricing options vary based on user requirements and access needs. Individual users may opt for single-user licenses, while businesses requiring broader access may choose multi-user or enterprise licenses for cost-effective access to the report.
13. Are there any additional resources or data provided in the Ceramic Matrix Composites for Aerospace report?
While the report offers comprehensive insights, it's advisable to review the specific contents or supplementary materials provided to ascertain if additional resources or data are available.
14. How can I stay updated on further developments or reports in the Ceramic Matrix Composites for Aerospace?
To stay informed about further developments, trends, and reports in the Ceramic Matrix Composites for Aerospace, consider subscribing to industry newsletters, following relevant companies and organizations, or regularly checking reputable industry news sources and publications.
Methodology
Step 1 - Identification of Relevant Samples Size from Population Database


Step 2 - Approaches for Defining Global Market Size (Value, Volume* & Price*)

Note*: In applicable scenarios
Step 3 - Data Sources
Primary Research
- Web Analytics
- Survey Reports
- Research Institute
- Latest Research Reports
- Opinion Leaders
Secondary Research
- Annual Reports
- White Paper
- Latest Press Release
- Industry Association
- Paid Database
- Investor Presentations

Step 4 - Data Triangulation
Involves using different sources of information in order to increase the validity of a study
These sources are likely to be stakeholders in a program - participants, other researchers, program staff, other community members, and so on.
Then we put all data in single framework & apply various statistical tools to find out the dynamic on the market.
During the analysis stage, feedback from the stakeholder groups would be compared to determine areas of agreement as well as areas of divergence