

Key Insights
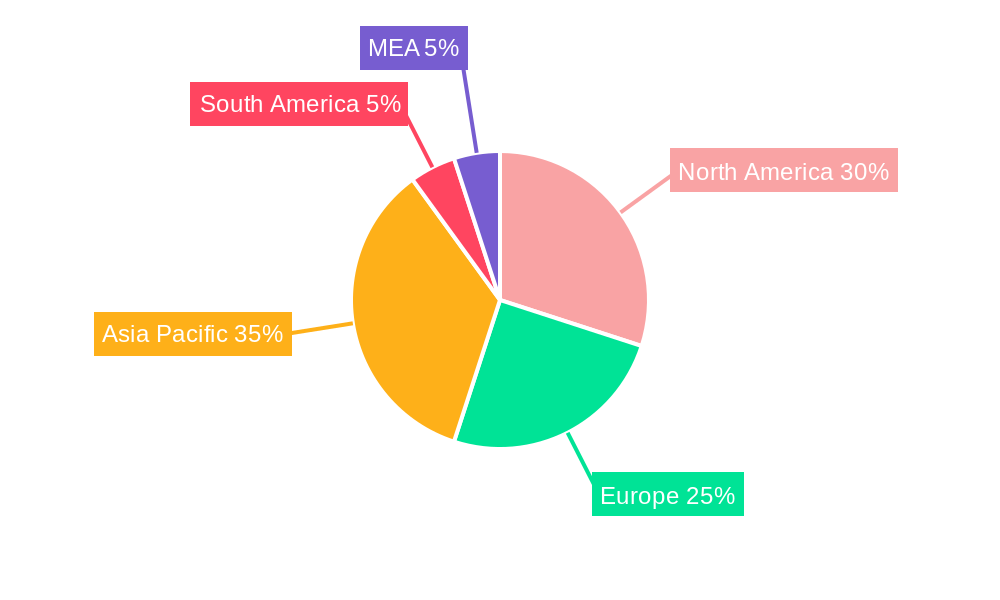
The global cellulose derivatives market, projected to reach $6.73 billion by 2025, is anticipated to grow at a CAGR of 6.6% from 2025 to 2033. This robust expansion is driven by increasing demand from key sectors. The burgeoning construction industry's reliance on cellulose ethers as additives, coupled with a growing preference for sustainable materials, significantly fuels market growth. Furthermore, the cosmetics and pharmaceuticals industries extensively utilize cellulose derivatives for their thickening, stabilizing, and film-forming capabilities, thereby boosting demand. The food and beverage sector also contributes to market expansion by employing these derivatives as stabilizers, emulsifiers, and thickeners. The paints and coatings industry further enhances its product properties and viscosity through their application. While specific market segment contributions are not detailed, construction-related industries are expected to hold a substantial share, followed by cosmetics & pharmaceuticals and food & beverage. Geographically, North America and Europe are poised to maintain significant market presence due to established industries, while Asia Pacific is projected for high growth driven by rapid industrialization and rising consumer demand.
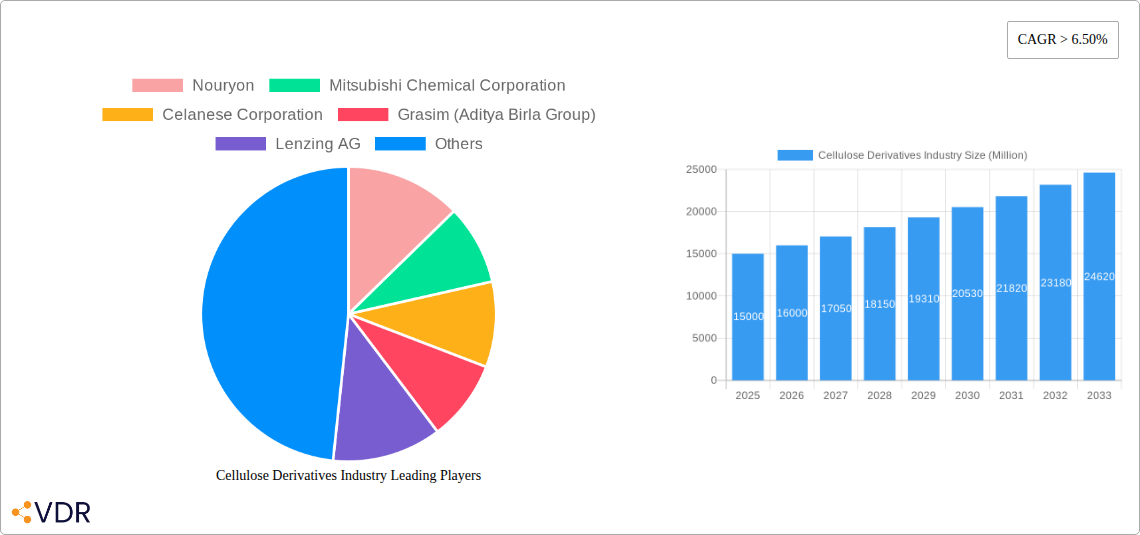
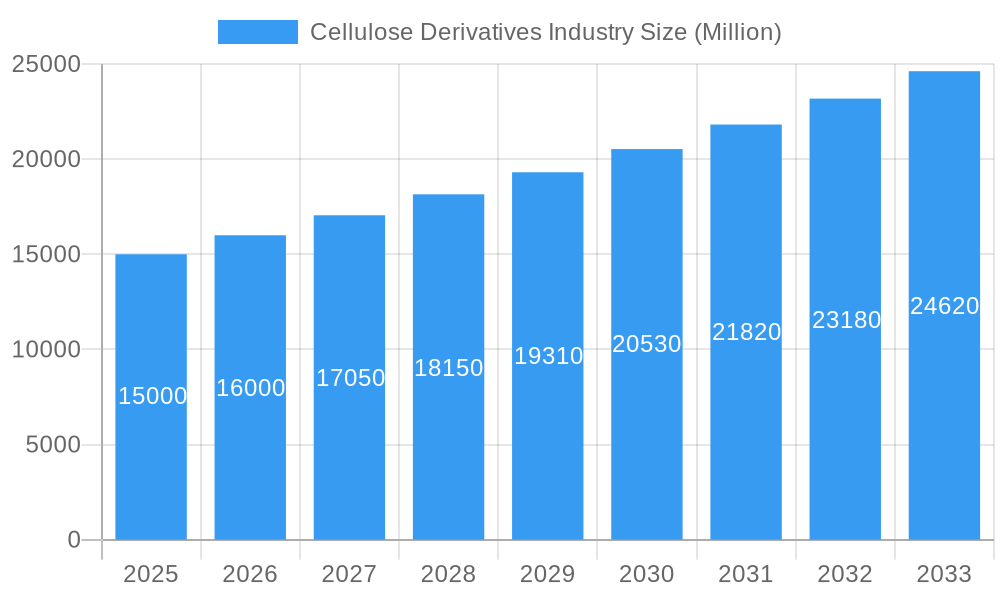
Cellulose Derivatives Industry Market Size (In Billion)
Despite positive growth prospects, the market encounters certain restraints. Fluctuations in raw material prices, such as wood pulp, can affect profitability and pricing strategies. Stringent regulatory compliance and the emergence of alternative materials also present challenges. Nevertheless, the overall market outlook remains optimistic, supported by the escalating demand for sustainable and bio-based materials across various industries. The competitive landscape features a blend of established multinational corporations and regional players, indicating a dynamic and evolving market structure characterized by healthy competition and continuous innovation. Future growth will likely be influenced by technological advancements, strategic expansion into emerging markets, and the development of novel applications for cellulose derivatives.
Cellulose Derivatives Industry Company Market Share
Cellulose Derivatives Industry: A Comprehensive Market Report (2019-2033)
This comprehensive report provides an in-depth analysis of the Cellulose Derivatives industry, encompassing market dynamics, growth trends, regional insights, competitive landscape, and future outlook. The report covers the period 2019-2033, with 2025 as the base year and a forecast period of 2025-2033. The total market value in 2025 is estimated at xx Million. This report is essential for industry professionals, investors, and researchers seeking a thorough understanding of this dynamic market. Key segments analyzed include Cellulose Esters, Cellulose Ethers, and Regenerated Cellulose, across diverse end-user industries such as Construction, Cosmetics & Pharmaceuticals, Food & Beverage, Paints & Coatings, Plastics, and Textiles.
Cellulose Derivatives Industry Market Dynamics & Structure
The Cellulose Derivatives market is characterized by a moderately concentrated structure, with key players such as Nouryon, Mitsubishi Chemical Corporation, and Celanese Corporation holding significant market share. The industry is driven by technological innovations in material science, particularly in developing bio-based and sustainable cellulose derivatives. Stringent environmental regulations, particularly regarding the use of petroleum-based polymers, are further propelling the adoption of cellulose-based alternatives. However, high raw material costs and the complexity of production processes pose challenges. Competitive substitutes, like synthetic polymers, exert pressure on pricing and market share. Mergers and acquisitions (M&A) activity has been moderate, with several companies focusing on strategic partnerships to expand their product portfolios and geographical reach.
- Market Concentration: Moderately concentrated, with top 5 players holding approximately xx% market share in 2025.
- Technological Innovation: Focus on bio-based and sustainable cellulose derivatives, improved performance characteristics.
- Regulatory Framework: Stringent environmental regulations drive demand for eco-friendly alternatives.
- Competitive Substitutes: Synthetic polymers pose a significant competitive threat.
- M&A Activity: Moderate activity, driven by expansion strategies and diversification. xx M&A deals in the period 2019-2024.
- Innovation Barriers: High R&D costs, complex production processes, and regulatory approvals.
Cellulose Derivatives Industry Growth Trends & Insights
The Cellulose Derivatives market is experiencing robust growth, driven by increasing demand across various end-use sectors. The market size is projected to expand at a Compound Annual Growth Rate (CAGR) of xx% during the forecast period (2025-2033), reaching xx Million by 2033. This growth is fueled by rising consumer awareness of sustainability and the increasing adoption of eco-friendly materials in construction, packaging, and personal care products. Technological advancements, such as the development of high-performance cellulose derivatives with tailored properties, are further boosting market expansion. Shifting consumer preferences towards sustainable and biodegradable products contribute significantly to the market's upward trajectory. Market penetration in emerging economies is also expected to drive substantial growth.
Dominant Regions, Countries, or Segments in Cellulose Derivatives Industry
The North American region currently holds the largest market share for cellulose derivatives, driven by robust demand from the construction and packaging industries. However, the Asia-Pacific region is projected to exhibit the highest growth rate during the forecast period, fueled by rapid industrialization and economic expansion in countries like China and India. Within the product segments, Cellulose Ethers are the dominant type, owing to their widespread applications in construction and personal care products. The Construction end-user industry is the largest consumer, accounting for xx% of total demand.
Key Drivers:
- Strong demand from construction and packaging sectors (North America).
- Rapid industrialization and economic growth (Asia-Pacific).
- Increasing adoption of sustainable materials across various industries.
- Favorable government policies and incentives promoting the use of bio-based materials.
Dominant Regions/Segments: North America (largest market share), Asia-Pacific (highest growth rate), Cellulose Ethers (largest product segment), Construction (largest end-use industry).
Cellulose Derivatives Industry Product Landscape
The Cellulose Derivatives market offers a diverse range of products, including modified cellulose esters and ethers with tailored properties, meeting specific application requirements. Recent innovations focus on enhancing biodegradability, improving performance characteristics (e.g., water solubility, film-forming properties), and reducing environmental impact. This is achieved through chemical modification and novel manufacturing processes. These advancements are expanding the applications of cellulose derivatives into new areas, including advanced materials and high-value applications. Unique selling propositions often revolve around sustainability, biodegradability, and superior performance compared to synthetic alternatives.
Key Drivers, Barriers & Challenges in Cellulose Derivatives Industry
Key Drivers:
- Growing demand for sustainable and bio-based materials.
- Increasing use in construction, personal care, and food applications.
- Technological advancements leading to improved product performance and functionality.
- Favorable government regulations promoting the use of renewable resources.
Challenges & Restraints:
- Fluctuations in raw material prices, impacting profitability.
- Stringent regulatory requirements and compliance costs.
- Intense competition from synthetic polymer substitutes.
- Supply chain disruptions caused by geopolitical factors. Estimated impact in 2025: xx Million in lost revenue.
Emerging Opportunities in Cellulose Derivatives Industry
- Expanding into new applications, such as bioplastics and biodegradable packaging.
- Leveraging nanocellulose technology for high-value applications.
- Targeting emerging markets with growing demand for sustainable materials.
- Developing customized cellulose derivatives to cater to specific industry needs.
Growth Accelerators in the Cellulose Derivatives Industry
The long-term growth of the cellulose derivatives industry will be accelerated by continued technological innovation focusing on improved performance, biodegradability, and cost-effectiveness. Strategic partnerships between cellulose producers and end-users will facilitate market penetration and enable the development of innovative applications. Expansion into new geographical markets, particularly developing economies, will further drive market growth.
Key Players Shaping the Cellulose Derivatives Industry Market
- Nouryon
- Mitsubishi Chemical Corporation
- Celanese Corporation
- Grasim (Aditya Birla Group)
- Lenzing AG
- Futamura Chemical Co Ltd
- Ashland
- DuPont
- Dow
- Eastman Chemical Company
- Daicel Corporation
- FKuR
- Sappi Limited
- Shin-Etsu Chemical Co Ltd
- Xinjiang Zhongtai Chemical Co Ltd
- Cerdia International GmbH
Notable Milestones in Cellulose Derivatives Industry Sector
- 2020, Q3: Celanese Corporation launches a new line of bio-based cellulose acetate.
- 2022, Q1: Merger between two smaller cellulose ether producers leads to increased market consolidation.
- 2023, Q4: Nouryon introduces a novel cellulose derivative with enhanced water solubility for the cosmetics industry.
- 2024, Q2: Significant investment in R&D for nanocellulose technology by a major player. (Further details pending).
In-Depth Cellulose Derivatives Industry Market Outlook
The future of the Cellulose Derivatives market appears promising, driven by a confluence of factors, including the growing awareness of sustainability, technological advancements, and favorable government policies. The market's expansion into new applications and geographical markets offers substantial growth opportunities. Companies adopting strategic partnerships and focusing on innovation will be well-positioned to capitalize on this expanding market. The projected value of the global cellulose derivatives market by 2033 demonstrates a significant opportunity for investors and stakeholders.
Cellulose Derivatives Industry Segmentation
-
1. Chemical Type
- 1.1. Cellulose Esters
- 1.2. Cellulose Ethers
- 1.3. Regenerated Cellulose
-
2. End-user Industry
- 2.1. Construction
- 2.2. Cosmetics & Pharmaceuricals
- 2.3. Food & Beverage
- 2.4. Paints & Coatings
- 2.5. Plastics
- 2.6. Textile
- 2.7. Other End-user Industries
Cellulose Derivatives Industry Segmentation By Geography
-
1. Asia Pacific
- 1.1. China
- 1.2. India
- 1.3. Japan
- 1.4. South Korea
- 1.5. Rest of Asia Pacific
-
2. North America
- 2.1. United States
- 2.2. Mexico
- 2.3. Canada
-
3. Europe
- 3.1. Germany
- 3.2. United Kingdom
- 3.3. Italy
- 3.4. France
- 3.5. Rest of Europe
-
4. South America
- 4.1. Brazil
- 4.2. Argentina
- 4.3. Rest of South America
-
5. Middle East & Africa
- 5.1. UAE
- 5.2. Saudi Arabia
- 5.3. South Africa
- 5.4. Rest of Middle East & Africa
Cellulose Derivatives Industry Regional Market Share
Geographic Coverage of Cellulose Derivatives Industry
Cellulose Derivatives Industry REPORT HIGHLIGHTS
| Aspects | Details |
|---|---|
| Study Period | 2020-2034 |
| Base Year | 2025 |
| Estimated Year | 2026 |
| Forecast Period | 2026-2034 |
| Historical Period | 2020-2025 |
| Growth Rate | CAGR of 6.6% from 2020-2034 |
| Segmentation |
|
Table of Contents
- 1. Introduction
- 1.1. Research Scope
- 1.2. Market Segmentation
- 1.3. Research Objective
- 1.4. Definitions and Assumptions
- 2. Executive Summary
- 2.1. Market Snapshot
- 3. Market Dynamics
- 3.1. Market Drivers
- 3.2. Market Restrains
- 3.3. Market Trends
- 3.4. Market Opportunities
- 4. Market Factor Analysis
- 4.1. Porters Five Forces
- 4.1.1. Bargaining Power of Suppliers
- 4.1.2. Bargaining Power of Buyers
- 4.1.3. Threat of New Entrants
- 4.1.4. Threat of Substitutes
- 4.1.5. Competitive Rivalry
- 4.2. PESTEL analysis
- 4.3. BCG Analysis
- 4.3.1. Stars (High Growth, High Market Share)
- 4.3.2. Cash Cows (Low Growth, High Market Share)
- 4.3.3. Question Mark (High Growth, Low Market Share)
- 4.3.4. Dogs (Low Growth, Low Market Share)
- 4.4. Ansoff Matrix Analysis
- 4.5. Supply Chain Analysis
- 4.6. Regulatory Landscape
- 4.7. Current Market Potential and Opportunity Assessment (TAM–SAM–SOM Framework)
- 4.8. VDR Analyst Note
- 4.1. Porters Five Forces
- 5. Market Analysis, Insights and Forecast 2021-2033
- 5.1. Market Analysis, Insights and Forecast - by Chemical Type
- 5.1.1. Cellulose Esters
- 5.1.2. Cellulose Ethers
- 5.1.3. Regenerated Cellulose
- 5.2. Market Analysis, Insights and Forecast - by End-user Industry
- 5.2.1. Construction
- 5.2.2. Cosmetics & Pharmaceuricals
- 5.2.3. Food & Beverage
- 5.2.4. Paints & Coatings
- 5.2.5. Plastics
- 5.2.6. Textile
- 5.2.7. Other End-user Industries
- 5.3. Market Analysis, Insights and Forecast - by Region
- 5.3.1. Asia Pacific
- 5.3.2. North America
- 5.3.3. Europe
- 5.3.4. South America
- 5.3.5. Middle East & Africa
- 5.1. Market Analysis, Insights and Forecast - by Chemical Type
- 6. Global Cellulose Derivatives Industry Analysis, Insights and Forecast, 2021-2033
- 6.1. Market Analysis, Insights and Forecast - by Chemical Type
- 6.1.1. Cellulose Esters
- 6.1.2. Cellulose Ethers
- 6.1.3. Regenerated Cellulose
- 6.2. Market Analysis, Insights and Forecast - by End-user Industry
- 6.2.1. Construction
- 6.2.2. Cosmetics & Pharmaceuricals
- 6.2.3. Food & Beverage
- 6.2.4. Paints & Coatings
- 6.2.5. Plastics
- 6.2.6. Textile
- 6.2.7. Other End-user Industries
- 6.1. Market Analysis, Insights and Forecast - by Chemical Type
- 7. Asia Pacific Cellulose Derivatives Industry Analysis, Insights and Forecast, 2021-2033
- 7.1. Market Analysis, Insights and Forecast - by Chemical Type
- 7.1.1. Cellulose Esters
- 7.1.2. Cellulose Ethers
- 7.1.3. Regenerated Cellulose
- 7.2. Market Analysis, Insights and Forecast - by End-user Industry
- 7.2.1. Construction
- 7.2.2. Cosmetics & Pharmaceuricals
- 7.2.3. Food & Beverage
- 7.2.4. Paints & Coatings
- 7.2.5. Plastics
- 7.2.6. Textile
- 7.2.7. Other End-user Industries
- 7.1. Market Analysis, Insights and Forecast - by Chemical Type
- 8. North America Cellulose Derivatives Industry Analysis, Insights and Forecast, 2021-2033
- 8.1. Market Analysis, Insights and Forecast - by Chemical Type
- 8.1.1. Cellulose Esters
- 8.1.2. Cellulose Ethers
- 8.1.3. Regenerated Cellulose
- 8.2. Market Analysis, Insights and Forecast - by End-user Industry
- 8.2.1. Construction
- 8.2.2. Cosmetics & Pharmaceuricals
- 8.2.3. Food & Beverage
- 8.2.4. Paints & Coatings
- 8.2.5. Plastics
- 8.2.6. Textile
- 8.2.7. Other End-user Industries
- 8.1. Market Analysis, Insights and Forecast - by Chemical Type
- 9. Europe Cellulose Derivatives Industry Analysis, Insights and Forecast, 2021-2033
- 9.1. Market Analysis, Insights and Forecast - by Chemical Type
- 9.1.1. Cellulose Esters
- 9.1.2. Cellulose Ethers
- 9.1.3. Regenerated Cellulose
- 9.2. Market Analysis, Insights and Forecast - by End-user Industry
- 9.2.1. Construction
- 9.2.2. Cosmetics & Pharmaceuricals
- 9.2.3. Food & Beverage
- 9.2.4. Paints & Coatings
- 9.2.5. Plastics
- 9.2.6. Textile
- 9.2.7. Other End-user Industries
- 9.1. Market Analysis, Insights and Forecast - by Chemical Type
- 10. South America Cellulose Derivatives Industry Analysis, Insights and Forecast, 2021-2033
- 10.1. Market Analysis, Insights and Forecast - by Chemical Type
- 10.1.1. Cellulose Esters
- 10.1.2. Cellulose Ethers
- 10.1.3. Regenerated Cellulose
- 10.2. Market Analysis, Insights and Forecast - by End-user Industry
- 10.2.1. Construction
- 10.2.2. Cosmetics & Pharmaceuricals
- 10.2.3. Food & Beverage
- 10.2.4. Paints & Coatings
- 10.2.5. Plastics
- 10.2.6. Textile
- 10.2.7. Other End-user Industries
- 10.1. Market Analysis, Insights and Forecast - by Chemical Type
- 11. Middle East & Africa Cellulose Derivatives Industry Analysis, Insights and Forecast, 2021-2033
- 11.1. Market Analysis, Insights and Forecast - by Chemical Type
- 11.1.1. Cellulose Esters
- 11.1.2. Cellulose Ethers
- 11.1.3. Regenerated Cellulose
- 11.2. Market Analysis, Insights and Forecast - by End-user Industry
- 11.2.1. Construction
- 11.2.2. Cosmetics & Pharmaceuricals
- 11.2.3. Food & Beverage
- 11.2.4. Paints & Coatings
- 11.2.5. Plastics
- 11.2.6. Textile
- 11.2.7. Other End-user Industries
- 11.1. Market Analysis, Insights and Forecast - by Chemical Type
- 12. Competitive Analysis
- 12.1. Company Profiles
- 12.1.1 Nouryon
- 12.1.1.1. Company Overview
- 12.1.1.2. Products
- 12.1.1.3. Company Financials
- 12.1.1.4. SWOT Analysis
- 12.1.2 Mitsubishi Chemical Corporation
- 12.1.2.1. Company Overview
- 12.1.2.2. Products
- 12.1.2.3. Company Financials
- 12.1.2.4. SWOT Analysis
- 12.1.3 Celanese Corporation
- 12.1.3.1. Company Overview
- 12.1.3.2. Products
- 12.1.3.3. Company Financials
- 12.1.3.4. SWOT Analysis
- 12.1.4 Grasim (Aditya Birla Group)
- 12.1.4.1. Company Overview
- 12.1.4.2. Products
- 12.1.4.3. Company Financials
- 12.1.4.4. SWOT Analysis
- 12.1.5 Lenzing AG
- 12.1.5.1. Company Overview
- 12.1.5.2. Products
- 12.1.5.3. Company Financials
- 12.1.5.4. SWOT Analysis
- 12.1.6 Futamura Chemical Co Ltd
- 12.1.6.1. Company Overview
- 12.1.6.2. Products
- 12.1.6.3. Company Financials
- 12.1.6.4. SWOT Analysis
- 12.1.7 Ashland
- 12.1.7.1. Company Overview
- 12.1.7.2. Products
- 12.1.7.3. Company Financials
- 12.1.7.4. SWOT Analysis
- 12.1.8 DuPont
- 12.1.8.1. Company Overview
- 12.1.8.2. Products
- 12.1.8.3. Company Financials
- 12.1.8.4. SWOT Analysis
- 12.1.9 Dow
- 12.1.9.1. Company Overview
- 12.1.9.2. Products
- 12.1.9.3. Company Financials
- 12.1.9.4. SWOT Analysis
- 12.1.10 Eastman Chemical Company
- 12.1.10.1. Company Overview
- 12.1.10.2. Products
- 12.1.10.3. Company Financials
- 12.1.10.4. SWOT Analysis
- 12.1.11 Daicel Corporation
- 12.1.11.1. Company Overview
- 12.1.11.2. Products
- 12.1.11.3. Company Financials
- 12.1.11.4. SWOT Analysis
- 12.1.12 FKuR
- 12.1.12.1. Company Overview
- 12.1.12.2. Products
- 12.1.12.3. Company Financials
- 12.1.12.4. SWOT Analysis
- 12.1.13 Sappi Limited
- 12.1.13.1. Company Overview
- 12.1.13.2. Products
- 12.1.13.3. Company Financials
- 12.1.13.4. SWOT Analysis
- 12.1.14 Shin-Etsu Chemical Co Ltd
- 12.1.14.1. Company Overview
- 12.1.14.2. Products
- 12.1.14.3. Company Financials
- 12.1.14.4. SWOT Analysis
- 12.1.15 Xinjiang Zhongtai Chemical Co Ltd
- 12.1.15.1. Company Overview
- 12.1.15.2. Products
- 12.1.15.3. Company Financials
- 12.1.15.4. SWOT Analysis
- 12.1.16 Cerdia International GmbH
- 12.1.16.1. Company Overview
- 12.1.16.2. Products
- 12.1.16.3. Company Financials
- 12.1.16.4. SWOT Analysis
- 12.1.1 Nouryon
- 12.2. Market Entropy
- 12.2.1 Company's Key Areas Served
- 12.2.2 Recent Developments
- 12.3. Company Market Share Analysis 2025
- 12.3.1 Top 5 Companies Market Share Analysis
- 12.3.2 Top 3 Companies Market Share Analysis
- 12.4. List of Potential Customers
- 13. Research Methodology
List of Figures
- Figure 1: Global Cellulose Derivatives Industry Revenue Breakdown (billion, %) by Region 2025 & 2033
- Figure 2: Global Cellulose Derivatives Industry Volume Breakdown (K Tons, %) by Region 2025 & 2033
- Figure 3: Asia Pacific Cellulose Derivatives Industry Revenue (billion), by Chemical Type 2025 & 2033
- Figure 4: Asia Pacific Cellulose Derivatives Industry Volume (K Tons), by Chemical Type 2025 & 2033
- Figure 5: Asia Pacific Cellulose Derivatives Industry Revenue Share (%), by Chemical Type 2025 & 2033
- Figure 6: Asia Pacific Cellulose Derivatives Industry Volume Share (%), by Chemical Type 2025 & 2033
- Figure 7: Asia Pacific Cellulose Derivatives Industry Revenue (billion), by End-user Industry 2025 & 2033
- Figure 8: Asia Pacific Cellulose Derivatives Industry Volume (K Tons), by End-user Industry 2025 & 2033
- Figure 9: Asia Pacific Cellulose Derivatives Industry Revenue Share (%), by End-user Industry 2025 & 2033
- Figure 10: Asia Pacific Cellulose Derivatives Industry Volume Share (%), by End-user Industry 2025 & 2033
- Figure 11: Asia Pacific Cellulose Derivatives Industry Revenue (billion), by Country 2025 & 2033
- Figure 12: Asia Pacific Cellulose Derivatives Industry Volume (K Tons), by Country 2025 & 2033
- Figure 13: Asia Pacific Cellulose Derivatives Industry Revenue Share (%), by Country 2025 & 2033
- Figure 14: Asia Pacific Cellulose Derivatives Industry Volume Share (%), by Country 2025 & 2033
- Figure 15: North America Cellulose Derivatives Industry Revenue (billion), by Chemical Type 2025 & 2033
- Figure 16: North America Cellulose Derivatives Industry Volume (K Tons), by Chemical Type 2025 & 2033
- Figure 17: North America Cellulose Derivatives Industry Revenue Share (%), by Chemical Type 2025 & 2033
- Figure 18: North America Cellulose Derivatives Industry Volume Share (%), by Chemical Type 2025 & 2033
- Figure 19: North America Cellulose Derivatives Industry Revenue (billion), by End-user Industry 2025 & 2033
- Figure 20: North America Cellulose Derivatives Industry Volume (K Tons), by End-user Industry 2025 & 2033
- Figure 21: North America Cellulose Derivatives Industry Revenue Share (%), by End-user Industry 2025 & 2033
- Figure 22: North America Cellulose Derivatives Industry Volume Share (%), by End-user Industry 2025 & 2033
- Figure 23: North America Cellulose Derivatives Industry Revenue (billion), by Country 2025 & 2033
- Figure 24: North America Cellulose Derivatives Industry Volume (K Tons), by Country 2025 & 2033
- Figure 25: North America Cellulose Derivatives Industry Revenue Share (%), by Country 2025 & 2033
- Figure 26: North America Cellulose Derivatives Industry Volume Share (%), by Country 2025 & 2033
- Figure 27: Europe Cellulose Derivatives Industry Revenue (billion), by Chemical Type 2025 & 2033
- Figure 28: Europe Cellulose Derivatives Industry Volume (K Tons), by Chemical Type 2025 & 2033
- Figure 29: Europe Cellulose Derivatives Industry Revenue Share (%), by Chemical Type 2025 & 2033
- Figure 30: Europe Cellulose Derivatives Industry Volume Share (%), by Chemical Type 2025 & 2033
- Figure 31: Europe Cellulose Derivatives Industry Revenue (billion), by End-user Industry 2025 & 2033
- Figure 32: Europe Cellulose Derivatives Industry Volume (K Tons), by End-user Industry 2025 & 2033
- Figure 33: Europe Cellulose Derivatives Industry Revenue Share (%), by End-user Industry 2025 & 2033
- Figure 34: Europe Cellulose Derivatives Industry Volume Share (%), by End-user Industry 2025 & 2033
- Figure 35: Europe Cellulose Derivatives Industry Revenue (billion), by Country 2025 & 2033
- Figure 36: Europe Cellulose Derivatives Industry Volume (K Tons), by Country 2025 & 2033
- Figure 37: Europe Cellulose Derivatives Industry Revenue Share (%), by Country 2025 & 2033
- Figure 38: Europe Cellulose Derivatives Industry Volume Share (%), by Country 2025 & 2033
- Figure 39: South America Cellulose Derivatives Industry Revenue (billion), by Chemical Type 2025 & 2033
- Figure 40: South America Cellulose Derivatives Industry Volume (K Tons), by Chemical Type 2025 & 2033
- Figure 41: South America Cellulose Derivatives Industry Revenue Share (%), by Chemical Type 2025 & 2033
- Figure 42: South America Cellulose Derivatives Industry Volume Share (%), by Chemical Type 2025 & 2033
- Figure 43: South America Cellulose Derivatives Industry Revenue (billion), by End-user Industry 2025 & 2033
- Figure 44: South America Cellulose Derivatives Industry Volume (K Tons), by End-user Industry 2025 & 2033
- Figure 45: South America Cellulose Derivatives Industry Revenue Share (%), by End-user Industry 2025 & 2033
- Figure 46: South America Cellulose Derivatives Industry Volume Share (%), by End-user Industry 2025 & 2033
- Figure 47: South America Cellulose Derivatives Industry Revenue (billion), by Country 2025 & 2033
- Figure 48: South America Cellulose Derivatives Industry Volume (K Tons), by Country 2025 & 2033
- Figure 49: South America Cellulose Derivatives Industry Revenue Share (%), by Country 2025 & 2033
- Figure 50: South America Cellulose Derivatives Industry Volume Share (%), by Country 2025 & 2033
- Figure 51: Middle East & Africa Cellulose Derivatives Industry Revenue (billion), by Chemical Type 2025 & 2033
- Figure 52: Middle East & Africa Cellulose Derivatives Industry Volume (K Tons), by Chemical Type 2025 & 2033
- Figure 53: Middle East & Africa Cellulose Derivatives Industry Revenue Share (%), by Chemical Type 2025 & 2033
- Figure 54: Middle East & Africa Cellulose Derivatives Industry Volume Share (%), by Chemical Type 2025 & 2033
- Figure 55: Middle East & Africa Cellulose Derivatives Industry Revenue (billion), by End-user Industry 2025 & 2033
- Figure 56: Middle East & Africa Cellulose Derivatives Industry Volume (K Tons), by End-user Industry 2025 & 2033
- Figure 57: Middle East & Africa Cellulose Derivatives Industry Revenue Share (%), by End-user Industry 2025 & 2033
- Figure 58: Middle East & Africa Cellulose Derivatives Industry Volume Share (%), by End-user Industry 2025 & 2033
- Figure 59: Middle East & Africa Cellulose Derivatives Industry Revenue (billion), by Country 2025 & 2033
- Figure 60: Middle East & Africa Cellulose Derivatives Industry Volume (K Tons), by Country 2025 & 2033
- Figure 61: Middle East & Africa Cellulose Derivatives Industry Revenue Share (%), by Country 2025 & 2033
- Figure 62: Middle East & Africa Cellulose Derivatives Industry Volume Share (%), by Country 2025 & 2033
List of Tables
- Table 1: Global Cellulose Derivatives Industry Revenue billion Forecast, by Chemical Type 2020 & 2033
- Table 2: Global Cellulose Derivatives Industry Volume K Tons Forecast, by Chemical Type 2020 & 2033
- Table 3: Global Cellulose Derivatives Industry Revenue billion Forecast, by End-user Industry 2020 & 2033
- Table 4: Global Cellulose Derivatives Industry Volume K Tons Forecast, by End-user Industry 2020 & 2033
- Table 5: Global Cellulose Derivatives Industry Revenue billion Forecast, by Region 2020 & 2033
- Table 6: Global Cellulose Derivatives Industry Volume K Tons Forecast, by Region 2020 & 2033
- Table 7: Global Cellulose Derivatives Industry Revenue billion Forecast, by Chemical Type 2020 & 2033
- Table 8: Global Cellulose Derivatives Industry Volume K Tons Forecast, by Chemical Type 2020 & 2033
- Table 9: Global Cellulose Derivatives Industry Revenue billion Forecast, by End-user Industry 2020 & 2033
- Table 10: Global Cellulose Derivatives Industry Volume K Tons Forecast, by End-user Industry 2020 & 2033
- Table 11: Global Cellulose Derivatives Industry Revenue billion Forecast, by Country 2020 & 2033
- Table 12: Global Cellulose Derivatives Industry Volume K Tons Forecast, by Country 2020 & 2033
- Table 13: China Cellulose Derivatives Industry Revenue (billion) Forecast, by Application 2020 & 2033
- Table 14: China Cellulose Derivatives Industry Volume (K Tons) Forecast, by Application 2020 & 2033
- Table 15: India Cellulose Derivatives Industry Revenue (billion) Forecast, by Application 2020 & 2033
- Table 16: India Cellulose Derivatives Industry Volume (K Tons) Forecast, by Application 2020 & 2033
- Table 17: Japan Cellulose Derivatives Industry Revenue (billion) Forecast, by Application 2020 & 2033
- Table 18: Japan Cellulose Derivatives Industry Volume (K Tons) Forecast, by Application 2020 & 2033
- Table 19: South Korea Cellulose Derivatives Industry Revenue (billion) Forecast, by Application 2020 & 2033
- Table 20: South Korea Cellulose Derivatives Industry Volume (K Tons) Forecast, by Application 2020 & 2033
- Table 21: Rest of Asia Pacific Cellulose Derivatives Industry Revenue (billion) Forecast, by Application 2020 & 2033
- Table 22: Rest of Asia Pacific Cellulose Derivatives Industry Volume (K Tons) Forecast, by Application 2020 & 2033
- Table 23: Global Cellulose Derivatives Industry Revenue billion Forecast, by Chemical Type 2020 & 2033
- Table 24: Global Cellulose Derivatives Industry Volume K Tons Forecast, by Chemical Type 2020 & 2033
- Table 25: Global Cellulose Derivatives Industry Revenue billion Forecast, by End-user Industry 2020 & 2033
- Table 26: Global Cellulose Derivatives Industry Volume K Tons Forecast, by End-user Industry 2020 & 2033
- Table 27: Global Cellulose Derivatives Industry Revenue billion Forecast, by Country 2020 & 2033
- Table 28: Global Cellulose Derivatives Industry Volume K Tons Forecast, by Country 2020 & 2033
- Table 29: United States Cellulose Derivatives Industry Revenue (billion) Forecast, by Application 2020 & 2033
- Table 30: United States Cellulose Derivatives Industry Volume (K Tons) Forecast, by Application 2020 & 2033
- Table 31: Mexico Cellulose Derivatives Industry Revenue (billion) Forecast, by Application 2020 & 2033
- Table 32: Mexico Cellulose Derivatives Industry Volume (K Tons) Forecast, by Application 2020 & 2033
- Table 33: Canada Cellulose Derivatives Industry Revenue (billion) Forecast, by Application 2020 & 2033
- Table 34: Canada Cellulose Derivatives Industry Volume (K Tons) Forecast, by Application 2020 & 2033
- Table 35: Global Cellulose Derivatives Industry Revenue billion Forecast, by Chemical Type 2020 & 2033
- Table 36: Global Cellulose Derivatives Industry Volume K Tons Forecast, by Chemical Type 2020 & 2033
- Table 37: Global Cellulose Derivatives Industry Revenue billion Forecast, by End-user Industry 2020 & 2033
- Table 38: Global Cellulose Derivatives Industry Volume K Tons Forecast, by End-user Industry 2020 & 2033
- Table 39: Global Cellulose Derivatives Industry Revenue billion Forecast, by Country 2020 & 2033
- Table 40: Global Cellulose Derivatives Industry Volume K Tons Forecast, by Country 2020 & 2033
- Table 41: Germany Cellulose Derivatives Industry Revenue (billion) Forecast, by Application 2020 & 2033
- Table 42: Germany Cellulose Derivatives Industry Volume (K Tons) Forecast, by Application 2020 & 2033
- Table 43: United Kingdom Cellulose Derivatives Industry Revenue (billion) Forecast, by Application 2020 & 2033
- Table 44: United Kingdom Cellulose Derivatives Industry Volume (K Tons) Forecast, by Application 2020 & 2033
- Table 45: Italy Cellulose Derivatives Industry Revenue (billion) Forecast, by Application 2020 & 2033
- Table 46: Italy Cellulose Derivatives Industry Volume (K Tons) Forecast, by Application 2020 & 2033
- Table 47: France Cellulose Derivatives Industry Revenue (billion) Forecast, by Application 2020 & 2033
- Table 48: France Cellulose Derivatives Industry Volume (K Tons) Forecast, by Application 2020 & 2033
- Table 49: Rest of Europe Cellulose Derivatives Industry Revenue (billion) Forecast, by Application 2020 & 2033
- Table 50: Rest of Europe Cellulose Derivatives Industry Volume (K Tons) Forecast, by Application 2020 & 2033
- Table 51: Global Cellulose Derivatives Industry Revenue billion Forecast, by Chemical Type 2020 & 2033
- Table 52: Global Cellulose Derivatives Industry Volume K Tons Forecast, by Chemical Type 2020 & 2033
- Table 53: Global Cellulose Derivatives Industry Revenue billion Forecast, by End-user Industry 2020 & 2033
- Table 54: Global Cellulose Derivatives Industry Volume K Tons Forecast, by End-user Industry 2020 & 2033
- Table 55: Global Cellulose Derivatives Industry Revenue billion Forecast, by Country 2020 & 2033
- Table 56: Global Cellulose Derivatives Industry Volume K Tons Forecast, by Country 2020 & 2033
- Table 57: Brazil Cellulose Derivatives Industry Revenue (billion) Forecast, by Application 2020 & 2033
- Table 58: Brazil Cellulose Derivatives Industry Volume (K Tons) Forecast, by Application 2020 & 2033
- Table 59: Argentina Cellulose Derivatives Industry Revenue (billion) Forecast, by Application 2020 & 2033
- Table 60: Argentina Cellulose Derivatives Industry Volume (K Tons) Forecast, by Application 2020 & 2033
- Table 61: Rest of South America Cellulose Derivatives Industry Revenue (billion) Forecast, by Application 2020 & 2033
- Table 62: Rest of South America Cellulose Derivatives Industry Volume (K Tons) Forecast, by Application 2020 & 2033
- Table 63: Global Cellulose Derivatives Industry Revenue billion Forecast, by Chemical Type 2020 & 2033
- Table 64: Global Cellulose Derivatives Industry Volume K Tons Forecast, by Chemical Type 2020 & 2033
- Table 65: Global Cellulose Derivatives Industry Revenue billion Forecast, by End-user Industry 2020 & 2033
- Table 66: Global Cellulose Derivatives Industry Volume K Tons Forecast, by End-user Industry 2020 & 2033
- Table 67: Global Cellulose Derivatives Industry Revenue billion Forecast, by Country 2020 & 2033
- Table 68: Global Cellulose Derivatives Industry Volume K Tons Forecast, by Country 2020 & 2033
- Table 69: UAE Cellulose Derivatives Industry Revenue (billion) Forecast, by Application 2020 & 2033
- Table 70: UAE Cellulose Derivatives Industry Volume (K Tons) Forecast, by Application 2020 & 2033
- Table 71: Saudi Arabia Cellulose Derivatives Industry Revenue (billion) Forecast, by Application 2020 & 2033
- Table 72: Saudi Arabia Cellulose Derivatives Industry Volume (K Tons) Forecast, by Application 2020 & 2033
- Table 73: South Africa Cellulose Derivatives Industry Revenue (billion) Forecast, by Application 2020 & 2033
- Table 74: South Africa Cellulose Derivatives Industry Volume (K Tons) Forecast, by Application 2020 & 2033
- Table 75: Rest of Middle East & Africa Cellulose Derivatives Industry Revenue (billion) Forecast, by Application 2020 & 2033
- Table 76: Rest of Middle East & Africa Cellulose Derivatives Industry Volume (K Tons) Forecast, by Application 2020 & 2033
Frequently Asked Questions
1. What is the projected Compound Annual Growth Rate (CAGR) of the Cellulose Derivatives Industry?
The projected CAGR is approximately 6.6%.
2. Which companies are prominent players in the Cellulose Derivatives Industry?
Key companies in the market include Nouryon, Mitsubishi Chemical Corporation, Celanese Corporation, Grasim (Aditya Birla Group), Lenzing AG, Futamura Chemical Co Ltd, Ashland, DuPont, Dow, Eastman Chemical Company, Daicel Corporation, FKuR, Sappi Limited, Shin-Etsu Chemical Co Ltd, Xinjiang Zhongtai Chemical Co Ltd, Cerdia International GmbH.
3. What are the main segments of the Cellulose Derivatives Industry?
The market segments include Chemical Type, End-user Industry.
4. Can you provide details about the market size?
The market size is estimated to be USD 6.73 billion as of 2022.
5. What are some drivers contributing to market growth?
Increasing Demand from Pharmaceutical Industry; Increasing Use of Cellulose Ether in Building and Construction Industry; Other Drivers.
6. What are the notable trends driving market growth?
Food and Beverage Industry to Dominate the Market.
7. Are there any restraints impacting market growth?
Competition of Regenerated Cellulose Fibers from Synthetic Fibers and Other Protein-based Fibers; Other Restraints.
8. Can you provide examples of recent developments in the market?
N/A
9. What pricing options are available for accessing the report?
Pricing options include single-user, multi-user, and enterprise licenses priced at USD 4750, USD 5250, and USD 8750 respectively.
10. Is the market size provided in terms of value or volume?
The market size is provided in terms of value, measured in billion and volume, measured in K Tons.
11. Are there any specific market keywords associated with the report?
Yes, the market keyword associated with the report is "Cellulose Derivatives Industry," which aids in identifying and referencing the specific market segment covered.
12. How do I determine which pricing option suits my needs best?
The pricing options vary based on user requirements and access needs. Individual users may opt for single-user licenses, while businesses requiring broader access may choose multi-user or enterprise licenses for cost-effective access to the report.
13. Are there any additional resources or data provided in the Cellulose Derivatives Industry report?
While the report offers comprehensive insights, it's advisable to review the specific contents or supplementary materials provided to ascertain if additional resources or data are available.
14. How can I stay updated on further developments or reports in the Cellulose Derivatives Industry?
To stay informed about further developments, trends, and reports in the Cellulose Derivatives Industry, consider subscribing to industry newsletters, following relevant companies and organizations, or regularly checking reputable industry news sources and publications.
Methodology
Step 1 - Identification of Relevant Samples Size from Population Database


Step 2 - Approaches for Defining Global Market Size (Value, Volume* & Price*)

Note*: In applicable scenarios
Step 3 - Data Sources
Primary Research
- Web Analytics
- Survey Reports
- Research Institute
- Latest Research Reports
- Opinion Leaders
Secondary Research
- Annual Reports
- White Paper
- Latest Press Release
- Industry Association
- Paid Database
- Investor Presentations

Step 4 - Data Triangulation
Involves using different sources of information in order to increase the validity of a study
These sources are likely to be stakeholders in a program - participants, other researchers, program staff, other community members, and so on.
Then we put all data in single framework & apply various statistical tools to find out the dynamic on the market.
During the analysis stage, feedback from the stakeholder groups would be compared to determine areas of agreement as well as areas of divergence