

Key Insights
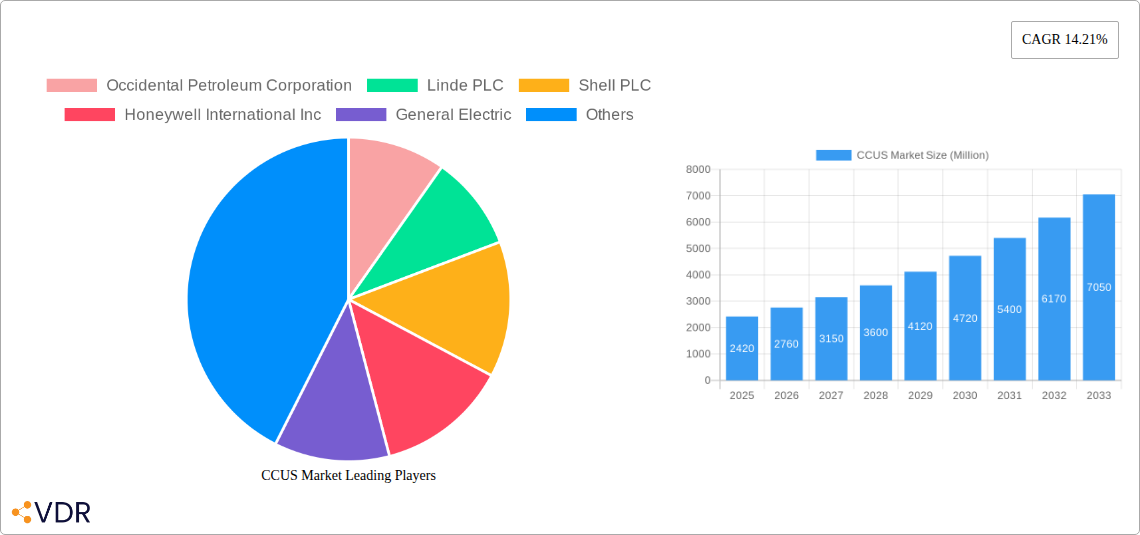
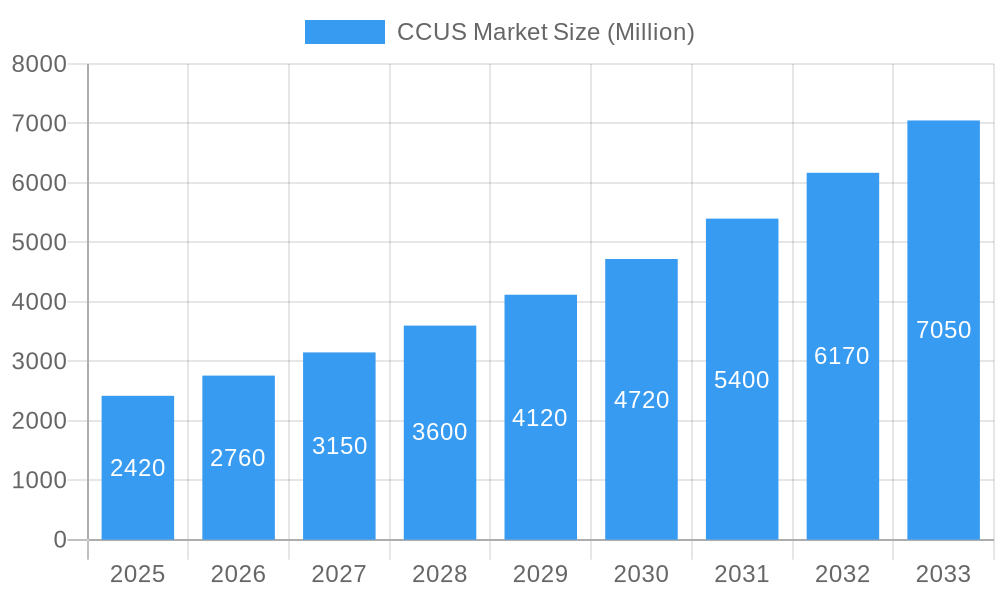
The Carbon Capture, Utilization, and Storage (CCUS) market is experiencing robust growth, projected to reach \$2.42 billion in 2025 and expanding at a Compound Annual Growth Rate (CAGR) of 14.21% from 2025 to 2033. This expansion is driven by escalating global concerns regarding climate change and stringent government regulations aimed at reducing greenhouse gas emissions. The increasing adoption of renewable energy sources, coupled with the rising demand for energy efficiency, further fuels the market's growth. Key market segments include pre-combustion, oxy-fuel combustion, and post-combustion capture technologies, each catering to specific industrial needs across diverse sectors such as oil and gas, power generation (coal and biomass), iron and steel, chemicals, and cement. The geographical distribution of the market is broad, with significant contributions expected from North America (particularly the United States, segmented into Northeast, Southeast, Midwest, Southwest, and West regions), Europe, and Asia-Pacific, driven by varying levels of government support and industrial activity. Major players like Occidental Petroleum, Linde PLC, Shell PLC, and Honeywell International are actively investing in research and development, expanding their market presence through strategic partnerships and acquisitions to capitalize on this burgeoning market.
CCUS Market Market Size (In Billion)
The continued growth of the CCUS market is contingent upon several factors. Technological advancements leading to improved capture efficiency and reduced costs are crucial. Government incentives, including tax credits and carbon pricing mechanisms, will play a vital role in stimulating market expansion. However, challenges remain, including the high capital costs associated with CCUS infrastructure, the energy intensity of capture processes, and the need for secure and long-term storage solutions. Overcoming these hurdles through public-private partnerships and continued technological innovation will be critical to fully realizing the market's potential and achieving global climate goals. Future growth is anticipated to be particularly strong in regions with substantial fossil fuel industries actively seeking emission reduction strategies.
CCUS Market Company Market Share
CCUS Market: A Comprehensive Report (2019-2033)
This in-depth report provides a comprehensive analysis of the Carbon Capture, Utilization, and Storage (CCUS) market, encompassing market dynamics, growth trends, regional dominance, product landscape, key players, and future outlook. The study period covers 2019-2033, with 2025 as the base and estimated year. The report leverages extensive data and analysis to offer actionable insights for industry professionals, investors, and policymakers. The market is segmented by end-user industry (Oil and Gas, Coal and Biomass Power Plant, Iron and Steel, Chemical, Cement) and technology (Pre-combustion Capture, Oxy-fuel Combustion Capture, Post-combustion Capture). The total market size is projected to reach xx Million by 2033.
CCUS Market Dynamics & Structure
The CCUS market is characterized by a moderately concentrated structure, with several large players holding significant market share. However, the market also witnesses the emergence of innovative startups and specialized technology providers. Technological innovation is a key driver, with continuous advancements in capture, transport, and storage technologies improving efficiency and reducing costs. Stringent environmental regulations globally are pushing adoption, while government incentives and carbon pricing mechanisms are further accelerating growth. Competitive substitutes, primarily focused on renewable energy sources, exert pressure, but CCUS remains crucial for decarbonizing hard-to-abate sectors. M&A activity is frequent, with larger players acquiring smaller companies to gain access to new technologies or expand their geographical reach.
- Market Concentration: Moderately concentrated, with top 5 players holding approximately 45% market share in 2025.
- Technological Innovation: Significant R&D investments driving efficiency improvements and cost reductions in capture technologies.
- Regulatory Frameworks: Stringent emission reduction targets and carbon pricing mechanisms are key growth catalysts.
- Competitive Substitutes: Renewable energy sources pose competition, but CCUS remains vital for hard-to-abate sectors.
- M&A Activity: High level of M&A activity, with approximately xx deals completed annually between 2019 and 2024.
- End-User Demographics: Oil & Gas sector is the largest end-user, followed by Power Generation.
CCUS Market Growth Trends & Insights
The Carbon Capture, Utilization, and Storage (CCUS) market has demonstrated significant and sustained growth during the historical period (2019-2024). This expansion is a direct consequence of escalating global environmental consciousness, stringent regulatory frameworks, and the increasing imperative for industries to decarbonize. The market size saw a notable increase from approximately **[Insert Specific Value] Million USD** in 2019 to an estimated **[Insert Specific Value] Million USD** in 2024, reflecting a Compound Annual Growth Rate (CAGR) of **[Insert Specific Percentage]%**. This upward trajectory is projected to persist robustly throughout the forecast period (2025-2033), with the market anticipated to reach an impressive **[Insert Specific Value] Million USD** by 2033, driven by a continued CAGR of **[Insert Specific Percentage]%**. Key to this growth are continuous technological advancements, particularly in post-combustion capture methods, which are significantly enhancing the cost-effectiveness, efficiency, and scalability of CCUS solutions. Concurrently, a heightened awareness across diverse industrial sectors regarding the critical need for emissions reduction is accelerating the adoption rates of CCUS technologies. Furthermore, evolving consumer preferences for sustainable products and services are indirectly but powerfully influencing market dynamics, compelling industries to integrate CCUS solutions into their operations. Specific shifts in consumer behavior, such as a pronounced preference for renewable and sustainable energy sources, are therefore creating an indirect but substantial demand for advanced CCUS technologies.
Dominant Regions, Countries, or Segments in CCUS Market
North America currently holds a commanding position in the global CCUS market. This leadership is attributed to a potent combination of strong governmental backing, the presence of well-established industrial infrastructure, and the significant operational footprint of major oil and gas corporations. Within this dominant region, the United States spearheads market activity, closely followed by Canada. Analyzing by end-user industry, the Oil and Gas sector continues to be the largest contributor, accounting for an estimated 60% of the total market revenue in 2025. This dominance stems from the sector's inherent high carbon intensity and the substantial opportunities presented by Enhanced Oil Recovery (EOR) applications, where captured CO2 can be economically beneficial. Regarding technological segmentation, post-combustion capture technologies maintain the leading market share. This is primarily due to their inherent flexibility and ability to be retrofitted into existing power plants and industrial facilities with greater ease and lower initial investment compared to other capture methods.
- Key Drivers (North America): Proactive and favorable government policies and incentives, a robust and mature industrial infrastructure, and the concentrated presence of leading CCUS technology providers and adopters.
- Key Drivers (Oil & Gas): The sector's high greenhouse gas emissions profile, making CCUS a critical decarbonization tool, and the economic viability offered by EOR applications.
- Key Drivers (Post-combustion Capture): Its demonstrated adaptability to integrate with existing power generation and industrial complexes, and generally lower initial capital expenditure requirements.
CCUS Market Product Landscape
The CCUS market features a diverse range of products, including carbon capture technologies (e.g., amines, membranes, solvents), transportation infrastructure (pipelines, ships), and storage solutions (geological formations, saline aquifers). Significant advancements in capture technology are improving efficiency and reducing costs, while innovative storage solutions are expanding capacity and safety. The unique selling propositions focus on efficiency, scalability, cost-effectiveness, and environmental impact. Technological advancements concentrate on improving capture efficiency, reducing energy consumption, and enhancing storage safety.
Key Drivers, Barriers & Challenges in CCUS Market
Key Drivers:
- Increasingly stringent environmental regulations globally.
- Government incentives and carbon pricing mechanisms.
- Growing awareness of climate change and the need for emissions reduction.
- Technological advancements improving efficiency and cost-effectiveness.
Key Challenges:
- High upfront capital costs associated with CCUS projects.
- Technological limitations in capturing CO2 from certain industrial processes.
- Lack of sufficient storage capacity in some regions.
- Regulatory uncertainties and permitting complexities. These hurdles result in project delays, adding to overall costs and impacting market growth negatively by an estimated 5% annually.
Emerging Opportunities in CCUS Market
- Expansion into Hard-to-Abate Sectors: Significant opportunities lie in applying CCUS technologies to industries with inherently difficult emissions to control, such as cement production, steel manufacturing, and heavy industries.
- Innovative CO2 Utilization Pathways: The development and commercialization of novel technologies for CO2 utilization, including the creation of synthetic fuels, advanced building materials, and high-value chemicals, represent a burgeoning growth area.
- Growth in Monitoring and Verification Services: As CCUS projects proliferate, there will be an increasing demand for specialized services in CO2 monitoring, reporting, and verification (MRV) to ensure project integrity and regulatory compliance.
- Increased R&D Investment: Continued and amplified investment in research and development is crucial for driving down costs, improving efficiency, and unlocking new applications for CCUS technologies.
- Integration with Renewable Energy: Exploring synergies between CCUS and renewable energy sources, such as direct air capture powered by renewable electricity, offers a pathway to net-negative emissions.
Growth Accelerators in the CCUS Market Industry
Several factors are poised to accelerate long-term growth in the CCUS market. Technological breakthroughs, particularly in the development of more efficient and cost-effective capture technologies, will play a crucial role. Strategic partnerships between technology providers, energy companies, and governments are essential for fostering large-scale deployment. Market expansion into new regions, particularly developing economies with high emissions intensity, will drive substantial growth. The expansion of carbon capture, utilization, and storage (CCUS) projects, fueled by government incentives and corporate sustainability goals, is expected to fuel significant growth in the coming years.
Key Players Shaping the CCUS Market Market
- Occidental Petroleum Corporation
- Linde PLC
- Shell PLC
- Honeywell International Inc
- General Electric
- Exxon Mobil Corporation
- Japan CCS Co Ltd
- SLB
- Fluor Corporation
- Baker Hughes Company
- Halliburton
- Aker Solutions
- Dakota Gasification Company
- JX Nippon Oil & Gas Exploration Corporation
- Siemens Energy
- Air Liquide
- Mitsubishi Heavy Industries Ltd
Notable Milestones in CCUS Market Sector
- March 2024: JX Nippon Oil & Gas Exploration Corporation and Chevron New Energies formalized a Memorandum of Understanding (MOU) to explore the feasibility of CO2 export from Japan to developing Carbon Capture and Storage (CCS) initiatives across Australia and the broader Asia-Pacific region. This strategic collaboration aims to broaden the market reach and impact of Japanese CCUS expertise and technologies.
- March 2024: Shell and Oil and Natural Gas Corporation (ONGC) initiated a joint study focusing on CO2 storage potential and Enhanced Oil Recovery (EOR) assessments within India. This partnership underscores CCUS's role as a vital tool for emissions mitigation while simultaneously exploring avenues to boost oil production, signaling the expanding applicability of CCUS solutions in emerging global markets.
- February 2024: Fluor Corporation and Chevron New Energies entered into a significant license agreement, granting Chevron the rights to utilize Fluor's proprietary Econamine FG PlusSM technology. This agreement facilitates the reduction of CO2 emissions at Chevron's Eastridge facility, highlighting the active adoption of advanced and proven capture technologies by major industry stakeholders.
In-Depth CCUS Market Market Outlook
The future of the CCUS market is bright, with substantial growth potential driven by increasing environmental concerns, supportive government policies, and technological advancements. Strategic opportunities abound for companies involved in the development, deployment, and operation of CCUS projects. The market is expected to witness a significant expansion in the coming decade, driven by a growing number of large-scale CCUS projects and the integration of CCUS into broader energy transition strategies. The focus on carbon neutrality and the need to decarbonize hard-to-abate industries will propel further growth and investment in this vital sector.
CCUS Market Segmentation
-
1. Technology
- 1.1. Pre-combustion Capture
- 1.2. Oxy-fuel Combustion Capture
- 1.3. Post-combustion Capture
-
2. End-user Industry
- 2.1. Oil and Gas
- 2.2. Coal and Biomass Power Plant
- 2.3. Iron and Steel
- 2.4. Chemical
- 2.5. Cement
CCUS Market Segmentation By Geography
-
1. Asia Pacific
- 1.1. China
- 1.2. India
- 1.3. Japan
- 1.4. Australia
- 1.5. Rest of Asia Pacific
-
2. North America
- 2.1. United States
- 2.2. Canada
- 2.3. Mexico
-
3. Europe
- 3.1. Germany
- 3.2. United Kingdom
- 3.3. France
- 3.4. Norway
- 3.5. Netherlands
- 3.6. Rest of Europe
- 4. Rest of the World
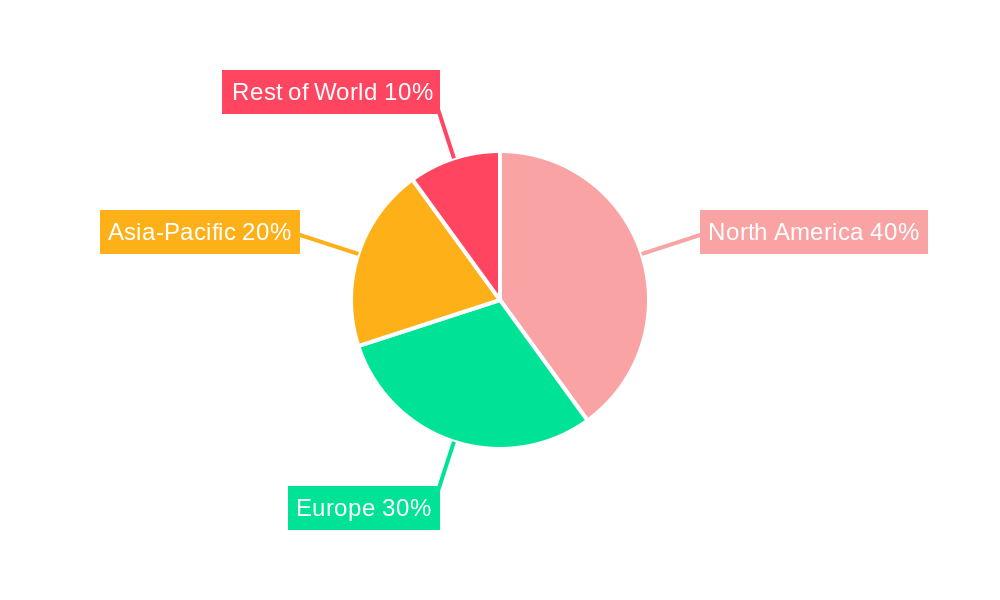
CCUS Market Regional Market Share
Geographic Coverage of CCUS Market
CCUS Market REPORT HIGHLIGHTS
| Aspects | Details |
|---|---|
| Study Period | 2020-2034 |
| Base Year | 2025 |
| Estimated Year | 2026 |
| Forecast Period | 2026-2034 |
| Historical Period | 2020-2025 |
| Growth Rate | CAGR of 14.21% from 2020-2034 |
| Segmentation |
|
Table of Contents
- 1. Introduction
- 1.1. Research Scope
- 1.2. Market Segmentation
- 1.3. Research Objective
- 1.4. Definitions and Assumptions
- 2. Executive Summary
- 2.1. Market Snapshot
- 3. Market Dynamics
- 3.1. Market Drivers
- 3.2. Market Restrains
- 3.3. Market Trends
- 3.4. Market Opportunities
- 4. Market Factor Analysis
- 4.1. Porters Five Forces
- 4.1.1. Bargaining Power of Suppliers
- 4.1.2. Bargaining Power of Buyers
- 4.1.3. Threat of New Entrants
- 4.1.4. Threat of Substitutes
- 4.1.5. Competitive Rivalry
- 4.2. PESTEL analysis
- 4.3. BCG Analysis
- 4.3.1. Stars (High Growth, High Market Share)
- 4.3.2. Cash Cows (Low Growth, High Market Share)
- 4.3.3. Question Mark (High Growth, Low Market Share)
- 4.3.4. Dogs (Low Growth, Low Market Share)
- 4.4. Ansoff Matrix Analysis
- 4.5. Supply Chain Analysis
- 4.6. Regulatory Landscape
- 4.7. Current Market Potential and Opportunity Assessment (TAM–SAM–SOM Framework)
- 4.8. VDR Analyst Note
- 4.1. Porters Five Forces
- 5. Market Analysis, Insights and Forecast 2021-2033
- 5.1. Market Analysis, Insights and Forecast - by Technology
- 5.1.1. Pre-combustion Capture
- 5.1.2. Oxy-fuel Combustion Capture
- 5.1.3. Post-combustion Capture
- 5.2. Market Analysis, Insights and Forecast - by End-user Industry
- 5.2.1. Oil and Gas
- 5.2.2. Coal and Biomass Power Plant
- 5.2.3. Iron and Steel
- 5.2.4. Chemical
- 5.2.5. Cement
- 5.3. Market Analysis, Insights and Forecast - by Region
- 5.3.1. Asia Pacific
- 5.3.2. North America
- 5.3.3. Europe
- 5.3.4. Rest of the World
- 5.1. Market Analysis, Insights and Forecast - by Technology
- 6. CCUS Market Analysis, Insights and Forecast, 2021-2033
- 6.1. Market Analysis, Insights and Forecast - by Technology
- 6.1.1. Pre-combustion Capture
- 6.1.2. Oxy-fuel Combustion Capture
- 6.1.3. Post-combustion Capture
- 6.2. Market Analysis, Insights and Forecast - by End-user Industry
- 6.2.1. Oil and Gas
- 6.2.2. Coal and Biomass Power Plant
- 6.2.3. Iron and Steel
- 6.2.4. Chemical
- 6.2.5. Cement
- 6.1. Market Analysis, Insights and Forecast - by Technology
- 7. Asia Pacific CCUS Market Analysis, Insights and Forecast, 2021-2033
- 7.1. Market Analysis, Insights and Forecast - by Technology
- 7.1.1. Pre-combustion Capture
- 7.1.2. Oxy-fuel Combustion Capture
- 7.1.3. Post-combustion Capture
- 7.2. Market Analysis, Insights and Forecast - by End-user Industry
- 7.2.1. Oil and Gas
- 7.2.2. Coal and Biomass Power Plant
- 7.2.3. Iron and Steel
- 7.2.4. Chemical
- 7.2.5. Cement
- 7.1. Market Analysis, Insights and Forecast - by Technology
- 8. North America CCUS Market Analysis, Insights and Forecast, 2021-2033
- 8.1. Market Analysis, Insights and Forecast - by Technology
- 8.1.1. Pre-combustion Capture
- 8.1.2. Oxy-fuel Combustion Capture
- 8.1.3. Post-combustion Capture
- 8.2. Market Analysis, Insights and Forecast - by End-user Industry
- 8.2.1. Oil and Gas
- 8.2.2. Coal and Biomass Power Plant
- 8.2.3. Iron and Steel
- 8.2.4. Chemical
- 8.2.5. Cement
- 8.1. Market Analysis, Insights and Forecast - by Technology
- 9. Europe CCUS Market Analysis, Insights and Forecast, 2021-2033
- 9.1. Market Analysis, Insights and Forecast - by Technology
- 9.1.1. Pre-combustion Capture
- 9.1.2. Oxy-fuel Combustion Capture
- 9.1.3. Post-combustion Capture
- 9.2. Market Analysis, Insights and Forecast - by End-user Industry
- 9.2.1. Oil and Gas
- 9.2.2. Coal and Biomass Power Plant
- 9.2.3. Iron and Steel
- 9.2.4. Chemical
- 9.2.5. Cement
- 9.1. Market Analysis, Insights and Forecast - by Technology
- 10. Rest of the World CCUS Market Analysis, Insights and Forecast, 2021-2033
- 10.1. Market Analysis, Insights and Forecast - by Technology
- 10.1.1. Pre-combustion Capture
- 10.1.2. Oxy-fuel Combustion Capture
- 10.1.3. Post-combustion Capture
- 10.2. Market Analysis, Insights and Forecast - by End-user Industry
- 10.2.1. Oil and Gas
- 10.2.2. Coal and Biomass Power Plant
- 10.2.3. Iron and Steel
- 10.2.4. Chemical
- 10.2.5. Cement
- 10.1. Market Analysis, Insights and Forecast - by Technology
- 11. Competitive Analysis
- 11.1. Company Profiles
- 11.1.1 Occidental Petroleum Corporation
- 11.1.1.1. Company Overview
- 11.1.1.2. Products
- 11.1.1.3. Company Financials
- 11.1.1.4. SWOT Analysis
- 11.1.2 Linde PLC
- 11.1.2.1. Company Overview
- 11.1.2.2. Products
- 11.1.2.3. Company Financials
- 11.1.2.4. SWOT Analysis
- 11.1.3 Shell PLC
- 11.1.3.1. Company Overview
- 11.1.3.2. Products
- 11.1.3.3. Company Financials
- 11.1.3.4. SWOT Analysis
- 11.1.4 Honeywell International Inc
- 11.1.4.1. Company Overview
- 11.1.4.2. Products
- 11.1.4.3. Company Financials
- 11.1.4.4. SWOT Analysis
- 11.1.5 General Electric
- 11.1.5.1. Company Overview
- 11.1.5.2. Products
- 11.1.5.3. Company Financials
- 11.1.5.4. SWOT Analysis
- 11.1.6 Exxon Mobil Corporation
- 11.1.6.1. Company Overview
- 11.1.6.2. Products
- 11.1.6.3. Company Financials
- 11.1.6.4. SWOT Analysis
- 11.1.7 Japan CCS Co Ltd
- 11.1.7.1. Company Overview
- 11.1.7.2. Products
- 11.1.7.3. Company Financials
- 11.1.7.4. SWOT Analysis
- 11.1.8 SLB*List Not Exhaustive
- 11.1.8.1. Company Overview
- 11.1.8.2. Products
- 11.1.8.3. Company Financials
- 11.1.8.4. SWOT Analysis
- 11.1.9 Fluor Corporation
- 11.1.9.1. Company Overview
- 11.1.9.2. Products
- 11.1.9.3. Company Financials
- 11.1.9.4. SWOT Analysis
- 11.1.10 Baker Hughes Company
- 11.1.10.1. Company Overview
- 11.1.10.2. Products
- 11.1.10.3. Company Financials
- 11.1.10.4. SWOT Analysis
- 11.1.11 Halliburton
- 11.1.11.1. Company Overview
- 11.1.11.2. Products
- 11.1.11.3. Company Financials
- 11.1.11.4. SWOT Analysis
- 11.1.12 Aker Solutions
- 11.1.12.1. Company Overview
- 11.1.12.2. Products
- 11.1.12.3. Company Financials
- 11.1.12.4. SWOT Analysis
- 11.1.13 Dakota Gasification Company
- 11.1.13.1. Company Overview
- 11.1.13.2. Products
- 11.1.13.3. Company Financials
- 11.1.13.4. SWOT Analysis
- 11.1.14 JX Nippon Oil & Gas Exploration Corporation
- 11.1.14.1. Company Overview
- 11.1.14.2. Products
- 11.1.14.3. Company Financials
- 11.1.14.4. SWOT Analysis
- 11.1.15 Siemens Energy
- 11.1.15.1. Company Overview
- 11.1.15.2. Products
- 11.1.15.3. Company Financials
- 11.1.15.4. SWOT Analysis
- 11.1.16 Air Liquide
- 11.1.16.1. Company Overview
- 11.1.16.2. Products
- 11.1.16.3. Company Financials
- 11.1.16.4. SWOT Analysis
- 11.1.17 Mitsubishi Heavy Industries Ltd
- 11.1.17.1. Company Overview
- 11.1.17.2. Products
- 11.1.17.3. Company Financials
- 11.1.17.4. SWOT Analysis
- 11.1.1 Occidental Petroleum Corporation
- 11.2. Market Entropy
- 11.2.1 Company's Key Areas Served
- 11.2.2 Recent Developments
- 11.3. Company Market Share Analysis 2025
- 11.3.1 Top 5 Companies Market Share Analysis
- 11.3.2 Top 3 Companies Market Share Analysis
- 11.4. List of Potential Customers
- 12. Research Methodology
List of Figures
- Figure 1: CCUS Market Revenue Breakdown (Million, %) by Product 2025 & 2033
- Figure 2: CCUS Market Share (%) by Company 2025
List of Tables
- Table 1: CCUS Market Revenue Million Forecast, by Technology 2020 & 2033
- Table 2: CCUS Market Volume K Tons Forecast, by Technology 2020 & 2033
- Table 3: CCUS Market Revenue Million Forecast, by End-user Industry 2020 & 2033
- Table 4: CCUS Market Volume K Tons Forecast, by End-user Industry 2020 & 2033
- Table 5: CCUS Market Revenue Million Forecast, by Region 2020 & 2033
- Table 6: CCUS Market Volume K Tons Forecast, by Region 2020 & 2033
- Table 7: CCUS Market Revenue Million Forecast, by Technology 2020 & 2033
- Table 8: CCUS Market Volume K Tons Forecast, by Technology 2020 & 2033
- Table 9: CCUS Market Revenue Million Forecast, by End-user Industry 2020 & 2033
- Table 10: CCUS Market Volume K Tons Forecast, by End-user Industry 2020 & 2033
- Table 11: CCUS Market Revenue Million Forecast, by Country 2020 & 2033
- Table 12: CCUS Market Volume K Tons Forecast, by Country 2020 & 2033
- Table 13: China CCUS Market Revenue (Million) Forecast, by Application 2020 & 2033
- Table 14: China CCUS Market Volume (K Tons) Forecast, by Application 2020 & 2033
- Table 15: India CCUS Market Revenue (Million) Forecast, by Application 2020 & 2033
- Table 16: India CCUS Market Volume (K Tons) Forecast, by Application 2020 & 2033
- Table 17: Japan CCUS Market Revenue (Million) Forecast, by Application 2020 & 2033
- Table 18: Japan CCUS Market Volume (K Tons) Forecast, by Application 2020 & 2033
- Table 19: Australia CCUS Market Revenue (Million) Forecast, by Application 2020 & 2033
- Table 20: Australia CCUS Market Volume (K Tons) Forecast, by Application 2020 & 2033
- Table 21: Rest of Asia Pacific CCUS Market Revenue (Million) Forecast, by Application 2020 & 2033
- Table 22: Rest of Asia Pacific CCUS Market Volume (K Tons) Forecast, by Application 2020 & 2033
- Table 23: CCUS Market Revenue Million Forecast, by Technology 2020 & 2033
- Table 24: CCUS Market Volume K Tons Forecast, by Technology 2020 & 2033
- Table 25: CCUS Market Revenue Million Forecast, by End-user Industry 2020 & 2033
- Table 26: CCUS Market Volume K Tons Forecast, by End-user Industry 2020 & 2033
- Table 27: CCUS Market Revenue Million Forecast, by Country 2020 & 2033
- Table 28: CCUS Market Volume K Tons Forecast, by Country 2020 & 2033
- Table 29: United States CCUS Market Revenue (Million) Forecast, by Application 2020 & 2033
- Table 30: United States CCUS Market Volume (K Tons) Forecast, by Application 2020 & 2033
- Table 31: Canada CCUS Market Revenue (Million) Forecast, by Application 2020 & 2033
- Table 32: Canada CCUS Market Volume (K Tons) Forecast, by Application 2020 & 2033
- Table 33: Mexico CCUS Market Revenue (Million) Forecast, by Application 2020 & 2033
- Table 34: Mexico CCUS Market Volume (K Tons) Forecast, by Application 2020 & 2033
- Table 35: CCUS Market Revenue Million Forecast, by Technology 2020 & 2033
- Table 36: CCUS Market Volume K Tons Forecast, by Technology 2020 & 2033
- Table 37: CCUS Market Revenue Million Forecast, by End-user Industry 2020 & 2033
- Table 38: CCUS Market Volume K Tons Forecast, by End-user Industry 2020 & 2033
- Table 39: CCUS Market Revenue Million Forecast, by Country 2020 & 2033
- Table 40: CCUS Market Volume K Tons Forecast, by Country 2020 & 2033
- Table 41: Germany CCUS Market Revenue (Million) Forecast, by Application 2020 & 2033
- Table 42: Germany CCUS Market Volume (K Tons) Forecast, by Application 2020 & 2033
- Table 43: United Kingdom CCUS Market Revenue (Million) Forecast, by Application 2020 & 2033
- Table 44: United Kingdom CCUS Market Volume (K Tons) Forecast, by Application 2020 & 2033
- Table 45: France CCUS Market Revenue (Million) Forecast, by Application 2020 & 2033
- Table 46: France CCUS Market Volume (K Tons) Forecast, by Application 2020 & 2033
- Table 47: Norway CCUS Market Revenue (Million) Forecast, by Application 2020 & 2033
- Table 48: Norway CCUS Market Volume (K Tons) Forecast, by Application 2020 & 2033
- Table 49: Netherlands CCUS Market Revenue (Million) Forecast, by Application 2020 & 2033
- Table 50: Netherlands CCUS Market Volume (K Tons) Forecast, by Application 2020 & 2033
- Table 51: Rest of Europe CCUS Market Revenue (Million) Forecast, by Application 2020 & 2033
- Table 52: Rest of Europe CCUS Market Volume (K Tons) Forecast, by Application 2020 & 2033
- Table 53: CCUS Market Revenue Million Forecast, by Technology 2020 & 2033
- Table 54: CCUS Market Volume K Tons Forecast, by Technology 2020 & 2033
- Table 55: CCUS Market Revenue Million Forecast, by End-user Industry 2020 & 2033
- Table 56: CCUS Market Volume K Tons Forecast, by End-user Industry 2020 & 2033
- Table 57: CCUS Market Revenue Million Forecast, by Country 2020 & 2033
- Table 58: CCUS Market Volume K Tons Forecast, by Country 2020 & 2033
Frequently Asked Questions
1. What is the projected Compound Annual Growth Rate (CAGR) of the CCUS Market?
The projected CAGR is approximately 14.21%.
2. Which companies are prominent players in the CCUS Market?
Key companies in the market include Occidental Petroleum Corporation, Linde PLC, Shell PLC, Honeywell International Inc, General Electric, Exxon Mobil Corporation, Japan CCS Co Ltd, SLB*List Not Exhaustive, Fluor Corporation, Baker Hughes Company, Halliburton, Aker Solutions, Dakota Gasification Company, JX Nippon Oil & Gas Exploration Corporation, Siemens Energy, Air Liquide, Mitsubishi Heavy Industries Ltd.
3. What are the main segments of the CCUS Market?
The market segments include Technology, End-user Industry.
4. Can you provide details about the market size?
The market size is estimated to be USD 2.42 Million as of 2022.
5. What are some drivers contributing to market growth?
Emerging Demand for CO2 Injection Technique for Enhanced Oil Recovery (EOR); Strict Government Norms Toward GHG Emissions.
6. What are the notable trends driving market growth?
Oil and Gas Segment to Dominate the Market.
7. Are there any restraints impacting market growth?
Huge CCS Technology Implementation Costs; Growth in Shale Investments.
8. Can you provide examples of recent developments in the market?
March 2024: JX Nippon Oil & Gas Exploration Corporation and Chevron New Energies, a division of Chevron U.S.A. Inc., entered into a memorandum of understanding aimed at assessing the potential export of carbon dioxide from Japan to carbon capture and storage (CCS) initiatives situated in Australia and other nations across Asia-Pacific. This agreement enhances the company's market footprint.
9. What pricing options are available for accessing the report?
Pricing options include single-user, multi-user, and enterprise licenses priced at USD 4750, USD 5250, and USD 8750 respectively.
10. Is the market size provided in terms of value or volume?
The market size is provided in terms of value, measured in Million and volume, measured in K Tons.
11. Are there any specific market keywords associated with the report?
Yes, the market keyword associated with the report is "CCUS Market," which aids in identifying and referencing the specific market segment covered.
12. How do I determine which pricing option suits my needs best?
The pricing options vary based on user requirements and access needs. Individual users may opt for single-user licenses, while businesses requiring broader access may choose multi-user or enterprise licenses for cost-effective access to the report.
13. Are there any additional resources or data provided in the CCUS Market report?
While the report offers comprehensive insights, it's advisable to review the specific contents or supplementary materials provided to ascertain if additional resources or data are available.
14. How can I stay updated on further developments or reports in the CCUS Market?
To stay informed about further developments, trends, and reports in the CCUS Market, consider subscribing to industry newsletters, following relevant companies and organizations, or regularly checking reputable industry news sources and publications.
Methodology
Step 1 - Identification of Relevant Samples Size from Population Database


Step 2 - Approaches for Defining Global Market Size (Value, Volume* & Price*)

Note*: In applicable scenarios
Step 3 - Data Sources
Primary Research
- Web Analytics
- Survey Reports
- Research Institute
- Latest Research Reports
- Opinion Leaders
Secondary Research
- Annual Reports
- White Paper
- Latest Press Release
- Industry Association
- Paid Database
- Investor Presentations

Step 4 - Data Triangulation
Involves using different sources of information in order to increase the validity of a study
These sources are likely to be stakeholders in a program - participants, other researchers, program staff, other community members, and so on.
Then we put all data in single framework & apply various statistical tools to find out the dynamic on the market.
During the analysis stage, feedback from the stakeholder groups would be compared to determine areas of agreement as well as areas of divergence