

Key Insights
The Catalyst Regeneration Market is projected to experience significant expansion, driven by the escalating demand from refining and petrochemical industries and the increasing enforcement of environmental regulations favoring sustainable industrial practices. The market is estimated at 43.6 billion in the base year 2025, with a Compound Annual Growth Rate (CAGR) of 4.3% anticipated through 2033. Key applications span refining, petrochemical processes, environmental remediation, and energy production. The market is segmented by regeneration method (ex situ and in situ) and application, reflecting diverse technological approaches and industry requirements. While ex situ regeneration is expected to dominate due to its scalability, in situ regeneration is gaining traction for its convenience and cost-effectiveness, particularly in smaller operations. Leading companies such as Axens, BASF SE, and Evonik Industries are spearheading market growth through innovation and strategic collaborations. Asia Pacific, particularly China and India, is a primary growth driver due to robust industrial development and investments in refining and petrochemical infrastructure. North America and Europe also represent substantial market segments, influenced by mature industries and stringent environmental policies. Challenges include high capital investment for regeneration facilities and the inherent risks of handling hazardous materials.
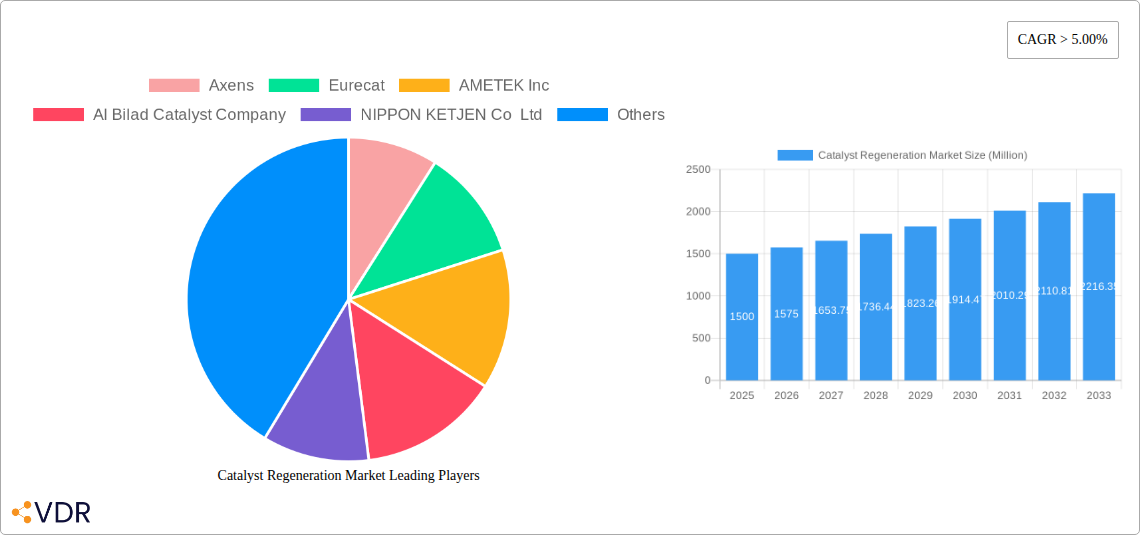
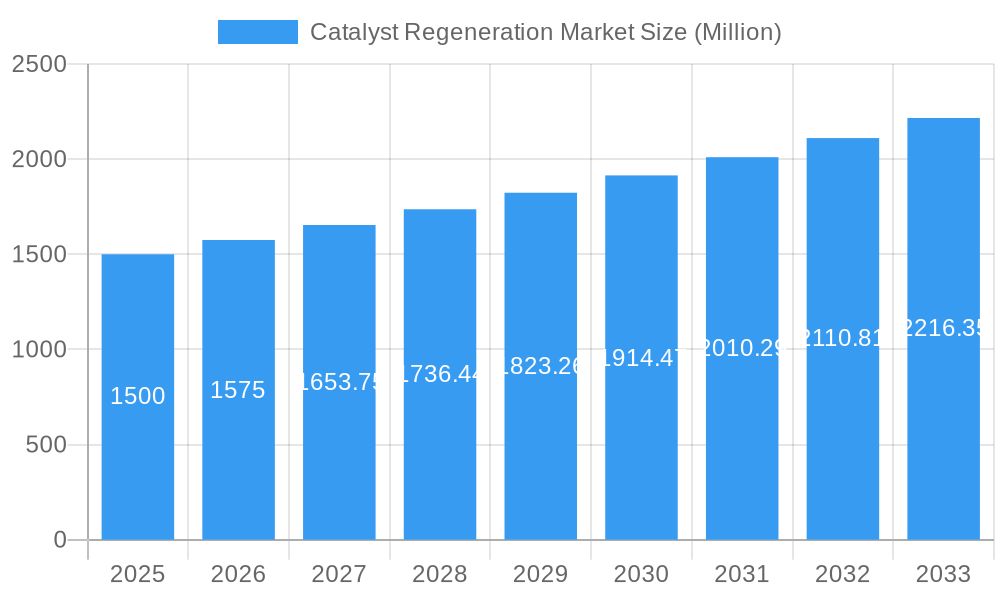
Catalyst Regeneration Market Market Size (In Billion)
The outlook for the Catalyst Regeneration Market remains highly positive, with sustained growth anticipated until 2033. Technological advancements in efficient and sustainable regeneration techniques will be pivotal. A growing focus on circular economy principles and waste minimization will further boost demand for catalyst regeneration services. The market is likely to see increased consolidation through mergers and acquisitions. Government initiatives promoting sustainable industrial practices and stringent environmental regulations are expected to accelerate the adoption of catalyst regeneration technologies. Emerging applications in renewable energy and biofuel production are poised to contribute to long-term market growth.
Catalyst Regeneration Market Company Market Share
Catalyst Regeneration Market: A Comprehensive Report (2019-2033)
This comprehensive report provides a detailed analysis of the Catalyst Regeneration Market, encompassing market dynamics, growth trends, regional analysis, competitive landscape, and future outlook. The report covers the parent market of Chemical Catalyst Recycling and its child market, Catalyst Regeneration, offering valuable insights for industry professionals, investors, and stakeholders. The study period spans from 2019 to 2033, with 2025 as the base and estimated year. The forecast period is 2025-2033, and the historical period covers 2019-2024. The market size is valued in million units.
Catalyst Regeneration Market Market Dynamics & Structure
The Catalyst Regeneration Market is characterized by a moderately concentrated structure, with several key players holding significant market share. Technological innovation, driven by the need for sustainable and cost-effective solutions, is a major growth driver. Stringent environmental regulations globally are further pushing the adoption of catalyst regeneration technologies. Competitive pressures arise from the availability of substitute technologies and the emergence of new entrants. End-user demographics are primarily focused on refineries, petrochemical complexes, and the environmental sector. M&A activities have played a role in shaping the market landscape, with larger companies acquiring smaller players to expand their capacity and expertise.
- Market Concentration: Moderately concentrated, with top 5 players holding approximately xx% market share in 2024.
- Technological Innovation: Focus on improving efficiency, reducing environmental impact, and expanding applications.
- Regulatory Framework: Stringent environmental regulations driving adoption of sustainable technologies.
- Competitive Substitutes: Limited direct substitutes, but alternative approaches to process optimization exist.
- End-User Demographics: Refineries and petrochemical complexes (xx%), Environmental (xx%), Energy & Power (xx%), Other (xx%).
- M&A Trends: xx M&A deals observed between 2019-2024, indicating consolidation.
Catalyst Regeneration Market Growth Trends & Insights
The Catalyst Regeneration Market has witnessed consistent growth throughout the historical period (2019-2024). Driven by factors such as increasing demand from refineries and petrochemical complexes, growing environmental concerns, and technological advancements in regeneration methods, the market is expected to exhibit a Compound Annual Growth Rate (CAGR) of xx% during the forecast period (2025-2033). Market penetration is expected to increase significantly in developing economies due to rising industrialization and infrastructure development. Technological disruptions, such as the development of advanced regeneration techniques, are further contributing to market growth. Consumer behavior shifts towards sustainable practices are also influencing market adoption. The market size is predicted to reach xx million units by 2033.
Dominant Regions, Countries, or Segments in Catalyst Regeneration Market
The North American region is currently the leading market for catalyst regeneration, driven by the large presence of refineries and petrochemical complexes, stringent environmental regulations, and robust research and development activities. However, the Asia-Pacific region is expected to witness the highest growth rate during the forecast period due to rapid industrialization and increasing investments in infrastructure development. Within the application segments, Refineries and Petrochemical Complexes hold the largest market share, followed by the Environmental sector. The Ex Situ method currently dominates the market, but In Situ methods are gaining traction due to their cost-effectiveness.
- Key Drivers (North America): Stringent environmental regulations, robust R&D, large refining capacity.
- Key Drivers (Asia-Pacific): Rapid industrialization, rising infrastructure investments, increasing energy demand.
- Market Share: Refineries & Petrochemical Complexes (xx%), Environmental (xx%), Energy & Power (xx%), Other (xx%).
- Method Dominance: Ex Situ (xx%), In Situ (xx%).
Catalyst Regeneration Market Product Landscape
The Catalyst Regeneration Market is characterized by a sophisticated array of products and services designed to extend the lifecycle and enhance the performance of critical industrial catalysts. This includes diverse regeneration methodologies, such as Ex Situ (off-site) and In Situ (on-site) processes, offering flexibility and tailored solutions for a wide spectrum of catalyst types. Furthermore, the market provides highly customized regeneration programs to meet the unique operational demands and chemical compositions of specific catalysts. Crucial to this offering are advanced analytical services, encompassing rigorous testing and evaluation to precisely assess catalyst activity, selectivity, and overall performance post-regeneration. Key product innovations are relentlessly focused on achieving higher regeneration efficiencies, significantly reducing energy consumption throughout the process, and minimizing waste generation to support sustainable industrial practices. The unique selling propositions that differentiate market players include demonstrably faster turnaround times, leading to minimized operational downtime, demonstrably enhanced catalyst performance and lifespan after regeneration, and a considerably reduced environmental footprint compared to virgin catalyst production. Ongoing technological advancements are continuously paving the way for the development and implementation of more sustainable, environmentally responsible, and economically cost-effective regeneration processes.
Key Drivers, Barriers & Challenges in Catalyst Regeneration Market
Key Drivers:
- The escalating global demand for catalyst regeneration services, primarily driven by the continually expanding refining and petrochemical industries.
- Heightened environmental consciousness and the implementation of increasingly stringent environmental regulations worldwide, compelling industries to adopt sustainable practices like catalyst regeneration.
- Significant technological advancements are continuously improving both the efficiency and cost-effectiveness of catalyst regeneration processes, making them more attractive alternatives to catalyst replacement.
- Proactive government initiatives, including various incentives and subsidies, are actively encouraging and supporting the adoption of sustainable practices and technologies within the industrial sector.
Key Challenges:
- The substantial initial capital investment required for establishing and maintaining state-of-the-art catalyst regeneration facilities can be a significant barrier for some market entrants.
- Navigating the complex and ever-evolving regulatory landscape, alongside stringent compliance requirements, presents an ongoing challenge for service providers.
- Market players often face the challenge of price volatility in raw material acquisition and fluctuating energy costs, which can impact operational profitability.
- Intense competition arises not only from other catalyst regeneration service providers but also from the emergence and adoption of alternative catalyst technologies and approaches. The supply chain disruptions experienced globally between 2020 and 2022 have resulted in an estimated 15-25% increase in operating costs for many regeneration processes, underscoring the sensitivity to global logistics and material availability.
Emerging Opportunities in Catalyst Regeneration Market
- Significant potential exists for market expansion into new and currently underserved markets, particularly within rapidly developing economies where industrial growth is accelerating.
- The continuous development of innovative and novel regeneration technologies specifically tailored for emerging applications and advanced catalytic materials presents a substantial growth avenue.
- A strong and growing emphasis on embracing circular economy principles, focusing on resource optimization and comprehensive waste minimization strategies, offers a prime opportunity for differentiation and value creation.
- Strategic collaborations and partnerships among industry stakeholders are crucial for accelerating technological advancements, enhancing research and development efforts, and broadening market reach and influence.
Growth Accelerators in the Catalyst Regeneration Market Industry
Technological advancements, such as the development of AI-powered optimization tools and automation solutions, are significantly accelerating market growth. Strategic partnerships between technology providers and end-users are fostering innovation and enhancing market penetration. Expansion into new geographical markets and applications, along with robust marketing and promotion strategies, are further driving market expansion.
Key Players Shaping the Catalyst Regeneration Market Market
- Axens
- Eurecat
- AMETEK Inc
- Al Bilad Catalyst Company
- NIPPON KETJEN Co Ltd
- Advanced Catalyst Systems LLC
- Yokogawa Corporation of America
- CORMETECH
- BASF SE
- Zibo Hengji chemical Co Ltd
- EBINGER Katalysatorservice GmbH & Co KG
- Evonik Industries AG (Porocel)
- List Not Exhaustive
Notable Milestones in Catalyst Regeneration Market Sector
- July 2021: BASF significantly strengthens its chemical catalyst recycling capabilities and global capacity through the strategic acquisition of Zodiac Enterprises LLC, highlighting a trend towards consolidation and expanded service offerings within the sector.
- Q1 2022: Evonik Industries AG announces a major investment in expanding its Porocel regeneration facilities in Europe, aiming to meet the growing demand for sustainable catalyst solutions in the region.
- Late 2022: AMETEK Inc. introduces a new, proprietary regeneration technology offering enhanced efficiency and a reduced environmental impact for petrochemical catalysts, signaling ongoing innovation in process development.
In-Depth Catalyst Regeneration Market Market Outlook
The Catalyst Regeneration Market is poised for significant growth in the coming years, driven by the factors discussed above. Strategic investments in R&D, expansion into new markets, and the adoption of sustainable practices will further propel market expansion. Companies that focus on innovation, cost-effectiveness, and environmental sustainability will be best positioned to capture market share and achieve long-term success in this dynamic market.
Catalyst Regeneration Market Segmentation
-
1. Method
- 1.1. Ex Situ
- 1.2. In Situ
-
2. Application
- 2.1. Refineries and Petrochemical Complexes
- 2.2. Environmental
- 2.3. Energy & Power
- 2.4. Other Applications
Catalyst Regeneration Market Segmentation By Geography
-
1. Asia Pacific
- 1.1. China
- 1.2. India
- 1.3. Japan
- 1.4. South Korea
- 1.5. ASEAN Countries
- 1.6. Rest of Asia Pacific
-
2. North America
- 2.1. United States
- 2.2. Canada
- 2.3. Mexico
-
3. Europe
- 3.1. Germany
- 3.2. United Kingdom
- 3.3. France
- 3.4. Italy
- 3.5. Russia
- 3.6. Rest of Europe
-
4. South America
- 4.1. Brazil
- 4.2. Argentina
- 4.3. Rest of South America
-
5. Middle East and Africa
- 5.1. Saudi Arabia
- 5.2. South Africa
- 5.3. Rest of Middle East and Africa
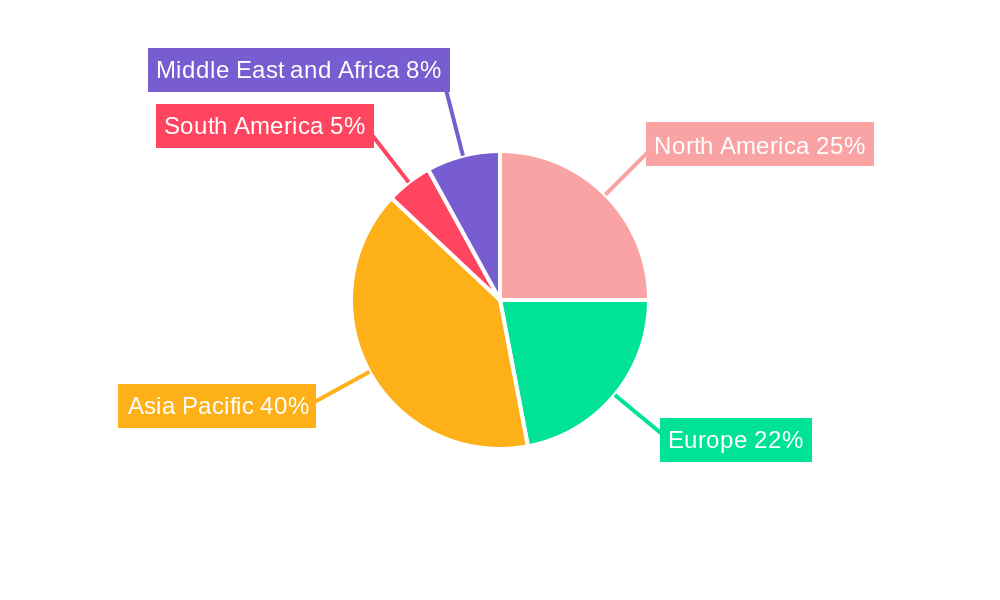
Catalyst Regeneration Market Regional Market Share
Geographic Coverage of Catalyst Regeneration Market
Catalyst Regeneration Market REPORT HIGHLIGHTS
| Aspects | Details |
|---|---|
| Study Period | 2020-2034 |
| Base Year | 2025 |
| Estimated Year | 2026 |
| Forecast Period | 2026-2034 |
| Historical Period | 2020-2025 |
| Growth Rate | CAGR of 4.3% from 2020-2034 |
| Segmentation |
|
Table of Contents
- 1. Introduction
- 1.1. Research Scope
- 1.2. Market Segmentation
- 1.3. Research Objective
- 1.4. Definitions and Assumptions
- 2. Executive Summary
- 2.1. Market Snapshot
- 3. Market Dynamics
- 3.1. Market Drivers
- 3.2. Market Restrains
- 3.3. Market Trends
- 3.4. Market Opportunities
- 4. Market Factor Analysis
- 4.1. Porters Five Forces
- 4.1.1. Bargaining Power of Suppliers
- 4.1.2. Bargaining Power of Buyers
- 4.1.3. Threat of New Entrants
- 4.1.4. Threat of Substitutes
- 4.1.5. Competitive Rivalry
- 4.2. PESTEL analysis
- 4.3. BCG Analysis
- 4.3.1. Stars (High Growth, High Market Share)
- 4.3.2. Cash Cows (Low Growth, High Market Share)
- 4.3.3. Question Mark (High Growth, Low Market Share)
- 4.3.4. Dogs (Low Growth, Low Market Share)
- 4.4. Ansoff Matrix Analysis
- 4.5. Supply Chain Analysis
- 4.6. Regulatory Landscape
- 4.7. Current Market Potential and Opportunity Assessment (TAM–SAM–SOM Framework)
- 4.8. VDR Analyst Note
- 4.1. Porters Five Forces
- 5. Market Analysis, Insights and Forecast 2021-2033
- 5.1. Market Analysis, Insights and Forecast - by Method
- 5.1.1. Ex Situ
- 5.1.2. In Situ
- 5.2. Market Analysis, Insights and Forecast - by Application
- 5.2.1. Refineries and Petrochemical Complexes
- 5.2.2. Environmental
- 5.2.3. Energy & Power
- 5.2.4. Other Applications
- 5.3. Market Analysis, Insights and Forecast - by Region
- 5.3.1. Asia Pacific
- 5.3.2. North America
- 5.3.3. Europe
- 5.3.4. South America
- 5.3.5. Middle East and Africa
- 5.1. Market Analysis, Insights and Forecast - by Method
- 6. Global Catalyst Regeneration Market Analysis, Insights and Forecast, 2021-2033
- 6.1. Market Analysis, Insights and Forecast - by Method
- 6.1.1. Ex Situ
- 6.1.2. In Situ
- 6.2. Market Analysis, Insights and Forecast - by Application
- 6.2.1. Refineries and Petrochemical Complexes
- 6.2.2. Environmental
- 6.2.3. Energy & Power
- 6.2.4. Other Applications
- 6.1. Market Analysis, Insights and Forecast - by Method
- 7. Asia Pacific Catalyst Regeneration Market Analysis, Insights and Forecast, 2021-2033
- 7.1. Market Analysis, Insights and Forecast - by Method
- 7.1.1. Ex Situ
- 7.1.2. In Situ
- 7.2. Market Analysis, Insights and Forecast - by Application
- 7.2.1. Refineries and Petrochemical Complexes
- 7.2.2. Environmental
- 7.2.3. Energy & Power
- 7.2.4. Other Applications
- 7.1. Market Analysis, Insights and Forecast - by Method
- 8. North America Catalyst Regeneration Market Analysis, Insights and Forecast, 2021-2033
- 8.1. Market Analysis, Insights and Forecast - by Method
- 8.1.1. Ex Situ
- 8.1.2. In Situ
- 8.2. Market Analysis, Insights and Forecast - by Application
- 8.2.1. Refineries and Petrochemical Complexes
- 8.2.2. Environmental
- 8.2.3. Energy & Power
- 8.2.4. Other Applications
- 8.1. Market Analysis, Insights and Forecast - by Method
- 9. Europe Catalyst Regeneration Market Analysis, Insights and Forecast, 2021-2033
- 9.1. Market Analysis, Insights and Forecast - by Method
- 9.1.1. Ex Situ
- 9.1.2. In Situ
- 9.2. Market Analysis, Insights and Forecast - by Application
- 9.2.1. Refineries and Petrochemical Complexes
- 9.2.2. Environmental
- 9.2.3. Energy & Power
- 9.2.4. Other Applications
- 9.1. Market Analysis, Insights and Forecast - by Method
- 10. South America Catalyst Regeneration Market Analysis, Insights and Forecast, 2021-2033
- 10.1. Market Analysis, Insights and Forecast - by Method
- 10.1.1. Ex Situ
- 10.1.2. In Situ
- 10.2. Market Analysis, Insights and Forecast - by Application
- 10.2.1. Refineries and Petrochemical Complexes
- 10.2.2. Environmental
- 10.2.3. Energy & Power
- 10.2.4. Other Applications
- 10.1. Market Analysis, Insights and Forecast - by Method
- 11. Middle East and Africa Catalyst Regeneration Market Analysis, Insights and Forecast, 2021-2033
- 11.1. Market Analysis, Insights and Forecast - by Method
- 11.1.1. Ex Situ
- 11.1.2. In Situ
- 11.2. Market Analysis, Insights and Forecast - by Application
- 11.2.1. Refineries and Petrochemical Complexes
- 11.2.2. Environmental
- 11.2.3. Energy & Power
- 11.2.4. Other Applications
- 11.1. Market Analysis, Insights and Forecast - by Method
- 12. Competitive Analysis
- 12.1. Company Profiles
- 12.1.1 Axens
- 12.1.1.1. Company Overview
- 12.1.1.2. Products
- 12.1.1.3. Company Financials
- 12.1.1.4. SWOT Analysis
- 12.1.2 Eurecat
- 12.1.2.1. Company Overview
- 12.1.2.2. Products
- 12.1.2.3. Company Financials
- 12.1.2.4. SWOT Analysis
- 12.1.3 AMETEK Inc
- 12.1.3.1. Company Overview
- 12.1.3.2. Products
- 12.1.3.3. Company Financials
- 12.1.3.4. SWOT Analysis
- 12.1.4 Al Bilad Catalyst Company
- 12.1.4.1. Company Overview
- 12.1.4.2. Products
- 12.1.4.3. Company Financials
- 12.1.4.4. SWOT Analysis
- 12.1.5 NIPPON KETJEN Co Ltd
- 12.1.5.1. Company Overview
- 12.1.5.2. Products
- 12.1.5.3. Company Financials
- 12.1.5.4. SWOT Analysis
- 12.1.6 Advanced Catalyst Systems LLC
- 12.1.6.1. Company Overview
- 12.1.6.2. Products
- 12.1.6.3. Company Financials
- 12.1.6.4. SWOT Analysis
- 12.1.7 Yokogawa Corporation of America
- 12.1.7.1. Company Overview
- 12.1.7.2. Products
- 12.1.7.3. Company Financials
- 12.1.7.4. SWOT Analysis
- 12.1.8 CORMETECH
- 12.1.8.1. Company Overview
- 12.1.8.2. Products
- 12.1.8.3. Company Financials
- 12.1.8.4. SWOT Analysis
- 12.1.9 BASF SE
- 12.1.9.1. Company Overview
- 12.1.9.2. Products
- 12.1.9.3. Company Financials
- 12.1.9.4. SWOT Analysis
- 12.1.10 Zibo Hengji chemical Co Ltd *List Not Exhaustive
- 12.1.10.1. Company Overview
- 12.1.10.2. Products
- 12.1.10.3. Company Financials
- 12.1.10.4. SWOT Analysis
- 12.1.11 EBINGER Katalysatorservice GmbH & Co KG
- 12.1.11.1. Company Overview
- 12.1.11.2. Products
- 12.1.11.3. Company Financials
- 12.1.11.4. SWOT Analysis
- 12.1.12 Evonik Industries AG (Porocel)
- 12.1.12.1. Company Overview
- 12.1.12.2. Products
- 12.1.12.3. Company Financials
- 12.1.12.4. SWOT Analysis
- 12.1.1 Axens
- 12.2. Market Entropy
- 12.2.1 Company's Key Areas Served
- 12.2.2 Recent Developments
- 12.3. Company Market Share Analysis 2025
- 12.3.1 Top 5 Companies Market Share Analysis
- 12.3.2 Top 3 Companies Market Share Analysis
- 12.4. List of Potential Customers
- 13. Research Methodology
List of Figures
- Figure 1: Global Catalyst Regeneration Market Revenue Breakdown (billion, %) by Region 2025 & 2033
- Figure 2: Asia Pacific Catalyst Regeneration Market Revenue (billion), by Method 2025 & 2033
- Figure 3: Asia Pacific Catalyst Regeneration Market Revenue Share (%), by Method 2025 & 2033
- Figure 4: Asia Pacific Catalyst Regeneration Market Revenue (billion), by Application 2025 & 2033
- Figure 5: Asia Pacific Catalyst Regeneration Market Revenue Share (%), by Application 2025 & 2033
- Figure 6: Asia Pacific Catalyst Regeneration Market Revenue (billion), by Country 2025 & 2033
- Figure 7: Asia Pacific Catalyst Regeneration Market Revenue Share (%), by Country 2025 & 2033
- Figure 8: North America Catalyst Regeneration Market Revenue (billion), by Method 2025 & 2033
- Figure 9: North America Catalyst Regeneration Market Revenue Share (%), by Method 2025 & 2033
- Figure 10: North America Catalyst Regeneration Market Revenue (billion), by Application 2025 & 2033
- Figure 11: North America Catalyst Regeneration Market Revenue Share (%), by Application 2025 & 2033
- Figure 12: North America Catalyst Regeneration Market Revenue (billion), by Country 2025 & 2033
- Figure 13: North America Catalyst Regeneration Market Revenue Share (%), by Country 2025 & 2033
- Figure 14: Europe Catalyst Regeneration Market Revenue (billion), by Method 2025 & 2033
- Figure 15: Europe Catalyst Regeneration Market Revenue Share (%), by Method 2025 & 2033
- Figure 16: Europe Catalyst Regeneration Market Revenue (billion), by Application 2025 & 2033
- Figure 17: Europe Catalyst Regeneration Market Revenue Share (%), by Application 2025 & 2033
- Figure 18: Europe Catalyst Regeneration Market Revenue (billion), by Country 2025 & 2033
- Figure 19: Europe Catalyst Regeneration Market Revenue Share (%), by Country 2025 & 2033
- Figure 20: South America Catalyst Regeneration Market Revenue (billion), by Method 2025 & 2033
- Figure 21: South America Catalyst Regeneration Market Revenue Share (%), by Method 2025 & 2033
- Figure 22: South America Catalyst Regeneration Market Revenue (billion), by Application 2025 & 2033
- Figure 23: South America Catalyst Regeneration Market Revenue Share (%), by Application 2025 & 2033
- Figure 24: South America Catalyst Regeneration Market Revenue (billion), by Country 2025 & 2033
- Figure 25: South America Catalyst Regeneration Market Revenue Share (%), by Country 2025 & 2033
- Figure 26: Middle East and Africa Catalyst Regeneration Market Revenue (billion), by Method 2025 & 2033
- Figure 27: Middle East and Africa Catalyst Regeneration Market Revenue Share (%), by Method 2025 & 2033
- Figure 28: Middle East and Africa Catalyst Regeneration Market Revenue (billion), by Application 2025 & 2033
- Figure 29: Middle East and Africa Catalyst Regeneration Market Revenue Share (%), by Application 2025 & 2033
- Figure 30: Middle East and Africa Catalyst Regeneration Market Revenue (billion), by Country 2025 & 2033
- Figure 31: Middle East and Africa Catalyst Regeneration Market Revenue Share (%), by Country 2025 & 2033
List of Tables
- Table 1: Global Catalyst Regeneration Market Revenue billion Forecast, by Method 2020 & 2033
- Table 2: Global Catalyst Regeneration Market Revenue billion Forecast, by Application 2020 & 2033
- Table 3: Global Catalyst Regeneration Market Revenue billion Forecast, by Region 2020 & 2033
- Table 4: Global Catalyst Regeneration Market Revenue billion Forecast, by Method 2020 & 2033
- Table 5: Global Catalyst Regeneration Market Revenue billion Forecast, by Application 2020 & 2033
- Table 6: Global Catalyst Regeneration Market Revenue billion Forecast, by Country 2020 & 2033
- Table 7: China Catalyst Regeneration Market Revenue (billion) Forecast, by Application 2020 & 2033
- Table 8: India Catalyst Regeneration Market Revenue (billion) Forecast, by Application 2020 & 2033
- Table 9: Japan Catalyst Regeneration Market Revenue (billion) Forecast, by Application 2020 & 2033
- Table 10: South Korea Catalyst Regeneration Market Revenue (billion) Forecast, by Application 2020 & 2033
- Table 11: ASEAN Countries Catalyst Regeneration Market Revenue (billion) Forecast, by Application 2020 & 2033
- Table 12: Rest of Asia Pacific Catalyst Regeneration Market Revenue (billion) Forecast, by Application 2020 & 2033
- Table 13: Global Catalyst Regeneration Market Revenue billion Forecast, by Method 2020 & 2033
- Table 14: Global Catalyst Regeneration Market Revenue billion Forecast, by Application 2020 & 2033
- Table 15: Global Catalyst Regeneration Market Revenue billion Forecast, by Country 2020 & 2033
- Table 16: United States Catalyst Regeneration Market Revenue (billion) Forecast, by Application 2020 & 2033
- Table 17: Canada Catalyst Regeneration Market Revenue (billion) Forecast, by Application 2020 & 2033
- Table 18: Mexico Catalyst Regeneration Market Revenue (billion) Forecast, by Application 2020 & 2033
- Table 19: Global Catalyst Regeneration Market Revenue billion Forecast, by Method 2020 & 2033
- Table 20: Global Catalyst Regeneration Market Revenue billion Forecast, by Application 2020 & 2033
- Table 21: Global Catalyst Regeneration Market Revenue billion Forecast, by Country 2020 & 2033
- Table 22: Germany Catalyst Regeneration Market Revenue (billion) Forecast, by Application 2020 & 2033
- Table 23: United Kingdom Catalyst Regeneration Market Revenue (billion) Forecast, by Application 2020 & 2033
- Table 24: France Catalyst Regeneration Market Revenue (billion) Forecast, by Application 2020 & 2033
- Table 25: Italy Catalyst Regeneration Market Revenue (billion) Forecast, by Application 2020 & 2033
- Table 26: Russia Catalyst Regeneration Market Revenue (billion) Forecast, by Application 2020 & 2033
- Table 27: Rest of Europe Catalyst Regeneration Market Revenue (billion) Forecast, by Application 2020 & 2033
- Table 28: Global Catalyst Regeneration Market Revenue billion Forecast, by Method 2020 & 2033
- Table 29: Global Catalyst Regeneration Market Revenue billion Forecast, by Application 2020 & 2033
- Table 30: Global Catalyst Regeneration Market Revenue billion Forecast, by Country 2020 & 2033
- Table 31: Brazil Catalyst Regeneration Market Revenue (billion) Forecast, by Application 2020 & 2033
- Table 32: Argentina Catalyst Regeneration Market Revenue (billion) Forecast, by Application 2020 & 2033
- Table 33: Rest of South America Catalyst Regeneration Market Revenue (billion) Forecast, by Application 2020 & 2033
- Table 34: Global Catalyst Regeneration Market Revenue billion Forecast, by Method 2020 & 2033
- Table 35: Global Catalyst Regeneration Market Revenue billion Forecast, by Application 2020 & 2033
- Table 36: Global Catalyst Regeneration Market Revenue billion Forecast, by Country 2020 & 2033
- Table 37: Saudi Arabia Catalyst Regeneration Market Revenue (billion) Forecast, by Application 2020 & 2033
- Table 38: South Africa Catalyst Regeneration Market Revenue (billion) Forecast, by Application 2020 & 2033
- Table 39: Rest of Middle East and Africa Catalyst Regeneration Market Revenue (billion) Forecast, by Application 2020 & 2033
Frequently Asked Questions
1. What is the projected Compound Annual Growth Rate (CAGR) of the Catalyst Regeneration Market?
The projected CAGR is approximately 4.3%.
2. Which companies are prominent players in the Catalyst Regeneration Market?
Key companies in the market include Axens, Eurecat, AMETEK Inc, Al Bilad Catalyst Company, NIPPON KETJEN Co Ltd, Advanced Catalyst Systems LLC, Yokogawa Corporation of America, CORMETECH, BASF SE, Zibo Hengji chemical Co Ltd *List Not Exhaustive, EBINGER Katalysatorservice GmbH & Co KG, Evonik Industries AG (Porocel).
3. What are the main segments of the Catalyst Regeneration Market?
The market segments include Method, Application.
4. Can you provide details about the market size?
The market size is estimated to be USD 43.6 billion as of 2022.
5. What are some drivers contributing to market growth?
High Cost of New Catalyst and Regulations Related to the Disposal of Spent Catalyst; Other Drivers.
6. What are the notable trends driving market growth?
Refineries and Petrochemical Complexes Segment to Dominate the Market.
7. Are there any restraints impacting market growth?
Impact of COVID-19 Pandemic; Other Restraints.
8. Can you provide examples of recent developments in the market?
In July 2021, BASF has expanded its chemical catalyst recycling capacity and capability with the acquisition of Zodiac Enterprises LLC in Caldwell, Texas.
9. What pricing options are available for accessing the report?
Pricing options include single-user, multi-user, and enterprise licenses priced at USD 4750, USD 5250, and USD 8750 respectively.
10. Is the market size provided in terms of value or volume?
The market size is provided in terms of value, measured in billion.
11. Are there any specific market keywords associated with the report?
Yes, the market keyword associated with the report is "Catalyst Regeneration Market," which aids in identifying and referencing the specific market segment covered.
12. How do I determine which pricing option suits my needs best?
The pricing options vary based on user requirements and access needs. Individual users may opt for single-user licenses, while businesses requiring broader access may choose multi-user or enterprise licenses for cost-effective access to the report.
13. Are there any additional resources or data provided in the Catalyst Regeneration Market report?
While the report offers comprehensive insights, it's advisable to review the specific contents or supplementary materials provided to ascertain if additional resources or data are available.
14. How can I stay updated on further developments or reports in the Catalyst Regeneration Market?
To stay informed about further developments, trends, and reports in the Catalyst Regeneration Market, consider subscribing to industry newsletters, following relevant companies and organizations, or regularly checking reputable industry news sources and publications.
Methodology
Step 1 - Identification of Relevant Samples Size from Population Database


Step 2 - Approaches for Defining Global Market Size (Value, Volume* & Price*)

Note*: In applicable scenarios
Step 3 - Data Sources
Primary Research
- Web Analytics
- Survey Reports
- Research Institute
- Latest Research Reports
- Opinion Leaders
Secondary Research
- Annual Reports
- White Paper
- Latest Press Release
- Industry Association
- Paid Database
- Investor Presentations

Step 4 - Data Triangulation
Involves using different sources of information in order to increase the validity of a study
These sources are likely to be stakeholders in a program - participants, other researchers, program staff, other community members, and so on.
Then we put all data in single framework & apply various statistical tools to find out the dynamic on the market.
During the analysis stage, feedback from the stakeholder groups would be compared to determine areas of agreement as well as areas of divergence