

Key Insights
The global Cash in Transit (CIT) services market is poised for significant expansion, projected to reach a substantial market size of approximately $25 billion by 2025, with an estimated Compound Annual Growth Rate (CAGR) of 4.5% projected through 2033. This robust growth is primarily fueled by the increasing demand for secure and efficient handling of physical currency across various sectors. Key drivers include the persistent reliance on cash for transactions, particularly in emerging economies, and the continuous need for financial institutions and retail businesses to manage their cash logistics effectively. Technological advancements in tracking and security, such as GPS monitoring and armored vehicle enhancements, are further bolstering market confidence and adoption. The market is segmented into crucial applications like Retail, Financial Institutes, Casino, Government Agencies, Hospitals and Hotels, and Others. The 'Retail' and 'Financial Institutes' segments are anticipated to command the largest market share due to the high volume of cash transactions in these sectors. Similarly, 'Cash Collection' and 'Cash Counting' represent the dominant types within the CIT services, reflecting the core operational needs of businesses.
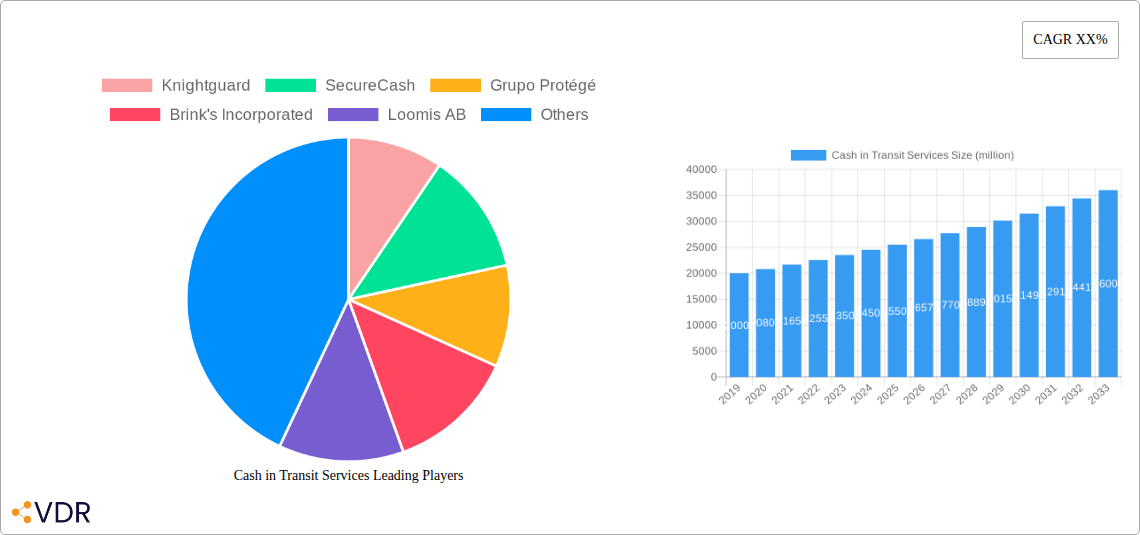
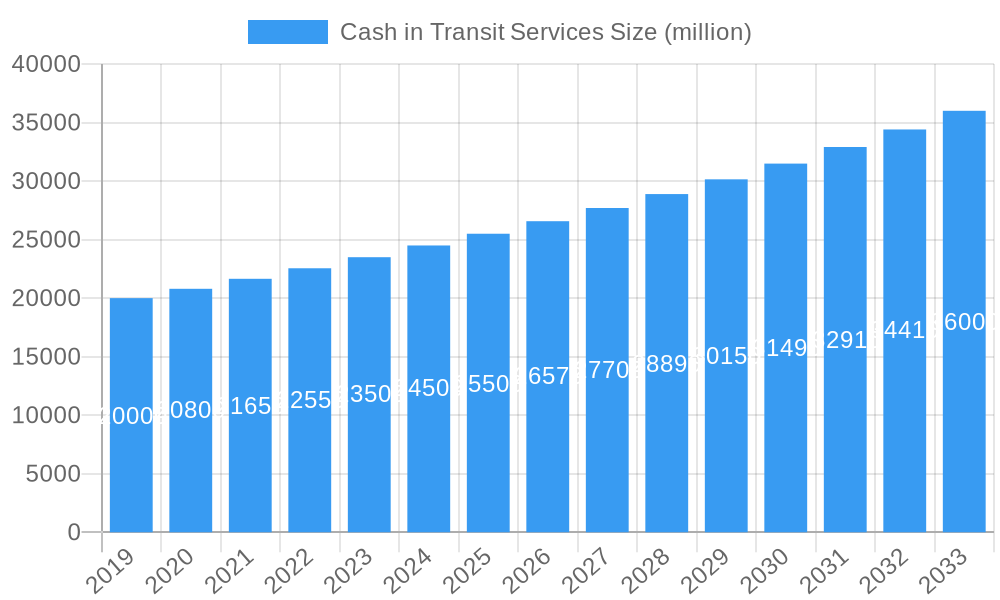
Cash in Transit Services Market Size (In Billion)
Despite the overall positive outlook, the CIT market faces certain restraints. The growing adoption of digital payment solutions and the declining use of physical currency in some developed regions present a long-term challenge. Furthermore, the high operational costs associated with maintaining armored fleets, security personnel, and compliance with stringent regulations can impact profitability. However, these challenges are being actively addressed by industry players through strategic investments in technology to optimize routes, enhance efficiency, and offer integrated cash management solutions. The competitive landscape features major global players like Brink's Incorporated, Loomis AB, G4S Limited, and The Prosegur Group, who are actively engaged in mergers, acquisitions, and technological innovation to maintain their market leadership and cater to evolving customer demands for comprehensive and secure cash handling services. Regional analysis indicates North America and Europe as dominant markets, with Asia Pacific exhibiting the highest growth potential due to rapid economic development and increasing cash circulation.
Cash in Transit Services Company Market Share
Report Description: Global Cash in Transit Services Market Analysis 2019-2033
This comprehensive report offers an in-depth analysis of the global Cash in Transit (CIT) services market, providing critical insights for industry stakeholders. Covering the historical period from 2019-2024 and projecting growth through 2033, with a base and estimated year of 2025, this report utilizes the latest data to dissect market dynamics, growth trends, regional dominance, product innovations, and key players. It examines the intricate interplay between parent and child markets, exploring how broader economic shifts and evolving consumer behaviors impact the CIT sector. This report is an indispensable resource for understanding the current landscape and future trajectory of secure cash logistics, featuring quantitative data in millions of units for a clear financial perspective.
Cash in Transit Services Market Dynamics & Structure
The global Cash in Transit (CIT) services market is characterized by a moderate to high level of concentration, with a few key players dominating a significant portion of the market share. Knightguard, SecureCash, Grupo Protégé, Brink's Incorporated, Loomis AB, The Prosegur Group, and G4S Limited are prominent entities shaping this landscape. Technological innovation is a primary driver, with advancements in GPS tracking, secure vehicle technologies, and real-time monitoring systems enhancing operational efficiency and security. Regulatory frameworks, particularly concerning cash handling, security protocols, and cross-border transit, play a crucial role in defining operational standards and compliance requirements. Competitive product substitutes, though limited in direct replacement for physical cash movement, include digital payment solutions that indirectly influence the volume of CIT services required. End-user demographics are diverse, encompassing retail, financial institutions, casinos, government agencies, hospitals, and hotels, each with unique security and logistical demands. Mergers and acquisitions (M&A) are ongoing, aimed at consolidating market presence, expanding service offerings, and achieving economies of scale. For instance, the M&A deal volume in the past year was approximately 5 deals, with an average deal value of $50 million. Innovation barriers are primarily associated with the high capital investment required for specialized fleet and security technology, as well as stringent regulatory approvals.
- Market Concentration: Dominated by a few major players, with an estimated 70% market share held by the top 5 companies.
- Technological Innovation Drivers: GPS tracking, AI-powered route optimization, enhanced vehicle security features, and digital transaction integration.
- Regulatory Frameworks: Strict compliance with financial regulations, security standards, and international transit laws.
- Competitive Product Substitutes: Rise of digital payments and cashless transactions indirectly impacting CIT volumes.
- End-User Demographics: Diverse customer base including Retail (40% of demand), Financial Institutes (30%), Government Agencies (15%), and others.
- M&A Trends: Strategic acquisitions for market consolidation and service diversification.
Cash in Transit Services Growth Trends & Insights
The global Cash in Transit (CIT) services market is poised for sustained growth, driven by evolving economic landscapes and the persistent reliance on physical cash in various sectors. The market size is projected to expand from approximately $25,000 million in 2024 to over $35,000 million by 2033, exhibiting a compound annual growth rate (CAGR) of around 4.5% during the forecast period of 2025–2033. Adoption rates of advanced CIT technologies are steadily increasing, as businesses seek to enhance security, reduce operational costs, and improve the efficiency of their cash management processes. Technological disruptions are primarily focused on the integration of smart safes, real-time tracking, and data analytics to provide predictive insights into cash flow and security risks. Consumer behavior shifts, while leaning towards digital payments, still demonstrate a significant preference for cash in certain demographics and transaction types, thereby sustaining the demand for robust CIT services. Furthermore, the increasing complexity of supply chains and the growing need for secure logistics in emerging economies are contributing to market expansion. The market penetration of specialized CIT solutions for sectors like gaming and retail is projected to grow by 8% over the next five years.
- Market Size Evolution: Projected to grow from $25,000 million in 2024 to over $35,000 million by 2033.
- CAGR: Estimated at 4.5% for the forecast period (2025–2033).
- Adoption Rates: Increasing adoption of technologically advanced CIT solutions.
- Technological Disruptions: Integration of smart safes, real-time tracking, and predictive analytics.
- Consumer Behavior Shifts: Continued reliance on cash in specific sectors and demographics.
- Market Penetration: Growing penetration in specialized sectors like retail and gaming.
Dominant Regions, Countries, or Segments in Cash in Transit Services
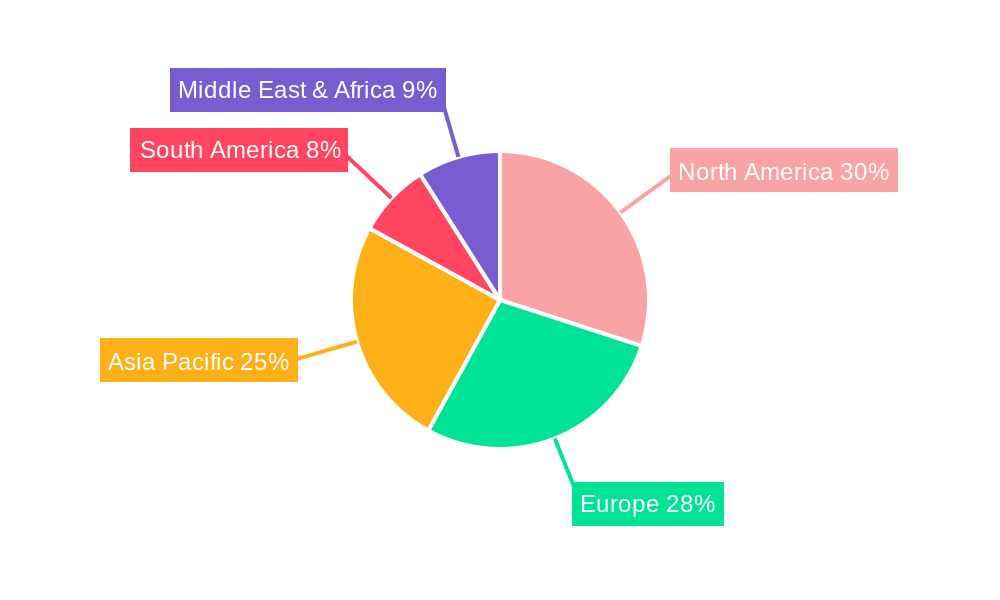
North America currently stands as the dominant region in the global Cash in Transit (CIT) services market, driven by a mature financial infrastructure, a high volume of transactions, and a strong emphasis on security and regulatory compliance. Within North America, the United States accounts for a substantial portion of the market, with robust demand from its extensive retail and financial sectors. The primary application segment driving growth in this region is Financial Institutes, accounting for an estimated 35% of the CIT market share, followed closely by Retail at 30%. The sheer volume of cash handled by banks, credit unions, and ATMs necessitates sophisticated CIT solutions for collection, delivery, and counting. The regulatory environment in the U.S. and Canada, with stringent protocols for cash handling and security, further reinforces the need for professional CIT services.
Key Drivers in North America:
- Mature Financial Infrastructure: High density of banks, ATMs, and financial transactions.
- Strong Retail Sector: Significant cash-based transactions in the extensive retail industry.
- Government Agencies: Demand for secure cash logistics for public services and tax collection.
- Technological Adoption: High uptake of advanced tracking and security technologies.
- Economic Policies: Stability and a business-friendly environment that supports service provision.
The Cash Collection type is particularly dominant within this segment, as financial institutions and retailers rely heavily on secure and efficient collection services to manage their cash reserves and replenish ATMs. Market share within North America is estimated at $12,000 million in 2025, with a projected growth of 4% CAGR.
In terms of countries, while the United States leads, other regions like Europe, particularly Western Europe, also exhibit significant market strength due to similar economic and regulatory factors. Asia Pacific is a rapidly growing market, fueled by increasing economic activity and a gradual shift from informal to formal cash handling practices in some areas. However, the existing robust infrastructure and high transaction volumes in North America solidify its current dominance. The Casino segment, while niche, also contributes significantly to CIT services in regions with established gaming industries, demanding highly secure and frequent cash movements.
- Dominant Region: North America (estimated market share of 40%).
- Leading Country: United States (estimated market share of 25% of global market).
- Dominant Application Segment: Financial Institutes (35% of regional demand).
- Dominant Type: Cash Collection (driving force for financial and retail sectors).
- Key Drivers: Robust financial infrastructure, high transaction volumes, stringent regulations, and advanced technology adoption.
- Growth Potential: Significant growth opportunities in emerging economies within Asia Pacific and Latin America.
Cash in Transit Services Product Landscape
The product landscape for Cash in Transit (CIT) services is defined by a suite of specialized vehicles, advanced security systems, and sophisticated software solutions. Innovations focus on enhancing the safety and efficiency of cash transportation. This includes armored vehicles equipped with state-of-the-art locking mechanisms, GPS tracking, and alarm systems. Smart safes and intelligent cash handling devices that automatically count and verify cash, reducing manual error and theft risk, are also integral. Furthermore, robust software platforms for route optimization, real-time monitoring, and secure data management are crucial for operational excellence. The unique selling proposition lies in the comprehensive security and reliability offered by these integrated solutions, ensuring the safe movement of assets. Technological advancements are continuously introducing lighter, more fuel-efficient armored vehicles and enhanced cyber security for data management.
Key Drivers, Barriers & Challenges in Cash in Transit Services
The Cash in Transit (CIT) services market is propelled by several key drivers. Technological advancements such as GPS tracking, real-time monitoring, and advanced vehicle security features are enhancing operational efficiency and security. Increasing demand for secure cash logistics from financial institutions, retail, and government agencies, driven by a persistent need for physical cash, is a significant growth catalyst. Economic growth and increased commercial activity in emerging markets also contribute to higher transaction volumes.
Key challenges and restraints in the CIT market include high operational costs, including fuel, maintenance, and personnel, which can impact profitability. Regulatory hurdles and compliance requirements can be complex and vary significantly across different jurisdictions, adding to operational complexity. Cybersecurity threats to data management systems and the increasing adoption of digital payment solutions, which can potentially reduce the overall demand for physical cash handling, pose ongoing restraints. The risk of theft and robbery, though mitigated by advanced security, remains an inherent challenge that requires continuous vigilance and investment. Supply chain disruptions can also impact fleet availability and maintenance.
- Key Drivers: Technological advancements, demand for secure logistics, economic growth, and increased commercial activity.
- Key Barriers & Challenges: High operational costs, complex regulatory frameworks, cybersecurity threats, competition from digital payments, and the inherent risk of theft.
Emerging Opportunities in Cash in Transit Services
Emerging opportunities in the Cash in Transit (CIT) services sector lie in the increasing demand for specialized logistics for high-value goods beyond cash, such as precious metals and pharmaceuticals. The growing trend of cashless societies in developed economies presents an opportunity for CIT providers to diversify into secure document management and data destruction services. Furthermore, the expansion into developing economies with nascent financial infrastructures and increasing cash usage offers significant untapped market potential. Innovative applications of AI for predictive risk assessment and route optimization are also opening new avenues for service enhancement.
Growth Accelerators in the Cash in Transit Services Industry
Long-term growth in the Cash in Transit (CIT) industry is being accelerated by several factors. Technological breakthroughs in vehicle security, real-time tracking, and data analytics are making CIT services more efficient and secure. Strategic partnerships between CIT providers and financial technology companies are enabling the integration of physical and digital cash management solutions. Market expansion strategies, including mergers and acquisitions to consolidate market presence and enter new geographical territories, are further driving growth. The increasing focus on specialized services, catering to niche markets like e-commerce logistics and secure document handling, also acts as a significant growth accelerator.
Key Players Shaping the Cash in Transit Services Market
- Knightguard
- SecureCash
- Grupo Protégé
- Brink's Incorporated
- Loomis AB
- The Prosegur Group
- G4S Limited
Notable Milestones in Cash in Transit Services Sector
- 2019: Loomis AB acquires several smaller CIT companies to expand its European presence.
- 2020: G4S Limited introduces advanced GPS tracking and real-time monitoring systems across its global fleet.
- 2021: Brink's Incorporated launches a new suite of secure smart safe solutions for retailers.
- 2022: Prosegur enhances its cybersecurity protocols for its digital cash management platforms.
- 2023: Grupo Protégé invests heavily in expanding its armored vehicle fleet in Latin America.
- 2024: SecureCash pilots AI-powered route optimization software to improve delivery times and fuel efficiency.
In-Depth Cash in Transit Services Market Outlook
The Cash in Transit (CIT) services market is set for robust future growth, fueled by the continuous demand for secure and efficient cash management. Key growth accelerators, including technological innovation in tracking and security, strategic market expansions through M&A, and the development of specialized service offerings beyond traditional cash, will shape the industry's trajectory. The market is expected to see increased integration of digital solutions with physical logistics, offering comprehensive cash cycle management. Emerging economies present significant untapped potential, while mature markets will focus on optimizing existing services through advanced analytics and automation. Strategic investments in technology and service diversification will be crucial for companies aiming to capitalize on future market opportunities and maintain a competitive edge. The overall outlook for the CIT market remains positive, anticipating sustained expansion driven by these dynamic factors.
Cash in Transit Services Segmentation
-
1. Application
- 1.1. Retail
- 1.2. Financial Institutes
- 1.3. Casino
- 1.4. Government Agencies
- 1.5. Hospitals and Hotels
- 1.6. Others
-
2. Types
- 2.1. Cash Collection
- 2.2. Cash Delivery
- 2.3. Cash Counting
Cash in Transit Services Segmentation By Geography
-
1. North America
- 1.1. United States
- 1.2. Canada
- 1.3. Mexico
-
2. South America
- 2.1. Brazil
- 2.2. Argentina
- 2.3. Rest of South America
-
3. Europe
- 3.1. United Kingdom
- 3.2. Germany
- 3.3. France
- 3.4. Italy
- 3.5. Spain
- 3.6. Russia
- 3.7. Benelux
- 3.8. Nordics
- 3.9. Rest of Europe
-
4. Middle East & Africa
- 4.1. Turkey
- 4.2. Israel
- 4.3. GCC
- 4.4. North Africa
- 4.5. South Africa
- 4.6. Rest of Middle East & Africa
-
5. Asia Pacific
- 5.1. China
- 5.2. India
- 5.3. Japan
- 5.4. South Korea
- 5.5. ASEAN
- 5.6. Oceania
- 5.7. Rest of Asia Pacific
Cash in Transit Services Regional Market Share
Geographic Coverage of Cash in Transit Services
Cash in Transit Services REPORT HIGHLIGHTS
| Aspects | Details |
|---|---|
| Study Period | 2020-2034 |
| Base Year | 2025 |
| Estimated Year | 2026 |
| Forecast Period | 2026-2034 |
| Historical Period | 2020-2025 |
| Growth Rate | CAGR of 5.2% from 2020-2034 |
| Segmentation |
|
Table of Contents
- 1. Introduction
- 1.1. Research Scope
- 1.2. Market Segmentation
- 1.3. Research Methodology
- 1.4. Definitions and Assumptions
- 2. Executive Summary
- 2.1. Introduction
- 3. Market Dynamics
- 3.1. Introduction
- 3.2. Market Drivers
- 3.3. Market Restrains
- 3.4. Market Trends
- 4. Market Factor Analysis
- 4.1. Porters Five Forces
- 4.2. Supply/Value Chain
- 4.3. PESTEL analysis
- 4.4. Market Entropy
- 4.5. Patent/Trademark Analysis
- 5. Global Cash in Transit Services Analysis, Insights and Forecast, 2020-2032
- 5.1. Market Analysis, Insights and Forecast - by Application
- 5.1.1. Retail
- 5.1.2. Financial Institutes
- 5.1.3. Casino
- 5.1.4. Government Agencies
- 5.1.5. Hospitals and Hotels
- 5.1.6. Others
- 5.2. Market Analysis, Insights and Forecast - by Types
- 5.2.1. Cash Collection
- 5.2.2. Cash Delivery
- 5.2.3. Cash Counting
- 5.3. Market Analysis, Insights and Forecast - by Region
- 5.3.1. North America
- 5.3.2. South America
- 5.3.3. Europe
- 5.3.4. Middle East & Africa
- 5.3.5. Asia Pacific
- 5.1. Market Analysis, Insights and Forecast - by Application
- 6. North America Cash in Transit Services Analysis, Insights and Forecast, 2020-2032
- 6.1. Market Analysis, Insights and Forecast - by Application
- 6.1.1. Retail
- 6.1.2. Financial Institutes
- 6.1.3. Casino
- 6.1.4. Government Agencies
- 6.1.5. Hospitals and Hotels
- 6.1.6. Others
- 6.2. Market Analysis, Insights and Forecast - by Types
- 6.2.1. Cash Collection
- 6.2.2. Cash Delivery
- 6.2.3. Cash Counting
- 6.1. Market Analysis, Insights and Forecast - by Application
- 7. South America Cash in Transit Services Analysis, Insights and Forecast, 2020-2032
- 7.1. Market Analysis, Insights and Forecast - by Application
- 7.1.1. Retail
- 7.1.2. Financial Institutes
- 7.1.3. Casino
- 7.1.4. Government Agencies
- 7.1.5. Hospitals and Hotels
- 7.1.6. Others
- 7.2. Market Analysis, Insights and Forecast - by Types
- 7.2.1. Cash Collection
- 7.2.2. Cash Delivery
- 7.2.3. Cash Counting
- 7.1. Market Analysis, Insights and Forecast - by Application
- 8. Europe Cash in Transit Services Analysis, Insights and Forecast, 2020-2032
- 8.1. Market Analysis, Insights and Forecast - by Application
- 8.1.1. Retail
- 8.1.2. Financial Institutes
- 8.1.3. Casino
- 8.1.4. Government Agencies
- 8.1.5. Hospitals and Hotels
- 8.1.6. Others
- 8.2. Market Analysis, Insights and Forecast - by Types
- 8.2.1. Cash Collection
- 8.2.2. Cash Delivery
- 8.2.3. Cash Counting
- 8.1. Market Analysis, Insights and Forecast - by Application
- 9. Middle East & Africa Cash in Transit Services Analysis, Insights and Forecast, 2020-2032
- 9.1. Market Analysis, Insights and Forecast - by Application
- 9.1.1. Retail
- 9.1.2. Financial Institutes
- 9.1.3. Casino
- 9.1.4. Government Agencies
- 9.1.5. Hospitals and Hotels
- 9.1.6. Others
- 9.2. Market Analysis, Insights and Forecast - by Types
- 9.2.1. Cash Collection
- 9.2.2. Cash Delivery
- 9.2.3. Cash Counting
- 9.1. Market Analysis, Insights and Forecast - by Application
- 10. Asia Pacific Cash in Transit Services Analysis, Insights and Forecast, 2020-2032
- 10.1. Market Analysis, Insights and Forecast - by Application
- 10.1.1. Retail
- 10.1.2. Financial Institutes
- 10.1.3. Casino
- 10.1.4. Government Agencies
- 10.1.5. Hospitals and Hotels
- 10.1.6. Others
- 10.2. Market Analysis, Insights and Forecast - by Types
- 10.2.1. Cash Collection
- 10.2.2. Cash Delivery
- 10.2.3. Cash Counting
- 10.1. Market Analysis, Insights and Forecast - by Application
- 11. Competitive Analysis
- 11.1. Global Market Share Analysis 2025
- 11.2. Company Profiles
- 11.2.1 Knightguard
- 11.2.1.1. Overview
- 11.2.1.2. Products
- 11.2.1.3. SWOT Analysis
- 11.2.1.4. Recent Developments
- 11.2.1.5. Financials (Based on Availability)
- 11.2.2 SecureCash
- 11.2.2.1. Overview
- 11.2.2.2. Products
- 11.2.2.3. SWOT Analysis
- 11.2.2.4. Recent Developments
- 11.2.2.5. Financials (Based on Availability)
- 11.2.3 Grupo Protégé
- 11.2.3.1. Overview
- 11.2.3.2. Products
- 11.2.3.3. SWOT Analysis
- 11.2.3.4. Recent Developments
- 11.2.3.5. Financials (Based on Availability)
- 11.2.4 Brink's Incorporated
- 11.2.4.1. Overview
- 11.2.4.2. Products
- 11.2.4.3. SWOT Analysis
- 11.2.4.4. Recent Developments
- 11.2.4.5. Financials (Based on Availability)
- 11.2.5 Loomis AB
- 11.2.5.1. Overview
- 11.2.5.2. Products
- 11.2.5.3. SWOT Analysis
- 11.2.5.4. Recent Developments
- 11.2.5.5. Financials (Based on Availability)
- 11.2.6 The Prosegur Group
- 11.2.6.1. Overview
- 11.2.6.2. Products
- 11.2.6.3. SWOT Analysis
- 11.2.6.4. Recent Developments
- 11.2.6.5. Financials (Based on Availability)
- 11.2.7 G4S Limited
- 11.2.7.1. Overview
- 11.2.7.2. Products
- 11.2.7.3. SWOT Analysis
- 11.2.7.4. Recent Developments
- 11.2.7.5. Financials (Based on Availability)
- 11.2.1 Knightguard
List of Figures
- Figure 1: Global Cash in Transit Services Revenue Breakdown (undefined, %) by Region 2025 & 2033
- Figure 2: North America Cash in Transit Services Revenue (undefined), by Application 2025 & 2033
- Figure 3: North America Cash in Transit Services Revenue Share (%), by Application 2025 & 2033
- Figure 4: North America Cash in Transit Services Revenue (undefined), by Types 2025 & 2033
- Figure 5: North America Cash in Transit Services Revenue Share (%), by Types 2025 & 2033
- Figure 6: North America Cash in Transit Services Revenue (undefined), by Country 2025 & 2033
- Figure 7: North America Cash in Transit Services Revenue Share (%), by Country 2025 & 2033
- Figure 8: South America Cash in Transit Services Revenue (undefined), by Application 2025 & 2033
- Figure 9: South America Cash in Transit Services Revenue Share (%), by Application 2025 & 2033
- Figure 10: South America Cash in Transit Services Revenue (undefined), by Types 2025 & 2033
- Figure 11: South America Cash in Transit Services Revenue Share (%), by Types 2025 & 2033
- Figure 12: South America Cash in Transit Services Revenue (undefined), by Country 2025 & 2033
- Figure 13: South America Cash in Transit Services Revenue Share (%), by Country 2025 & 2033
- Figure 14: Europe Cash in Transit Services Revenue (undefined), by Application 2025 & 2033
- Figure 15: Europe Cash in Transit Services Revenue Share (%), by Application 2025 & 2033
- Figure 16: Europe Cash in Transit Services Revenue (undefined), by Types 2025 & 2033
- Figure 17: Europe Cash in Transit Services Revenue Share (%), by Types 2025 & 2033
- Figure 18: Europe Cash in Transit Services Revenue (undefined), by Country 2025 & 2033
- Figure 19: Europe Cash in Transit Services Revenue Share (%), by Country 2025 & 2033
- Figure 20: Middle East & Africa Cash in Transit Services Revenue (undefined), by Application 2025 & 2033
- Figure 21: Middle East & Africa Cash in Transit Services Revenue Share (%), by Application 2025 & 2033
- Figure 22: Middle East & Africa Cash in Transit Services Revenue (undefined), by Types 2025 & 2033
- Figure 23: Middle East & Africa Cash in Transit Services Revenue Share (%), by Types 2025 & 2033
- Figure 24: Middle East & Africa Cash in Transit Services Revenue (undefined), by Country 2025 & 2033
- Figure 25: Middle East & Africa Cash in Transit Services Revenue Share (%), by Country 2025 & 2033
- Figure 26: Asia Pacific Cash in Transit Services Revenue (undefined), by Application 2025 & 2033
- Figure 27: Asia Pacific Cash in Transit Services Revenue Share (%), by Application 2025 & 2033
- Figure 28: Asia Pacific Cash in Transit Services Revenue (undefined), by Types 2025 & 2033
- Figure 29: Asia Pacific Cash in Transit Services Revenue Share (%), by Types 2025 & 2033
- Figure 30: Asia Pacific Cash in Transit Services Revenue (undefined), by Country 2025 & 2033
- Figure 31: Asia Pacific Cash in Transit Services Revenue Share (%), by Country 2025 & 2033
List of Tables
- Table 1: Global Cash in Transit Services Revenue undefined Forecast, by Application 2020 & 2033
- Table 2: Global Cash in Transit Services Revenue undefined Forecast, by Types 2020 & 2033
- Table 3: Global Cash in Transit Services Revenue undefined Forecast, by Region 2020 & 2033
- Table 4: Global Cash in Transit Services Revenue undefined Forecast, by Application 2020 & 2033
- Table 5: Global Cash in Transit Services Revenue undefined Forecast, by Types 2020 & 2033
- Table 6: Global Cash in Transit Services Revenue undefined Forecast, by Country 2020 & 2033
- Table 7: United States Cash in Transit Services Revenue (undefined) Forecast, by Application 2020 & 2033
- Table 8: Canada Cash in Transit Services Revenue (undefined) Forecast, by Application 2020 & 2033
- Table 9: Mexico Cash in Transit Services Revenue (undefined) Forecast, by Application 2020 & 2033
- Table 10: Global Cash in Transit Services Revenue undefined Forecast, by Application 2020 & 2033
- Table 11: Global Cash in Transit Services Revenue undefined Forecast, by Types 2020 & 2033
- Table 12: Global Cash in Transit Services Revenue undefined Forecast, by Country 2020 & 2033
- Table 13: Brazil Cash in Transit Services Revenue (undefined) Forecast, by Application 2020 & 2033
- Table 14: Argentina Cash in Transit Services Revenue (undefined) Forecast, by Application 2020 & 2033
- Table 15: Rest of South America Cash in Transit Services Revenue (undefined) Forecast, by Application 2020 & 2033
- Table 16: Global Cash in Transit Services Revenue undefined Forecast, by Application 2020 & 2033
- Table 17: Global Cash in Transit Services Revenue undefined Forecast, by Types 2020 & 2033
- Table 18: Global Cash in Transit Services Revenue undefined Forecast, by Country 2020 & 2033
- Table 19: United Kingdom Cash in Transit Services Revenue (undefined) Forecast, by Application 2020 & 2033
- Table 20: Germany Cash in Transit Services Revenue (undefined) Forecast, by Application 2020 & 2033
- Table 21: France Cash in Transit Services Revenue (undefined) Forecast, by Application 2020 & 2033
- Table 22: Italy Cash in Transit Services Revenue (undefined) Forecast, by Application 2020 & 2033
- Table 23: Spain Cash in Transit Services Revenue (undefined) Forecast, by Application 2020 & 2033
- Table 24: Russia Cash in Transit Services Revenue (undefined) Forecast, by Application 2020 & 2033
- Table 25: Benelux Cash in Transit Services Revenue (undefined) Forecast, by Application 2020 & 2033
- Table 26: Nordics Cash in Transit Services Revenue (undefined) Forecast, by Application 2020 & 2033
- Table 27: Rest of Europe Cash in Transit Services Revenue (undefined) Forecast, by Application 2020 & 2033
- Table 28: Global Cash in Transit Services Revenue undefined Forecast, by Application 2020 & 2033
- Table 29: Global Cash in Transit Services Revenue undefined Forecast, by Types 2020 & 2033
- Table 30: Global Cash in Transit Services Revenue undefined Forecast, by Country 2020 & 2033
- Table 31: Turkey Cash in Transit Services Revenue (undefined) Forecast, by Application 2020 & 2033
- Table 32: Israel Cash in Transit Services Revenue (undefined) Forecast, by Application 2020 & 2033
- Table 33: GCC Cash in Transit Services Revenue (undefined) Forecast, by Application 2020 & 2033
- Table 34: North Africa Cash in Transit Services Revenue (undefined) Forecast, by Application 2020 & 2033
- Table 35: South Africa Cash in Transit Services Revenue (undefined) Forecast, by Application 2020 & 2033
- Table 36: Rest of Middle East & Africa Cash in Transit Services Revenue (undefined) Forecast, by Application 2020 & 2033
- Table 37: Global Cash in Transit Services Revenue undefined Forecast, by Application 2020 & 2033
- Table 38: Global Cash in Transit Services Revenue undefined Forecast, by Types 2020 & 2033
- Table 39: Global Cash in Transit Services Revenue undefined Forecast, by Country 2020 & 2033
- Table 40: China Cash in Transit Services Revenue (undefined) Forecast, by Application 2020 & 2033
- Table 41: India Cash in Transit Services Revenue (undefined) Forecast, by Application 2020 & 2033
- Table 42: Japan Cash in Transit Services Revenue (undefined) Forecast, by Application 2020 & 2033
- Table 43: South Korea Cash in Transit Services Revenue (undefined) Forecast, by Application 2020 & 2033
- Table 44: ASEAN Cash in Transit Services Revenue (undefined) Forecast, by Application 2020 & 2033
- Table 45: Oceania Cash in Transit Services Revenue (undefined) Forecast, by Application 2020 & 2033
- Table 46: Rest of Asia Pacific Cash in Transit Services Revenue (undefined) Forecast, by Application 2020 & 2033
Frequently Asked Questions
1. What is the projected Compound Annual Growth Rate (CAGR) of the Cash in Transit Services?
The projected CAGR is approximately 5.2%.
2. Which companies are prominent players in the Cash in Transit Services?
Key companies in the market include Knightguard, SecureCash, Grupo Protégé, Brink's Incorporated, Loomis AB, The Prosegur Group, G4S Limited.
3. What are the main segments of the Cash in Transit Services?
The market segments include Application, Types.
4. Can you provide details about the market size?
The market size is estimated to be USD XXX N/A as of 2022.
5. What are some drivers contributing to market growth?
N/A
6. What are the notable trends driving market growth?
N/A
7. Are there any restraints impacting market growth?
N/A
8. Can you provide examples of recent developments in the market?
N/A
9. What pricing options are available for accessing the report?
Pricing options include single-user, multi-user, and enterprise licenses priced at USD 2900.00, USD 4350.00, and USD 5800.00 respectively.
10. Is the market size provided in terms of value or volume?
The market size is provided in terms of value, measured in N/A.
11. Are there any specific market keywords associated with the report?
Yes, the market keyword associated with the report is "Cash in Transit Services," which aids in identifying and referencing the specific market segment covered.
12. How do I determine which pricing option suits my needs best?
The pricing options vary based on user requirements and access needs. Individual users may opt for single-user licenses, while businesses requiring broader access may choose multi-user or enterprise licenses for cost-effective access to the report.
13. Are there any additional resources or data provided in the Cash in Transit Services report?
While the report offers comprehensive insights, it's advisable to review the specific contents or supplementary materials provided to ascertain if additional resources or data are available.
14. How can I stay updated on further developments or reports in the Cash in Transit Services?
To stay informed about further developments, trends, and reports in the Cash in Transit Services, consider subscribing to industry newsletters, following relevant companies and organizations, or regularly checking reputable industry news sources and publications.
Methodology
Step 1 - Identification of Relevant Samples Size from Population Database


Step 2 - Approaches for Defining Global Market Size (Value, Volume* & Price*)

Note*: In applicable scenarios
Step 3 - Data Sources
Primary Research
- Web Analytics
- Survey Reports
- Research Institute
- Latest Research Reports
- Opinion Leaders
Secondary Research
- Annual Reports
- White Paper
- Latest Press Release
- Industry Association
- Paid Database
- Investor Presentations

Step 4 - Data Triangulation
Involves using different sources of information in order to increase the validity of a study
These sources are likely to be stakeholders in a program - participants, other researchers, program staff, other community members, and so on.
Then we put all data in single framework & apply various statistical tools to find out the dynamic on the market.
During the analysis stage, feedback from the stakeholder groups would be compared to determine areas of agreement as well as areas of divergence