

Key Insights
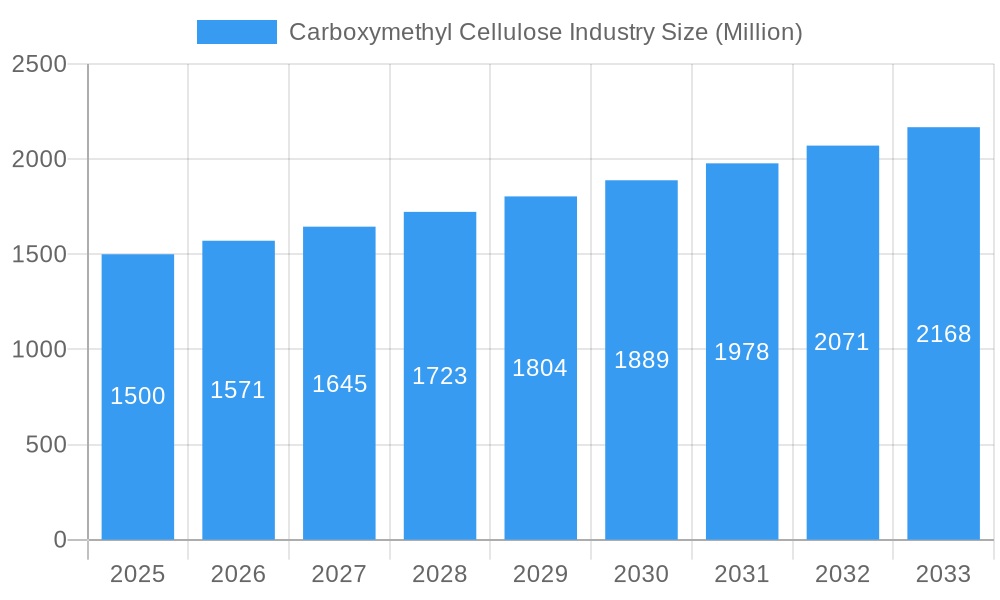
The global carboxymethyl cellulose (CMC) market, valued at $1.5 billion in 2025, is projected to experience steady growth, driven by its diverse applications across various industries. A compound annual growth rate (CAGR) of 4.64% from 2025 to 2033 indicates a substantial market expansion. The high-purity grade segment dominates, fueled by increasing demand from the food and beverage, pharmaceutical, and cosmetic sectors, where purity and functionality are paramount. The technical and industrial grades also hold significant market share, primarily serving applications in the oil and gas, detergents, and paper processing industries. Growth is further propelled by the rising demand for environmentally friendly alternatives in various manufacturing processes, with CMC’s biodegradability and versatility proving advantageous. Regional growth is expected to be driven by expanding industrialization and increasing consumption in developing economies of Asia-Pacific, particularly China and India, which offer significant growth opportunities for CMC manufacturers. However, price fluctuations in raw materials and potential regulatory changes related to food additives could pose challenges to market expansion. Competition among established players and emerging regional manufacturers will intensify, necessitating continuous innovation and efficient production strategies to maintain market share and profitability.
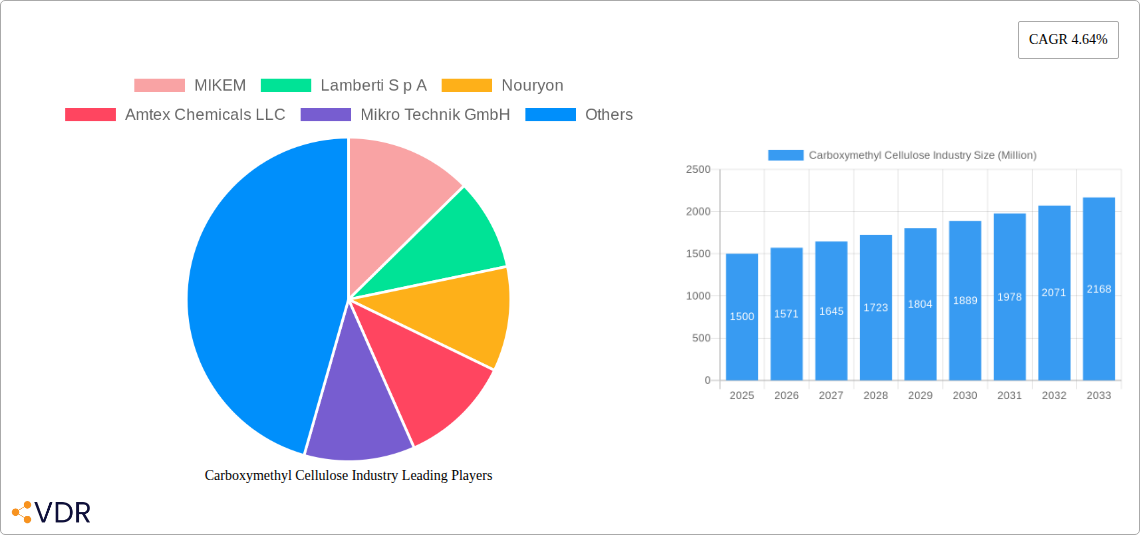
Carboxymethyl Cellulose Industry Market Size (In Billion)
The forecast period from 2025-2033 showcases a promising outlook for the CMC market. The consistent CAGR reflects a stable and expanding market fueled by increasing product demand across various industries. While North America and Europe currently hold a larger market share due to established industries and higher per-capita consumption, the Asia-Pacific region is poised for the most significant growth due to rapid economic expansion and increasing industrialization. Strategic partnerships, mergers and acquisitions, and expansion into new applications and geographical markets are anticipated to shape the competitive landscape. Companies need to focus on developing sustainable CMC production methods and catering to the growing demand for specialized grades, such as those with enhanced rheological properties or specific functionalities, to secure a competitive edge in the global market.
Carboxymethyl Cellulose Industry Company Market Share
Carboxymethyl Cellulose (CMC) Industry Market Report: 2019-2033
This comprehensive report provides an in-depth analysis of the global Carboxymethyl Cellulose (CMC) industry, encompassing market dynamics, growth trends, regional dominance, product landscape, key players, and future outlook. The study period covers 2019-2033, with 2025 as the base year and forecast period extending to 2033. The report segments the market by grade (High Purity Grade (99.5%+), Technical Grade (90 to 99.5%), Industrial Grade (50 to 90%)) and application (Food and Beverages, Oil and Gas, Cosmetics and Pharmaceuticals, Detergents, Paper Processing, Other Applications (Mining, Paints and Coatings, Construction, Textile Processing, Adhesives, Ceramics)), offering granular insights for informed decision-making.
Carboxymethyl Cellulose Industry Market Dynamics & Structure
The global Carboxymethyl Cellulose (CMC) market is characterized by a moderately concentrated landscape with a few major players holding significant market share. Technological innovation, driven by the demand for high-purity CMC and specialized applications, is a key driver. Stringent regulatory frameworks regarding food safety, pharmaceutical standards, and environmental impact significantly influence manufacturing practices and product development. Competition from alternative thickening and stabilizing agents exists, but CMC's inherent versatility, cost-effectiveness, and broad range of functionalities continue to solidify its strong market position across diverse industries. End-user demographics vary significantly across applications; for example, the food and beverage industry demands exceptionally high-purity grades adhering to strict food-grade certifications, while industrial applications often utilize lower grades optimized for performance in areas like construction, textiles, and detergents. Mergers and acquisitions (M&A) activity within the CMC industry has been moderate in recent years, with a strategic focus on expanding geographic reach, enhancing technological capabilities, and diversifying product portfolios to cater to evolving market needs. The overall market size in 2024 was estimated at [Insert 2024 Market Size Here] Million, and is projected to reach [Insert 2033 Market Size Here] Million by 2033, demonstrating a steady upward trajectory.
- Market Concentration: Moderately concentrated, with top 5 players holding approximately [Insert Top 5 Player Share Here]% market share in 2024, indicating a competitive yet consolidated environment.
- Technological Innovation: The industry is actively focusing on developing ultra-high-purity grades for pharmaceutical applications, advanced biodegradable options to meet sustainability goals, and highly customized CMC solutions tailored for specific functionalities in niche sectors.
- Regulatory Frameworks: Strict adherence to evolving food safety standards (e.g., FDA, EFSA regulations), pharmaceutical guidelines (e.g., USP, EP), and environmental regulations (e.g., REACH) is paramount, influencing manufacturing processes, quality control, and product distribution.
- Competitive Substitutes: While alternative thickening and stabilizing agents like xanthan gum, guar gum, and alginates pose competition, CMC's superior performance in specific applications, its broad pH stability, and cost-effectiveness ensure its continued relevance.
- M&A Trends: Moderate M&A activity has been observed over the past five years, primarily driven by strategic objectives of geographical expansion, product portfolio diversification, and the acquisition of advanced manufacturing technologies. Approximately [Insert Number of M&A Deals Here] M&A deals occurred between 2019 and 2024.
- Innovation Barriers: Significant barriers to innovation include high research and development (R&D) costs associated with developing novel CMC derivatives, the complex chemical processes required to achieve specific molecular weights and degrees of substitution, and the stringent validation processes for new applications, particularly in regulated industries.
Carboxymethyl Cellulose Industry Growth Trends & Insights
The global Carboxymethyl Cellulose (CMC) market exhibited consistent and robust growth throughout the historical period (2019-2024), primarily propelled by escalating demand from the food and beverage, oil and gas, pharmaceutical, and personal care industries. The market size expanded from [Insert 2019 Market Size Here] Million in 2019 to [Insert 2024 Market Size Here] Million in 2024, registering a Compound Annual Growth Rate (CAGR) of [Insert Historical CAGR Here]%. Technological advancements in CMC production, including the implementation of more efficient synthesis methods, enhanced purification techniques, and a pronounced focus on reducing the environmental footprint of manufacturing processes, have further accelerated this growth. A significant trend is the increasing consumer preference for natural, sustainable, and functional ingredients, which is directly driving the demand for higher-purity, food-grade, and biodegradable CMC variants. Adoption rates of CMC in emerging and high-value applications, such as controlled-release drug delivery systems in pharmaceuticals and rheology modifiers in advanced construction materials, are also on a notable rise. While no radical technological disruptions are anticipated in the immediate future, continuous incremental improvements in production processes, product consistency, and the development of specialized CMC grades with tailored properties are expected to sustain market momentum. The growing consumer awareness and demand for healthier, more natural food products are significantly boosting the demand for high-purity CMC in a wide array of food and beverage applications, from dairy products and baked goods to sauces and beverages. Market penetration across various sectors remains uneven, presenting considerable growth potential, particularly in emerging economies undergoing rapid industrialization and economic development.
The forecasted CAGR for the period 2025-2033 is projected to be [Insert Forecasted CAGR Here]%, driven by sustained demand from developing economies, an expanding array of applications across diverse industrial and consumer sectors, and ongoing innovation in product development. The market size is anticipated to reach [Insert Forecasted Market Size Here] Million by 2033, underscoring its continued importance and growth trajectory.
Dominant Regions, Countries, or Segments in Carboxymethyl Cellulose Industry
The Asia-Pacific region stands as the dominant force in the global Carboxymethyl Cellulose (CMC) market, primarily attributed to the substantial and continuously growing consumption across its extensive food processing, paper manufacturing, detergent, textile, and other diverse industrial applications. China and India are particularly significant contributors to this regional dominance, fueled by their robust economic growth, rapidly expanding industrial sectors, and large domestic consumer bases. Within the grade segments, the demand for Technical Grade (typically ranging from 90% to 99.5% purity) CMC is currently the highest, catering to a broad spectrum of industrial applications where cost-effectiveness and performance are key. However, there is a significant and growing demand for Food Grade and Pharmaceutical Grade CMC, driven by stricter quality requirements and increasing consumer focus on health and safety. In terms of application segments, the food and beverage sector consistently constitutes the largest and most dynamic segment, driven by CMC's indispensable role as a highly effective thickening, stabilizing, and emulsifying agent that enhances texture, mouthfeel, and shelf-life of numerous products.
- Key Drivers (Asia-Pacific): The region's dominance is underpinned by rapid economic expansion, extensive industrialization across multiple sectors, rising disposable incomes leading to increased consumer spending, and a burgeoning food and beverage industry with a strong demand for functional ingredients.
- Dominance Factors: Significant contributing factors to Asia-Pacific's dominance include large-scale and cost-effective manufacturing capacities, ready availability of essential raw materials like cellulose, and strong government support for industrial development.
- Growth Potential: Untapped and considerable growth potential exists in emerging markets across Africa and Latin America, where industrial development is accelerating, and demand for CMC in various applications is expected to rise significantly.
- Europe: Europe maintains a strong market presence with a focus on high-purity CMC for specialized, value-added applications, particularly in the pharmaceutical, cosmetic, and premium food sectors, supported by stringent quality standards and a strong research and development ecosystem.
- North America: North America demonstrates stable market growth, driven by well-established industrial sectors, increasing demand for sustainable ingredients, and a growing application base in personal care and pharmaceuticals, with a notable trend towards bio-based and eco-friendly CMC variants.
Carboxymethyl Cellulose Industry Product Landscape
The Carboxymethyl Cellulose (CMC) market offers a diverse range of products tailored to various applications. These products differ mainly in terms of purity, viscosity, and degree of substitution (DS). High-purity grades cater to the food and pharmaceutical sectors, emphasizing purity and safety standards. Technical and industrial grades find extensive use in various industrial applications where high purity is less critical. Technological advancements are focused on enhancing the performance characteristics of CMC, including improving its solubility, stability, and biodegradability. Unique selling propositions often revolve around specialized formulations catering to specific industry requirements, ensuring optimal performance in diverse applications.
Key Drivers, Barriers & Challenges in Carboxymethyl Cellulose Industry
Key Drivers: The primary drivers propelling the Carboxymethyl Cellulose (CMC) market include the escalating demand from pivotal sectors such as food and beverage, oil and gas (for drilling fluids), and personal care (for viscosity modification). The intensifying global preference for natural, sustainable, and functional ingredients is a significant catalyst, boosting the demand for high-purity, food-grade, and increasingly, biodegradable CMC variants. Furthermore, continuous technological advancements in CMC production processes, leading to improved manufacturing efficiencies, reduced production costs, enhanced product characteristics (like controlled viscosity and solubility), and minimized environmental impact, are substantial contributors to market expansion.
Key Barriers and Challenges: Significant challenges faced by the CMC industry include the inherent volatility in raw material prices, particularly for cellulose pulp, which can directly impact manufacturing costs and profitability. Stringent and evolving regulatory compliance requirements across different regions and applications, coupled with increasing environmental concerns regarding the production processes and end-of-life disposal of CMC, pose considerable hurdles. Robust competition from alternative thickening and stabilizing agents, such as xanthan gum, guar gum, and hydrocolloids derived from seaweed, can affect market share and pricing power in specific applications. Supply chain disruptions, exacerbated by geopolitical factors and global logistics complexities, and the inherent dependence on cellulose as a primary raw material, present considerable operational and supply risks. A quantifiable impact of raw material price volatility was observed, with an estimated [Insert Percentage Impact Here]% reduction in profit margins in 2024 due to fluctuating cellulose costs.
Emerging Opportunities in Carboxymethyl Cellulose Industry
Emerging opportunities exist in untapped markets, particularly in developing economies with expanding industrial sectors. Innovative applications of CMC in specialized areas, such as pharmaceuticals, biomedicine, and advanced materials, offer significant growth potential. The rising consumer preference for natural and sustainable products drives demand for eco-friendly CMC formulations, creating opportunities for producers focused on sustainable production methods. Development of customized CMC solutions tailored to specific industry needs offers further growth potential.
Growth Accelerators in the Carboxymethyl Cellulose Industry
Technological advancements in CMC production, such as the development of more efficient and environmentally friendly synthesis routes, improved purification techniques to achieve higher purity levels, and innovative methods for controlling molecular weight and degree of substitution, are key growth catalysts. Strategic collaborations and partnerships between CMC producers and downstream industry players (e.g., food manufacturers, pharmaceutical companies, construction material suppliers) are crucial for facilitating market penetration, co-developing innovative applications, and expanding the overall application scope of CMC. Market expansion into developing economies, particularly in rapidly industrializing regions of Asia and Africa, offers substantial untapped growth potential driven by increasing industrial output and rising consumer demand. The development and commercialization of biodegradable and sustainable CMC variants, aligned with the global imperative for environmental sustainability and circular economy principles, are creating attractive new market opportunities and meeting the evolving preferences of environmentally conscious consumers and industries.
Key Players Shaping the Carboxymethyl Cellulose Industry Market
- MIKEM
- Lamberti S.p.A
- Nouryon
- Amtex Chemicals LLC
- Mikro Technik GmbH
- Jining Fortune Biotech Co Ltd
- Chongqing Lihong Fine Chemicals Co Ltd
- USK Rheology Solutions
- Ashland
- DKS Co Ltd
- DuPont
- Daicel Corporation
- Foodchem International Corporation
- Zibo Hailan Chemical Co Ltd
- NIPPON PAPER INDUSTRIES CO LTD
Notable Milestones in Carboxymethyl Cellulose Industry Sector
- February 2023: Nippon Paper Industries Co., Ltd. established SUNROSE MAC, a manufacturing and sales subsidiary for carboxymethyl cellulose in Hungary, expanding its European supply chain.
In-Depth Carboxymethyl Cellulose Industry Market Outlook
The future of the Carboxymethyl Cellulose (CMC) market looks promising, driven by sustained demand from established sectors and emerging applications. Technological breakthroughs, including the development of high-performance, sustainable CMC variants, will further fuel market growth. Strategic partnerships and market expansion into new geographical regions will unlock considerable growth potential. The industry's focus on sustainability and compliance with stringent regulatory frameworks will shape future market dynamics. The overall market is poised for significant expansion in the coming years, presenting lucrative opportunities for established players and new entrants alike.
Carboxymethyl Cellulose Industry Segmentation
-
1. Application
- 1.1. Food and Beverages
- 1.2. Oil and Gas
- 1.3. Cosmetics and Pharmaceuticals
- 1.4. Detergents
- 1.5. Paper Processing
- 1.6. Other Ap
Carboxymethyl Cellulose Industry Segmentation By Geography
-
1. Asia Pacific
- 1.1. China
- 1.2. India
- 1.3. Japan
- 1.4. South Korea
- 1.5. Rest of Asia Pacific
-
2. North America
- 2.1. United States
- 2.2. Canada
- 2.3. Mexico
-
3. Europe
- 3.1. Germany
- 3.2. United Kingdom
- 3.3. Italy
- 3.4. France
- 3.5. Rest of Europe
-
4. South America
- 4.1. Brazil
- 4.2. Argentina
- 4.3. Rest of South America
-
5. Middle East and Africa
- 5.1. Saudi Arabia
- 5.2. South Africa
- 5.3. Rest of Middle East and Africa
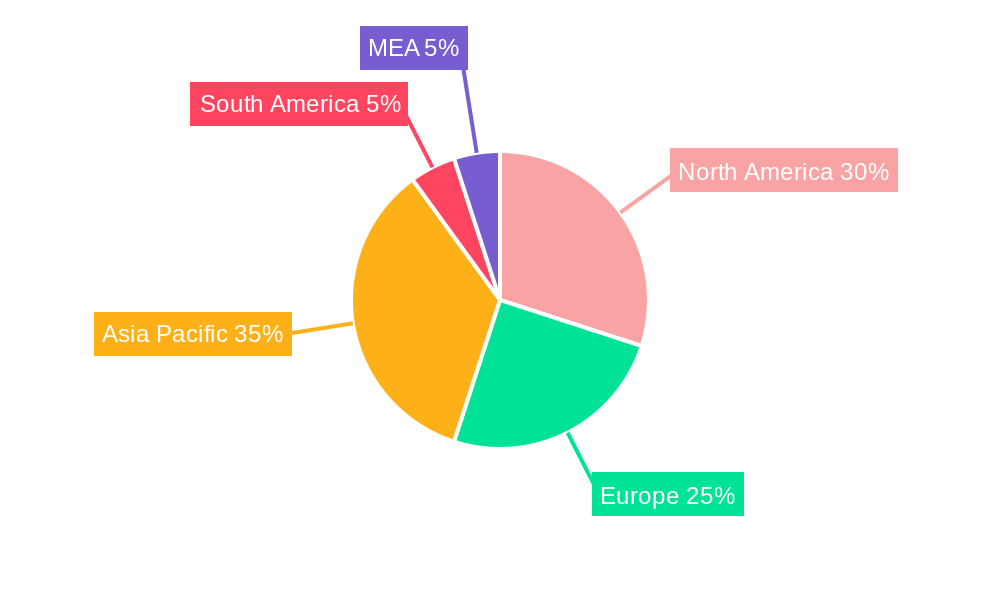
Carboxymethyl Cellulose Industry Regional Market Share
Geographic Coverage of Carboxymethyl Cellulose Industry
Carboxymethyl Cellulose Industry REPORT HIGHLIGHTS
| Aspects | Details |
|---|---|
| Study Period | 2020-2034 |
| Base Year | 2025 |
| Estimated Year | 2026 |
| Forecast Period | 2026-2034 |
| Historical Period | 2020-2025 |
| Growth Rate | CAGR of 4.64% from 2020-2034 |
| Segmentation |
|
Table of Contents
- 1. Introduction
- 1.1. Research Scope
- 1.2. Market Segmentation
- 1.3. Research Objective
- 1.4. Definitions and Assumptions
- 2. Executive Summary
- 2.1. Market Snapshot
- 3. Market Dynamics
- 3.1. Market Drivers
- 3.2. Market Restrains
- 3.3. Market Trends
- 3.4. Market Opportunities
- 4. Market Factor Analysis
- 4.1. Porters Five Forces
- 4.1.1. Bargaining Power of Suppliers
- 4.1.2. Bargaining Power of Buyers
- 4.1.3. Threat of New Entrants
- 4.1.4. Threat of Substitutes
- 4.1.5. Competitive Rivalry
- 4.2. PESTEL analysis
- 4.3. BCG Analysis
- 4.3.1. Stars (High Growth, High Market Share)
- 4.3.2. Cash Cows (Low Growth, High Market Share)
- 4.3.3. Question Mark (High Growth, Low Market Share)
- 4.3.4. Dogs (Low Growth, Low Market Share)
- 4.4. Ansoff Matrix Analysis
- 4.5. Supply Chain Analysis
- 4.6. Regulatory Landscape
- 4.7. Current Market Potential and Opportunity Assessment (TAM–SAM–SOM Framework)
- 4.8. VDR Analyst Note
- 4.1. Porters Five Forces
- 5. Market Analysis, Insights and Forecast 2021-2033
- 5.1. Market Analysis, Insights and Forecast - by Application
- 5.1.1. Food and Beverages
- 5.1.2. Oil and Gas
- 5.1.3. Cosmetics and Pharmaceuticals
- 5.1.4. Detergents
- 5.1.5. Paper Processing
- 5.1.6. Other Ap
- 5.2. Market Analysis, Insights and Forecast - by Region
- 5.2.1. Asia Pacific
- 5.2.2. North America
- 5.2.3. Europe
- 5.2.4. South America
- 5.2.5. Middle East and Africa
- 5.1. Market Analysis, Insights and Forecast - by Application
- 6. Global Carboxymethyl Cellulose Industry Analysis, Insights and Forecast, 2021-2033
- 6.1. Market Analysis, Insights and Forecast - by Application
- 6.1.1. Food and Beverages
- 6.1.2. Oil and Gas
- 6.1.3. Cosmetics and Pharmaceuticals
- 6.1.4. Detergents
- 6.1.5. Paper Processing
- 6.1.6. Other Ap
- 6.1. Market Analysis, Insights and Forecast - by Application
- 7. Asia Pacific Carboxymethyl Cellulose Industry Analysis, Insights and Forecast, 2021-2033
- 7.1. Market Analysis, Insights and Forecast - by Application
- 7.1.1. Food and Beverages
- 7.1.2. Oil and Gas
- 7.1.3. Cosmetics and Pharmaceuticals
- 7.1.4. Detergents
- 7.1.5. Paper Processing
- 7.1.6. Other Ap
- 7.1. Market Analysis, Insights and Forecast - by Application
- 8. North America Carboxymethyl Cellulose Industry Analysis, Insights and Forecast, 2021-2033
- 8.1. Market Analysis, Insights and Forecast - by Application
- 8.1.1. Food and Beverages
- 8.1.2. Oil and Gas
- 8.1.3. Cosmetics and Pharmaceuticals
- 8.1.4. Detergents
- 8.1.5. Paper Processing
- 8.1.6. Other Ap
- 8.1. Market Analysis, Insights and Forecast - by Application
- 9. Europe Carboxymethyl Cellulose Industry Analysis, Insights and Forecast, 2021-2033
- 9.1. Market Analysis, Insights and Forecast - by Application
- 9.1.1. Food and Beverages
- 9.1.2. Oil and Gas
- 9.1.3. Cosmetics and Pharmaceuticals
- 9.1.4. Detergents
- 9.1.5. Paper Processing
- 9.1.6. Other Ap
- 9.1. Market Analysis, Insights and Forecast - by Application
- 10. South America Carboxymethyl Cellulose Industry Analysis, Insights and Forecast, 2021-2033
- 10.1. Market Analysis, Insights and Forecast - by Application
- 10.1.1. Food and Beverages
- 10.1.2. Oil and Gas
- 10.1.3. Cosmetics and Pharmaceuticals
- 10.1.4. Detergents
- 10.1.5. Paper Processing
- 10.1.6. Other Ap
- 10.1. Market Analysis, Insights and Forecast - by Application
- 11. Middle East and Africa Carboxymethyl Cellulose Industry Analysis, Insights and Forecast, 2021-2033
- 11.1. Market Analysis, Insights and Forecast - by Application
- 11.1.1. Food and Beverages
- 11.1.2. Oil and Gas
- 11.1.3. Cosmetics and Pharmaceuticals
- 11.1.4. Detergents
- 11.1.5. Paper Processing
- 11.1.6. Other Ap
- 11.1. Market Analysis, Insights and Forecast - by Application
- 12. Competitive Analysis
- 12.1. Company Profiles
- 12.1.1 MIKEM
- 12.1.1.1. Company Overview
- 12.1.1.2. Products
- 12.1.1.3. Company Financials
- 12.1.1.4. SWOT Analysis
- 12.1.2 Lamberti S p A
- 12.1.2.1. Company Overview
- 12.1.2.2. Products
- 12.1.2.3. Company Financials
- 12.1.2.4. SWOT Analysis
- 12.1.3 Nouryon
- 12.1.3.1. Company Overview
- 12.1.3.2. Products
- 12.1.3.3. Company Financials
- 12.1.3.4. SWOT Analysis
- 12.1.4 Amtex Chemicals LLC
- 12.1.4.1. Company Overview
- 12.1.4.2. Products
- 12.1.4.3. Company Financials
- 12.1.4.4. SWOT Analysis
- 12.1.5 Mikro Technik GmbH
- 12.1.5.1. Company Overview
- 12.1.5.2. Products
- 12.1.5.3. Company Financials
- 12.1.5.4. SWOT Analysis
- 12.1.6 Jining Fortune Biotech Co Ltd
- 12.1.6.1. Company Overview
- 12.1.6.2. Products
- 12.1.6.3. Company Financials
- 12.1.6.4. SWOT Analysis
- 12.1.7 Chongqing Lihong Fine Chemicals Co Ltd
- 12.1.7.1. Company Overview
- 12.1.7.2. Products
- 12.1.7.3. Company Financials
- 12.1.7.4. SWOT Analysis
- 12.1.8 USK Rheology Solutions
- 12.1.8.1. Company Overview
- 12.1.8.2. Products
- 12.1.8.3. Company Financials
- 12.1.8.4. SWOT Analysis
- 12.1.9 Ashland
- 12.1.9.1. Company Overview
- 12.1.9.2. Products
- 12.1.9.3. Company Financials
- 12.1.9.4. SWOT Analysis
- 12.1.10 DKS Co Ltd
- 12.1.10.1. Company Overview
- 12.1.10.2. Products
- 12.1.10.3. Company Financials
- 12.1.10.4. SWOT Analysis
- 12.1.11 DuPont
- 12.1.11.1. Company Overview
- 12.1.11.2. Products
- 12.1.11.3. Company Financials
- 12.1.11.4. SWOT Analysis
- 12.1.12 Daicel Corporation
- 12.1.12.1. Company Overview
- 12.1.12.2. Products
- 12.1.12.3. Company Financials
- 12.1.12.4. SWOT Analysis
- 12.1.13 Foodchem International Corporation
- 12.1.13.1. Company Overview
- 12.1.13.2. Products
- 12.1.13.3. Company Financials
- 12.1.13.4. SWOT Analysis
- 12.1.14 Zibo Hailan Chemical Co Ltd
- 12.1.14.1. Company Overview
- 12.1.14.2. Products
- 12.1.14.3. Company Financials
- 12.1.14.4. SWOT Analysis
- 12.1.15 NIPPON PAPER INDUSTRIES CO LTD
- 12.1.15.1. Company Overview
- 12.1.15.2. Products
- 12.1.15.3. Company Financials
- 12.1.15.4. SWOT Analysis
- 12.1.1 MIKEM
- 12.2. Market Entropy
- 12.2.1 Company's Key Areas Served
- 12.2.2 Recent Developments
- 12.3. Company Market Share Analysis 2025
- 12.3.1 Top 5 Companies Market Share Analysis
- 12.3.2 Top 3 Companies Market Share Analysis
- 12.4. List of Potential Customers
- 13. Research Methodology
List of Figures
- Figure 1: Global Carboxymethyl Cellulose Industry Revenue Breakdown (Million, %) by Region 2025 & 2033
- Figure 2: Global Carboxymethyl Cellulose Industry Volume Breakdown (K Tons, %) by Region 2025 & 2033
- Figure 3: Asia Pacific Carboxymethyl Cellulose Industry Revenue (Million), by Application 2025 & 2033
- Figure 4: Asia Pacific Carboxymethyl Cellulose Industry Volume (K Tons), by Application 2025 & 2033
- Figure 5: Asia Pacific Carboxymethyl Cellulose Industry Revenue Share (%), by Application 2025 & 2033
- Figure 6: Asia Pacific Carboxymethyl Cellulose Industry Volume Share (%), by Application 2025 & 2033
- Figure 7: Asia Pacific Carboxymethyl Cellulose Industry Revenue (Million), by Country 2025 & 2033
- Figure 8: Asia Pacific Carboxymethyl Cellulose Industry Volume (K Tons), by Country 2025 & 2033
- Figure 9: Asia Pacific Carboxymethyl Cellulose Industry Revenue Share (%), by Country 2025 & 2033
- Figure 10: Asia Pacific Carboxymethyl Cellulose Industry Volume Share (%), by Country 2025 & 2033
- Figure 11: North America Carboxymethyl Cellulose Industry Revenue (Million), by Application 2025 & 2033
- Figure 12: North America Carboxymethyl Cellulose Industry Volume (K Tons), by Application 2025 & 2033
- Figure 13: North America Carboxymethyl Cellulose Industry Revenue Share (%), by Application 2025 & 2033
- Figure 14: North America Carboxymethyl Cellulose Industry Volume Share (%), by Application 2025 & 2033
- Figure 15: North America Carboxymethyl Cellulose Industry Revenue (Million), by Country 2025 & 2033
- Figure 16: North America Carboxymethyl Cellulose Industry Volume (K Tons), by Country 2025 & 2033
- Figure 17: North America Carboxymethyl Cellulose Industry Revenue Share (%), by Country 2025 & 2033
- Figure 18: North America Carboxymethyl Cellulose Industry Volume Share (%), by Country 2025 & 2033
- Figure 19: Europe Carboxymethyl Cellulose Industry Revenue (Million), by Application 2025 & 2033
- Figure 20: Europe Carboxymethyl Cellulose Industry Volume (K Tons), by Application 2025 & 2033
- Figure 21: Europe Carboxymethyl Cellulose Industry Revenue Share (%), by Application 2025 & 2033
- Figure 22: Europe Carboxymethyl Cellulose Industry Volume Share (%), by Application 2025 & 2033
- Figure 23: Europe Carboxymethyl Cellulose Industry Revenue (Million), by Country 2025 & 2033
- Figure 24: Europe Carboxymethyl Cellulose Industry Volume (K Tons), by Country 2025 & 2033
- Figure 25: Europe Carboxymethyl Cellulose Industry Revenue Share (%), by Country 2025 & 2033
- Figure 26: Europe Carboxymethyl Cellulose Industry Volume Share (%), by Country 2025 & 2033
- Figure 27: South America Carboxymethyl Cellulose Industry Revenue (Million), by Application 2025 & 2033
- Figure 28: South America Carboxymethyl Cellulose Industry Volume (K Tons), by Application 2025 & 2033
- Figure 29: South America Carboxymethyl Cellulose Industry Revenue Share (%), by Application 2025 & 2033
- Figure 30: South America Carboxymethyl Cellulose Industry Volume Share (%), by Application 2025 & 2033
- Figure 31: South America Carboxymethyl Cellulose Industry Revenue (Million), by Country 2025 & 2033
- Figure 32: South America Carboxymethyl Cellulose Industry Volume (K Tons), by Country 2025 & 2033
- Figure 33: South America Carboxymethyl Cellulose Industry Revenue Share (%), by Country 2025 & 2033
- Figure 34: South America Carboxymethyl Cellulose Industry Volume Share (%), by Country 2025 & 2033
- Figure 35: Middle East and Africa Carboxymethyl Cellulose Industry Revenue (Million), by Application 2025 & 2033
- Figure 36: Middle East and Africa Carboxymethyl Cellulose Industry Volume (K Tons), by Application 2025 & 2033
- Figure 37: Middle East and Africa Carboxymethyl Cellulose Industry Revenue Share (%), by Application 2025 & 2033
- Figure 38: Middle East and Africa Carboxymethyl Cellulose Industry Volume Share (%), by Application 2025 & 2033
- Figure 39: Middle East and Africa Carboxymethyl Cellulose Industry Revenue (Million), by Country 2025 & 2033
- Figure 40: Middle East and Africa Carboxymethyl Cellulose Industry Volume (K Tons), by Country 2025 & 2033
- Figure 41: Middle East and Africa Carboxymethyl Cellulose Industry Revenue Share (%), by Country 2025 & 2033
- Figure 42: Middle East and Africa Carboxymethyl Cellulose Industry Volume Share (%), by Country 2025 & 2033
List of Tables
- Table 1: Global Carboxymethyl Cellulose Industry Revenue Million Forecast, by Application 2020 & 2033
- Table 2: Global Carboxymethyl Cellulose Industry Volume K Tons Forecast, by Application 2020 & 2033
- Table 3: Global Carboxymethyl Cellulose Industry Revenue Million Forecast, by Region 2020 & 2033
- Table 4: Global Carboxymethyl Cellulose Industry Volume K Tons Forecast, by Region 2020 & 2033
- Table 5: Global Carboxymethyl Cellulose Industry Revenue Million Forecast, by Application 2020 & 2033
- Table 6: Global Carboxymethyl Cellulose Industry Volume K Tons Forecast, by Application 2020 & 2033
- Table 7: Global Carboxymethyl Cellulose Industry Revenue Million Forecast, by Country 2020 & 2033
- Table 8: Global Carboxymethyl Cellulose Industry Volume K Tons Forecast, by Country 2020 & 2033
- Table 9: China Carboxymethyl Cellulose Industry Revenue (Million) Forecast, by Application 2020 & 2033
- Table 10: China Carboxymethyl Cellulose Industry Volume (K Tons) Forecast, by Application 2020 & 2033
- Table 11: India Carboxymethyl Cellulose Industry Revenue (Million) Forecast, by Application 2020 & 2033
- Table 12: India Carboxymethyl Cellulose Industry Volume (K Tons) Forecast, by Application 2020 & 2033
- Table 13: Japan Carboxymethyl Cellulose Industry Revenue (Million) Forecast, by Application 2020 & 2033
- Table 14: Japan Carboxymethyl Cellulose Industry Volume (K Tons) Forecast, by Application 2020 & 2033
- Table 15: South Korea Carboxymethyl Cellulose Industry Revenue (Million) Forecast, by Application 2020 & 2033
- Table 16: South Korea Carboxymethyl Cellulose Industry Volume (K Tons) Forecast, by Application 2020 & 2033
- Table 17: Rest of Asia Pacific Carboxymethyl Cellulose Industry Revenue (Million) Forecast, by Application 2020 & 2033
- Table 18: Rest of Asia Pacific Carboxymethyl Cellulose Industry Volume (K Tons) Forecast, by Application 2020 & 2033
- Table 19: Global Carboxymethyl Cellulose Industry Revenue Million Forecast, by Application 2020 & 2033
- Table 20: Global Carboxymethyl Cellulose Industry Volume K Tons Forecast, by Application 2020 & 2033
- Table 21: Global Carboxymethyl Cellulose Industry Revenue Million Forecast, by Country 2020 & 2033
- Table 22: Global Carboxymethyl Cellulose Industry Volume K Tons Forecast, by Country 2020 & 2033
- Table 23: United States Carboxymethyl Cellulose Industry Revenue (Million) Forecast, by Application 2020 & 2033
- Table 24: United States Carboxymethyl Cellulose Industry Volume (K Tons) Forecast, by Application 2020 & 2033
- Table 25: Canada Carboxymethyl Cellulose Industry Revenue (Million) Forecast, by Application 2020 & 2033
- Table 26: Canada Carboxymethyl Cellulose Industry Volume (K Tons) Forecast, by Application 2020 & 2033
- Table 27: Mexico Carboxymethyl Cellulose Industry Revenue (Million) Forecast, by Application 2020 & 2033
- Table 28: Mexico Carboxymethyl Cellulose Industry Volume (K Tons) Forecast, by Application 2020 & 2033
- Table 29: Global Carboxymethyl Cellulose Industry Revenue Million Forecast, by Application 2020 & 2033
- Table 30: Global Carboxymethyl Cellulose Industry Volume K Tons Forecast, by Application 2020 & 2033
- Table 31: Global Carboxymethyl Cellulose Industry Revenue Million Forecast, by Country 2020 & 2033
- Table 32: Global Carboxymethyl Cellulose Industry Volume K Tons Forecast, by Country 2020 & 2033
- Table 33: Germany Carboxymethyl Cellulose Industry Revenue (Million) Forecast, by Application 2020 & 2033
- Table 34: Germany Carboxymethyl Cellulose Industry Volume (K Tons) Forecast, by Application 2020 & 2033
- Table 35: United Kingdom Carboxymethyl Cellulose Industry Revenue (Million) Forecast, by Application 2020 & 2033
- Table 36: United Kingdom Carboxymethyl Cellulose Industry Volume (K Tons) Forecast, by Application 2020 & 2033
- Table 37: Italy Carboxymethyl Cellulose Industry Revenue (Million) Forecast, by Application 2020 & 2033
- Table 38: Italy Carboxymethyl Cellulose Industry Volume (K Tons) Forecast, by Application 2020 & 2033
- Table 39: France Carboxymethyl Cellulose Industry Revenue (Million) Forecast, by Application 2020 & 2033
- Table 40: France Carboxymethyl Cellulose Industry Volume (K Tons) Forecast, by Application 2020 & 2033
- Table 41: Rest of Europe Carboxymethyl Cellulose Industry Revenue (Million) Forecast, by Application 2020 & 2033
- Table 42: Rest of Europe Carboxymethyl Cellulose Industry Volume (K Tons) Forecast, by Application 2020 & 2033
- Table 43: Global Carboxymethyl Cellulose Industry Revenue Million Forecast, by Application 2020 & 2033
- Table 44: Global Carboxymethyl Cellulose Industry Volume K Tons Forecast, by Application 2020 & 2033
- Table 45: Global Carboxymethyl Cellulose Industry Revenue Million Forecast, by Country 2020 & 2033
- Table 46: Global Carboxymethyl Cellulose Industry Volume K Tons Forecast, by Country 2020 & 2033
- Table 47: Brazil Carboxymethyl Cellulose Industry Revenue (Million) Forecast, by Application 2020 & 2033
- Table 48: Brazil Carboxymethyl Cellulose Industry Volume (K Tons) Forecast, by Application 2020 & 2033
- Table 49: Argentina Carboxymethyl Cellulose Industry Revenue (Million) Forecast, by Application 2020 & 2033
- Table 50: Argentina Carboxymethyl Cellulose Industry Volume (K Tons) Forecast, by Application 2020 & 2033
- Table 51: Rest of South America Carboxymethyl Cellulose Industry Revenue (Million) Forecast, by Application 2020 & 2033
- Table 52: Rest of South America Carboxymethyl Cellulose Industry Volume (K Tons) Forecast, by Application 2020 & 2033
- Table 53: Global Carboxymethyl Cellulose Industry Revenue Million Forecast, by Application 2020 & 2033
- Table 54: Global Carboxymethyl Cellulose Industry Volume K Tons Forecast, by Application 2020 & 2033
- Table 55: Global Carboxymethyl Cellulose Industry Revenue Million Forecast, by Country 2020 & 2033
- Table 56: Global Carboxymethyl Cellulose Industry Volume K Tons Forecast, by Country 2020 & 2033
- Table 57: Saudi Arabia Carboxymethyl Cellulose Industry Revenue (Million) Forecast, by Application 2020 & 2033
- Table 58: Saudi Arabia Carboxymethyl Cellulose Industry Volume (K Tons) Forecast, by Application 2020 & 2033
- Table 59: South Africa Carboxymethyl Cellulose Industry Revenue (Million) Forecast, by Application 2020 & 2033
- Table 60: South Africa Carboxymethyl Cellulose Industry Volume (K Tons) Forecast, by Application 2020 & 2033
- Table 61: Rest of Middle East and Africa Carboxymethyl Cellulose Industry Revenue (Million) Forecast, by Application 2020 & 2033
- Table 62: Rest of Middle East and Africa Carboxymethyl Cellulose Industry Volume (K Tons) Forecast, by Application 2020 & 2033
Frequently Asked Questions
1. What is the projected Compound Annual Growth Rate (CAGR) of the Carboxymethyl Cellulose Industry?
The projected CAGR is approximately 4.64%.
2. Which companies are prominent players in the Carboxymethyl Cellulose Industry?
Key companies in the market include MIKEM, Lamberti S p A, Nouryon, Amtex Chemicals LLC, Mikro Technik GmbH, Jining Fortune Biotech Co Ltd, Chongqing Lihong Fine Chemicals Co Ltd, USK Rheology Solutions, Ashland, DKS Co Ltd, DuPont, Daicel Corporation, Foodchem International Corporation, Zibo Hailan Chemical Co Ltd, NIPPON PAPER INDUSTRIES CO LTD.
3. What are the main segments of the Carboxymethyl Cellulose Industry?
The market segments include Application.
4. Can you provide details about the market size?
The market size is estimated to be USD 1.50 Million as of 2022.
5. What are some drivers contributing to market growth?
Increasing Adoption of Processed and Convenient Food; Surge in Oil Drilling Activities; Other Drivers.
6. What are the notable trends driving market growth?
Growing Applications in the Food and Beverages Sector.
7. Are there any restraints impacting market growth?
Availability of Substitutes in the Market; Other Restraints.
8. Can you provide examples of recent developments in the market?
February 2023: In Hungary, Nippon Paper Industries Co., Ltd. established a manufacturing and sales subsidiary for carboxymethyl cellulose named SUNROSE MAC. This expansion helped the company to grow its supply chain across Europe.
9. What pricing options are available for accessing the report?
Pricing options include single-user, multi-user, and enterprise licenses priced at USD 4750, USD 5250, and USD 8750 respectively.
10. Is the market size provided in terms of value or volume?
The market size is provided in terms of value, measured in Million and volume, measured in K Tons.
11. Are there any specific market keywords associated with the report?
Yes, the market keyword associated with the report is "Carboxymethyl Cellulose Industry," which aids in identifying and referencing the specific market segment covered.
12. How do I determine which pricing option suits my needs best?
The pricing options vary based on user requirements and access needs. Individual users may opt for single-user licenses, while businesses requiring broader access may choose multi-user or enterprise licenses for cost-effective access to the report.
13. Are there any additional resources or data provided in the Carboxymethyl Cellulose Industry report?
While the report offers comprehensive insights, it's advisable to review the specific contents or supplementary materials provided to ascertain if additional resources or data are available.
14. How can I stay updated on further developments or reports in the Carboxymethyl Cellulose Industry?
To stay informed about further developments, trends, and reports in the Carboxymethyl Cellulose Industry, consider subscribing to industry newsletters, following relevant companies and organizations, or regularly checking reputable industry news sources and publications.
Methodology
Step 1 - Identification of Relevant Samples Size from Population Database


Step 2 - Approaches for Defining Global Market Size (Value, Volume* & Price*)

Note*: In applicable scenarios
Step 3 - Data Sources
Primary Research
- Web Analytics
- Survey Reports
- Research Institute
- Latest Research Reports
- Opinion Leaders
Secondary Research
- Annual Reports
- White Paper
- Latest Press Release
- Industry Association
- Paid Database
- Investor Presentations

Step 4 - Data Triangulation
Involves using different sources of information in order to increase the validity of a study
These sources are likely to be stakeholders in a program - participants, other researchers, program staff, other community members, and so on.
Then we put all data in single framework & apply various statistical tools to find out the dynamic on the market.
During the analysis stage, feedback from the stakeholder groups would be compared to determine areas of agreement as well as areas of divergence