

Key Insights
The global canned fish market, encompassing tuna, salmon, and sardines, is poised for steady growth, projected to reach a substantial USD 37.2 billion in 2025. This expansion is driven by several key factors that enhance consumer appeal and market penetration. The convenience and long shelf-life of canned fish make it an attractive option for busy households seeking quick and nutritious meal solutions. Growing health consciousness among consumers worldwide is also a significant driver, as these products are recognized for their rich protein content and beneficial omega-3 fatty acids, supporting cardiovascular and cognitive health. Furthermore, the versatility of canned fish in various culinary applications, from salads and sandwiches to main courses, contributes to its sustained demand. The increasing popularity of online retail channels is also expanding access and convenience for consumers, further bolstering market growth. Innovations in packaging and product development, offering a wider variety of flavors and preparation methods, are also contributing to market expansion.
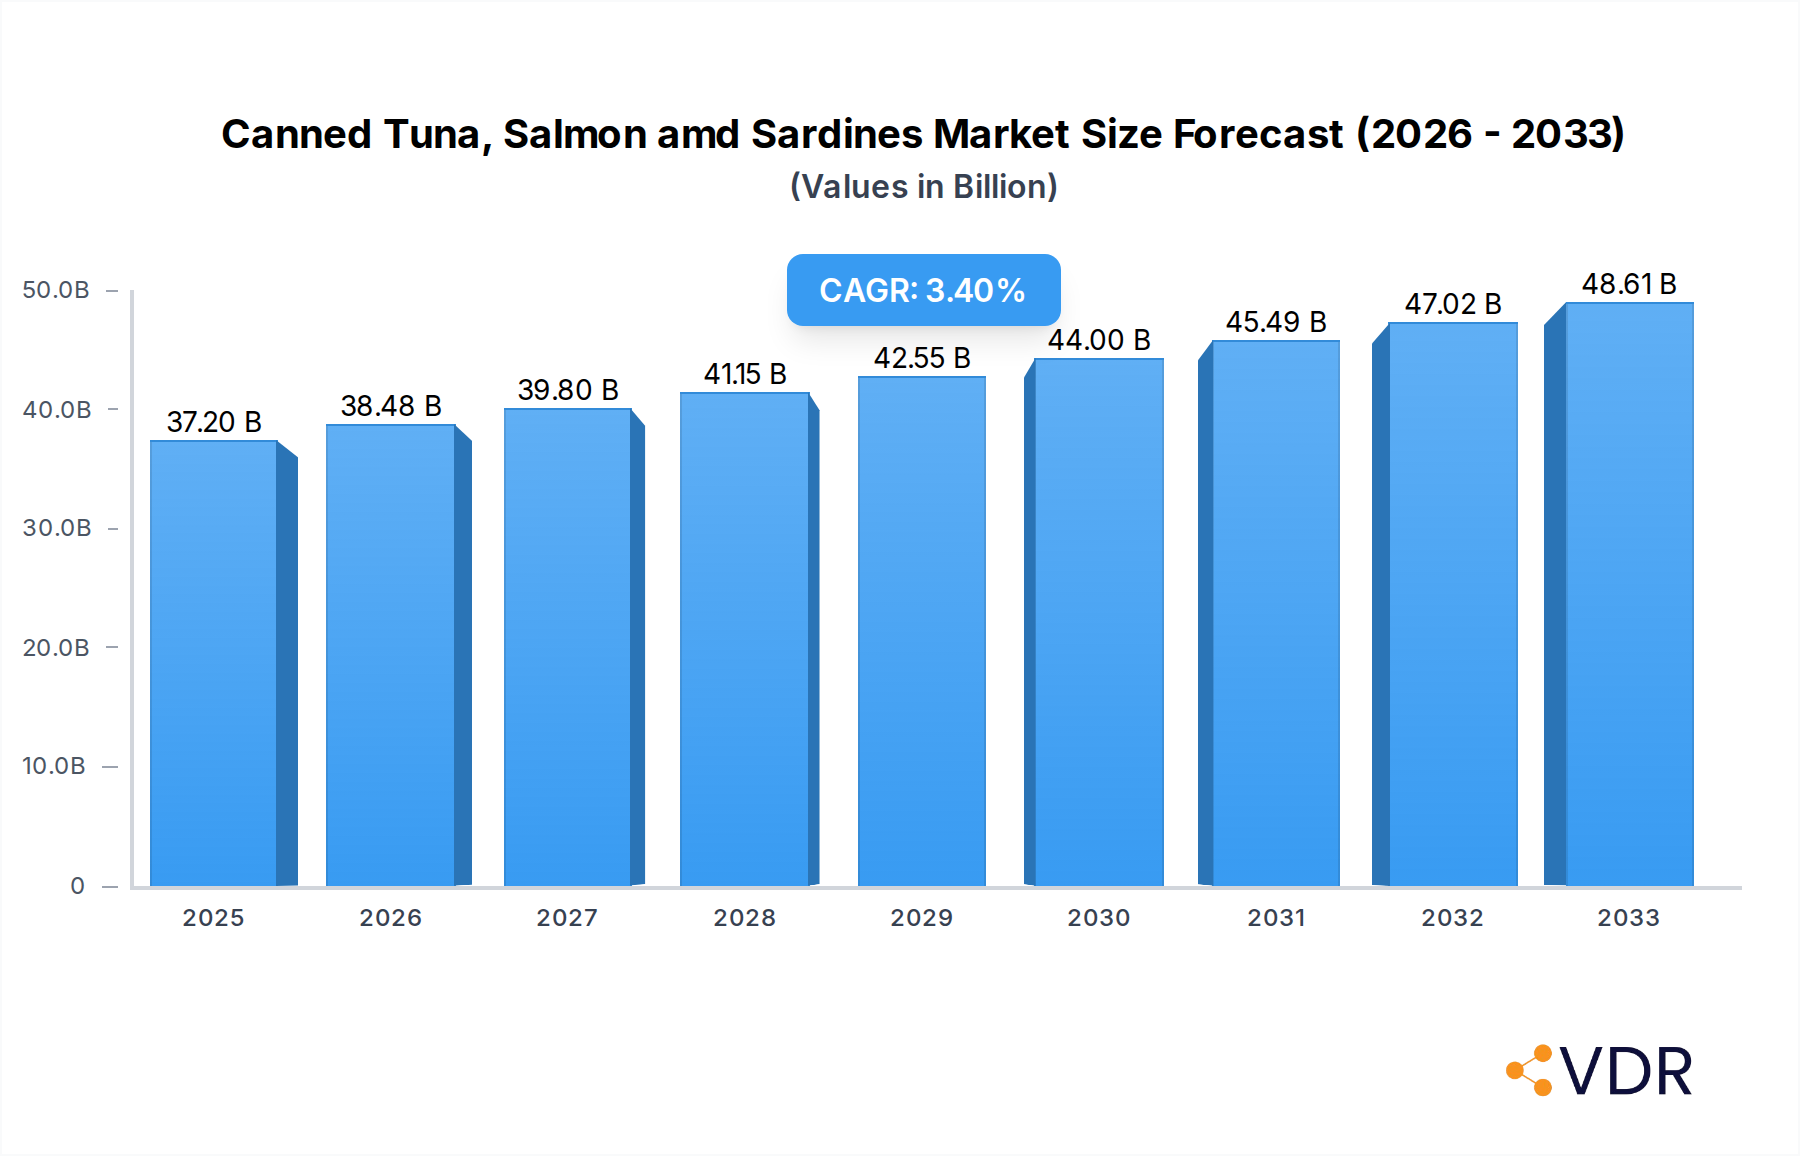
Canned Tuna, Salmon amd Sardines Market Size (In Billion)
The market is expected to witness a Compound Annual Growth Rate (CAGR) of 3.4% from 2025 to 2033, reflecting a consistent upward trajectory. While the market enjoys robust growth, certain challenges could influence its trajectory. Fluctuations in the prices of raw materials, primarily fish, due to factors such as fishing quotas, environmental regulations, and climate change, can impact profitability and consumer pricing. Intense competition among a large number of global and regional players also necessitates continuous innovation and strategic marketing to maintain market share. However, the ongoing demand for affordable and accessible protein sources, coupled with evolving consumer preferences for sustainable and ethically sourced seafood, presents significant opportunities for market players who can adapt and innovate. The market is segmented by application, with supermarkets and hypermarkets currently holding a dominant share, though online retailers are rapidly gaining prominence. The types of canned fish, including tuna, salmon, and sardines, all contribute to the overall market value, with tuna generally leading in consumption.

Canned Tuna, Salmon amd Sardines Company Market Share
Canned Tuna, Salmon, and Sardines Market Report: Global Dynamics, Trends, and Future Outlook (2019-2033)
This comprehensive report provides an in-depth analysis of the global canned tuna, salmon, and sardines market, offering critical insights for industry professionals, investors, and stakeholders. Spanning the historical period from 2019 to 2024, with a base year of 2025 and a forecast period extending to 2033, this study delves into market dynamics, growth trends, regional dominance, product innovations, key drivers, challenges, and emerging opportunities. Utilizing a robust methodology, this report delivers precise quantitative data and qualitative assessments to illuminate the path forward for this essential segment of the seafood industry. The analysis encompasses parent and child market dynamics, identifying key growth areas within the broader canned seafood landscape.
Canned Tuna, Salmon amd Sardines Market Dynamics & Structure
The global canned tuna, salmon, and sardines market exhibits a moderately consolidated structure, with a few large multinational corporations holding significant market share. Dongwon, Bumble Bee Foods, and Thai Union Group (TUF) are prominent players, actively driving market trends through strategic acquisitions and product innovation. Technological innovation is largely centered on improving shelf-life, enhancing nutritional value through fortification, and developing more sustainable sourcing practices. Regulatory frameworks, particularly concerning fishing quotas, sustainable certifications (e.g., MSC), and labeling requirements, play a crucial role in shaping market access and consumer perception. Competitive product substitutes include fresh and frozen seafood, as well as plant-based protein alternatives, which are gaining traction. End-user demographics are diverse, ranging from budget-conscious consumers seeking affordable protein to health-conscious individuals prioritizing omega-3 fatty acids and convenient meal solutions. Mergers and acquisitions (M&A) activity remains a significant driver for market consolidation and expansion, with companies seeking to broaden their product portfolios and geographical reach.
- Market Concentration: Dominated by a few key players, with increasing fragmentation in niche and regional markets.
- Technological Innovation Drivers: Focus on sustainable fishing, traceability, advanced processing techniques, and value-added products.
- Regulatory Frameworks: Strict adherence to international fishing regulations, sustainability certifications, and food safety standards is paramount.
- Competitive Product Substitutes: Growing competition from fresh seafood, frozen alternatives, and the burgeoning plant-based protein sector.
- End-User Demographics: Broad appeal across income brackets, with increasing demand from health-conscious and convenience-seeking consumers.
- M&A Trends: Strategic acquisitions to gain market share, diversify product offerings, and enhance supply chain integration. Deal volumes are expected to remain robust in the forecast period.
Canned Tuna, Salmon amd Sardines Growth Trends & Insights
The global canned tuna, salmon, and sardines market has demonstrated consistent growth, propelled by increasing consumer demand for convenient, affordable, and nutritious protein sources. The market size evolution is projected to see a significant upward trajectory, with a projected Compound Annual Growth Rate (CAGR) of approximately 5.2% between 2025 and 2033. Adoption rates for canned seafood remain high, particularly in developing economies where affordability and accessibility are key factors. Technological disruptions are relatively incremental in this mature market, with advancements primarily focusing on improving sustainability, traceability, and packaging innovations. Consumer behavior shifts are a significant influencer, with a growing emphasis on health and wellness driving demand for omega-3 rich fish like salmon and sardines. Consumers are increasingly scrutinizing product origins and sustainability practices, leading to a greater preference for responsibly sourced canned seafood. The convenience factor of canned goods, requiring no refrigeration and offering a long shelf life, continues to resonate with busy lifestyles. Furthermore, the versatility of canned fish in various culinary applications, from salads and sandwiches to main courses, further solidifies its market position. The "superfoods" perception of certain fish types, like salmon, is also contributing to sustained demand.
- Market Size Evolution: The global market is projected to reach approximately $XX billion by 2033, up from an estimated $XX billion in 2025.
- Adoption Rates: High and stable, with particular growth in emerging markets due to economic development and increasing disposable incomes.
- Technological Disruptions: Primarily focused on sustainable fishing technologies, improved processing for enhanced nutrient retention, and eco-friendly packaging solutions.
- Consumer Behavior Shifts: Growing preference for health-conscious options, leading to increased demand for omega-3 rich varieties like salmon and sardines. Heightened awareness and demand for sustainably sourced and ethically produced seafood.
- Market Penetration: Continues to expand globally, driven by affordability and accessibility, especially in regions with developing cold chain infrastructure.
Dominant Regions, Countries, or Segments in Canned Tuna, Salmon amd Sardines
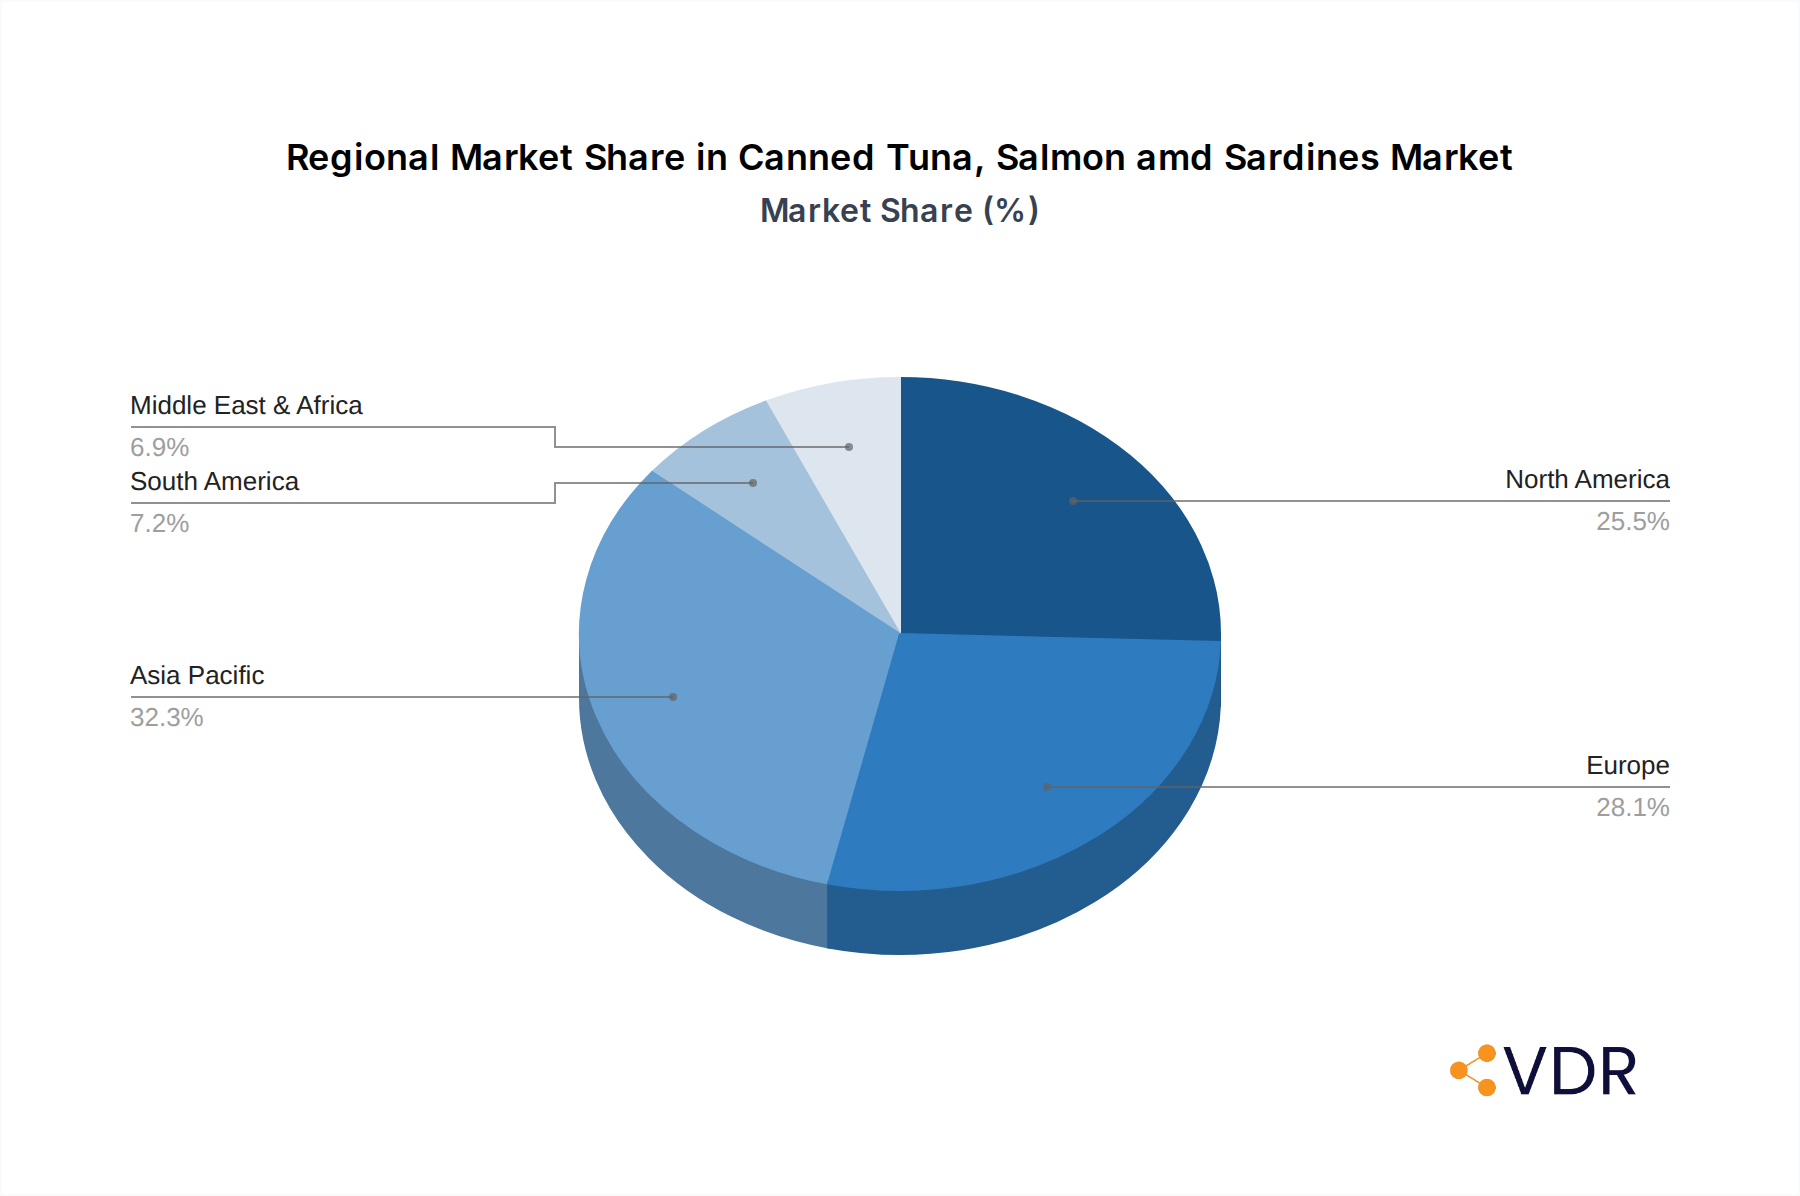
The Supermarkets and Hypermarkets segment stands as the dominant channel driving growth in the global canned tuna, salmon, and sardines market. This segment offers the widest assortment of brands, product types, and price points, catering to a broad consumer base. Its extensive reach and established distribution networks make it the primary point of purchase for most households. Economically developed regions with high population density and robust retail infrastructure, such as North America and Europe, exhibit strong market share due to high consumer purchasing power and established preferences for canned seafood. However, Asia Pacific is emerging as a significant growth engine, driven by rising disposable incomes, increasing urbanization, and a growing awareness of the health benefits associated with fish consumption. Economic policies promoting food security and affordable protein sources also contribute to market expansion in these regions.
Within the Types segment, Canned Tuna continues to hold the largest market share due to its widespread availability, affordability, and versatility. However, Canned Salmon is experiencing robust growth driven by its perceived health benefits and premium positioning. Canned Sardines, while historically a more niche product, are gaining traction as a sustainable and nutrient-dense option, appealing to environmentally conscious consumers.
- Dominant Application Segment:
- Supermarkets and Hypermarkets: accounting for over 60% of the market share.
- Key Drivers: Wide product availability, competitive pricing, promotional activities, and one-stop shopping convenience.
- Growth Potential: Steady growth driven by population increases and the essential nature of these products in household consumption.
- Supermarkets and Hypermarkets: accounting for over 60% of the market share.
- Dominant Region/Country:
- North America: Holds a significant market share due to established consumer habits and high per capita consumption.
- Key Drivers: Strong demand for convenience, health benefits associated with omega-3s, and established retail infrastructure.
- Growth Potential: Moderate but consistent growth, with increasing demand for premium and sustainably sourced options.
- North America: Holds a significant market share due to established consumer habits and high per capita consumption.
- Dominant Type Segment:
- Canned Tuna: Consistently leads market share.
- Key Drivers: Affordability, versatility in culinary applications, and broad brand availability.
- Growth Potential: Continued dominance, with innovation focusing on flavor profiles and sustainable sourcing.
- Canned Tuna: Consistently leads market share.
- Emerging Growth Hotspots:
- Asia Pacific: Rapidly growing market driven by increasing disposable incomes and growing health consciousness.
- Key Drivers: Urbanization, increasing awareness of nutritional benefits, and expansion of modern retail formats.
- Growth Potential: Highest growth potential among all regions in the forecast period.
- Asia Pacific: Rapidly growing market driven by increasing disposable incomes and growing health consciousness.
Canned Tuna, Salmon amd Sardines Product Landscape
The product landscape in the canned tuna, salmon, and sardines market is characterized by a focus on convenience, health, and sustainability. Innovations include ready-to-eat meals, flavored varieties catering to diverse palates (e.g., spicy, herb-infused), and plant-based alternatives for those seeking plant-forward diets. Performance metrics are largely driven by nutritional content (omega-3 fatty acids, protein), shelf stability, and the perception of environmental responsibility. Brands are increasingly highlighting their commitment to sustainable fishing practices and ethical sourcing as key unique selling propositions. Technological advancements in canning processes aim to preserve natural flavors and nutrients, offering a superior consumer experience.
Key Drivers, Barriers & Challenges in Canned Tuna, Salmon amd Sardines
Key Drivers:
- Growing Demand for Convenience: Busy lifestyles and the need for quick, easy meal solutions drive consumption of canned seafood.
- Health and Nutritional Benefits: The high protein and omega-3 fatty acid content of tuna, salmon, and sardines positions them as healthy food choices.
- Affordability: Canned seafood remains a cost-effective protein source compared to many fresh or frozen alternatives, especially for price-sensitive consumers.
- Long Shelf Life and Portability: The inherent stability and ease of transport make canned fish ideal for pantries and on-the-go consumption.
- Sustainable Sourcing Initiatives: Growing consumer awareness and corporate responsibility are pushing for and rewarding sustainably sourced products.
Key Barriers & Challenges:
- Supply Chain Volatility: Fluctuations in fish stock, weather patterns, and geopolitical events can impact raw material availability and pricing, creating supply chain vulnerabilities.
- Regulatory Hurdles: Evolving fishing quotas, international regulations on sustainability, and labeling requirements can pose compliance challenges and increase operational costs.
- Competition from Fresh and Frozen Seafood: Increasing consumer preference for fresh ingredients and advancements in cold chain logistics can divert consumers from canned options.
- Consumer Perception of "Processed Food": Some consumers may perceive canned products as less fresh or natural compared to other protein sources.
- Environmental Concerns: Negative perceptions related to overfishing and bycatch in certain fishing methods can impact brand reputation if not actively addressed.
Emerging Opportunities in Canned Tuna, Salmon amd Sardines
Emerging opportunities lie in the development of premium, value-added products that cater to evolving consumer preferences. This includes gourmet flavors, single-serving portions for increased convenience, and products specifically fortified with vitamins and minerals. The growing popularity of plant-based diets presents an opportunity for brands to innovate with sustainable seafood alternatives or to clearly communicate the environmental benefits of responsibly sourced fish. Untapped markets in developing regions with increasing disposable incomes and a growing awareness of health and nutrition also represent significant growth potential. Furthermore, advancements in packaging technology, such as retort pouches and sustainable materials, can enhance product appeal and environmental credentials.
Growth Accelerators in the Canned Tuna, Salmon amd Sardines Industry
Long-term growth in the canned tuna, salmon, and sardines industry will be significantly accelerated by strategic partnerships between seafood producers and retailers to promote sustainable sourcing and consumer education. Technological breakthroughs in aquaculture and fishing practices that ensure environmental sustainability and improve yield efficiency will be crucial. Market expansion strategies targeting underserved demographics and geographical regions, coupled with innovative marketing campaigns that highlight the health and convenience benefits, will further fuel growth. The development of traceability technologies, allowing consumers to track the origin of their seafood, will build trust and loyalty.
Key Players Shaping the Canned Tuna, Salmon amd Sardines Market
- Dongwon
- Bumble Bee Foods
- Thai Union Group (TUF)
- Crown Prince, Inc.
- Natural Sea
- Wild Planet
- American Tuna
- Century Pacific Food
- Frinsa del Noroeste
- Hagoromo
- Bolton group
- Grupo Calvo
- Camil Alimentos
- Goody
- Al Alali
Notable Milestones in Canned Tuna, Salmon amd Sardines Sector
- 2019: Increased consumer focus on sustainability certifications like MSC (Marine Stewardship Council) leading to greater demand for certified products.
- 2020: Supply chain disruptions due to the COVID-19 pandemic highlighted the resilience of canned goods and their role in food security.
- 2021: Growing adoption of plant-based diets prompting some brands to explore or expand their plant-based protein offerings alongside traditional seafood.
- 2022: Innovations in flavor profiles and the introduction of value-added products like tuna salad kits gaining traction.
- 2023: Heightened awareness of microplastic pollution leading to increased scrutiny of packaging materials and a push for more sustainable options.
- 2024: Significant M&A activity as larger players consolidate market share and expand product portfolios.
In-Depth Canned Tuna, Salmon amd Sardines Market Outlook
The future outlook for the canned tuna, salmon, and sardines market remains robust, driven by the enduring appeal of convenience, affordability, and nutritional value. Growth accelerators such as technological advancements in sustainable fishing, innovative product development catering to health-conscious consumers, and strategic market expansion in emerging economies will propel the industry forward. Strategic partnerships and a continued focus on transparency and traceability will be key to navigating competitive pressures and enhancing consumer trust. The market is poised for sustained growth, with increasing opportunities in premium segments and value-added offerings.
Canned Tuna, Salmon amd Sardines Segmentation
-
1. Application
- 1.1. Supermarkets and Hypermarkets
- 1.2. Convenience Stores
- 1.3. Online Retailers
- 1.4. Others
-
2. Types
- 2.1. Canned Tuna
- 2.2. Canned Salmon
- 2.3. Canned Sardines
Canned Tuna, Salmon amd Sardines Segmentation By Geography
-
1. North America
- 1.1. United States
- 1.2. Canada
- 1.3. Mexico
-
2. South America
- 2.1. Brazil
- 2.2. Argentina
- 2.3. Rest of South America
-
3. Europe
- 3.1. United Kingdom
- 3.2. Germany
- 3.3. France
- 3.4. Italy
- 3.5. Spain
- 3.6. Russia
- 3.7. Benelux
- 3.8. Nordics
- 3.9. Rest of Europe
-
4. Middle East & Africa
- 4.1. Turkey
- 4.2. Israel
- 4.3. GCC
- 4.4. North Africa
- 4.5. South Africa
- 4.6. Rest of Middle East & Africa
-
5. Asia Pacific
- 5.1. China
- 5.2. India
- 5.3. Japan
- 5.4. South Korea
- 5.5. ASEAN
- 5.6. Oceania
- 5.7. Rest of Asia Pacific
Canned Tuna, Salmon amd Sardines Regional Market Share
Geographic Coverage of Canned Tuna, Salmon amd Sardines
Canned Tuna, Salmon amd Sardines REPORT HIGHLIGHTS
| Aspects | Details |
|---|---|
| Study Period | 2020-2034 |
| Base Year | 2025 |
| Estimated Year | 2026 |
| Forecast Period | 2026-2034 |
| Historical Period | 2020-2025 |
| Growth Rate | CAGR of 3.5% from 2020-2034 |
| Segmentation |
|
Table of Contents
- 1. Introduction
- 1.1. Research Scope
- 1.2. Market Segmentation
- 1.3. Research Methodology
- 1.4. Definitions and Assumptions
- 2. Executive Summary
- 2.1. Introduction
- 3. Market Dynamics
- 3.1. Introduction
- 3.2. Market Drivers
- 3.3. Market Restrains
- 3.4. Market Trends
- 4. Market Factor Analysis
- 4.1. Porters Five Forces
- 4.2. Supply/Value Chain
- 4.3. PESTEL analysis
- 4.4. Market Entropy
- 4.5. Patent/Trademark Analysis
- 5. Global Canned Tuna, Salmon amd Sardines Analysis, Insights and Forecast, 2020-2032
- 5.1. Market Analysis, Insights and Forecast - by Application
- 5.1.1. Supermarkets and Hypermarkets
- 5.1.2. Convenience Stores
- 5.1.3. Online Retailers
- 5.1.4. Others
- 5.2. Market Analysis, Insights and Forecast - by Types
- 5.2.1. Canned Tuna
- 5.2.2. Canned Salmon
- 5.2.3. Canned Sardines
- 5.3. Market Analysis, Insights and Forecast - by Region
- 5.3.1. North America
- 5.3.2. South America
- 5.3.3. Europe
- 5.3.4. Middle East & Africa
- 5.3.5. Asia Pacific
- 5.1. Market Analysis, Insights and Forecast - by Application
- 6. North America Canned Tuna, Salmon amd Sardines Analysis, Insights and Forecast, 2020-2032
- 6.1. Market Analysis, Insights and Forecast - by Application
- 6.1.1. Supermarkets and Hypermarkets
- 6.1.2. Convenience Stores
- 6.1.3. Online Retailers
- 6.1.4. Others
- 6.2. Market Analysis, Insights and Forecast - by Types
- 6.2.1. Canned Tuna
- 6.2.2. Canned Salmon
- 6.2.3. Canned Sardines
- 6.1. Market Analysis, Insights and Forecast - by Application
- 7. South America Canned Tuna, Salmon amd Sardines Analysis, Insights and Forecast, 2020-2032
- 7.1. Market Analysis, Insights and Forecast - by Application
- 7.1.1. Supermarkets and Hypermarkets
- 7.1.2. Convenience Stores
- 7.1.3. Online Retailers
- 7.1.4. Others
- 7.2. Market Analysis, Insights and Forecast - by Types
- 7.2.1. Canned Tuna
- 7.2.2. Canned Salmon
- 7.2.3. Canned Sardines
- 7.1. Market Analysis, Insights and Forecast - by Application
- 8. Europe Canned Tuna, Salmon amd Sardines Analysis, Insights and Forecast, 2020-2032
- 8.1. Market Analysis, Insights and Forecast - by Application
- 8.1.1. Supermarkets and Hypermarkets
- 8.1.2. Convenience Stores
- 8.1.3. Online Retailers
- 8.1.4. Others
- 8.2. Market Analysis, Insights and Forecast - by Types
- 8.2.1. Canned Tuna
- 8.2.2. Canned Salmon
- 8.2.3. Canned Sardines
- 8.1. Market Analysis, Insights and Forecast - by Application
- 9. Middle East & Africa Canned Tuna, Salmon amd Sardines Analysis, Insights and Forecast, 2020-2032
- 9.1. Market Analysis, Insights and Forecast - by Application
- 9.1.1. Supermarkets and Hypermarkets
- 9.1.2. Convenience Stores
- 9.1.3. Online Retailers
- 9.1.4. Others
- 9.2. Market Analysis, Insights and Forecast - by Types
- 9.2.1. Canned Tuna
- 9.2.2. Canned Salmon
- 9.2.3. Canned Sardines
- 9.1. Market Analysis, Insights and Forecast - by Application
- 10. Asia Pacific Canned Tuna, Salmon amd Sardines Analysis, Insights and Forecast, 2020-2032
- 10.1. Market Analysis, Insights and Forecast - by Application
- 10.1.1. Supermarkets and Hypermarkets
- 10.1.2. Convenience Stores
- 10.1.3. Online Retailers
- 10.1.4. Others
- 10.2. Market Analysis, Insights and Forecast - by Types
- 10.2.1. Canned Tuna
- 10.2.2. Canned Salmon
- 10.2.3. Canned Sardines
- 10.1. Market Analysis, Insights and Forecast - by Application
- 11. Competitive Analysis
- 11.1. Global Market Share Analysis 2025
- 11.2. Company Profiles
- 11.2.1 Dongwon
- 11.2.1.1. Overview
- 11.2.1.2. Products
- 11.2.1.3. SWOT Analysis
- 11.2.1.4. Recent Developments
- 11.2.1.5. Financials (Based on Availability)
- 11.2.2 Bumble Bee Foods
- 11.2.2.1. Overview
- 11.2.2.2. Products
- 11.2.2.3. SWOT Analysis
- 11.2.2.4. Recent Developments
- 11.2.2.5. Financials (Based on Availability)
- 11.2.3 Thai Union Group (TUF)
- 11.2.3.1. Overview
- 11.2.3.2. Products
- 11.2.3.3. SWOT Analysis
- 11.2.3.4. Recent Developments
- 11.2.3.5. Financials (Based on Availability)
- 11.2.4 Crown Prince
- 11.2.4.1. Overview
- 11.2.4.2. Products
- 11.2.4.3. SWOT Analysis
- 11.2.4.4. Recent Developments
- 11.2.4.5. Financials (Based on Availability)
- 11.2.5 Inc.
- 11.2.5.1. Overview
- 11.2.5.2. Products
- 11.2.5.3. SWOT Analysis
- 11.2.5.4. Recent Developments
- 11.2.5.5. Financials (Based on Availability)
- 11.2.6 Natural Sea
- 11.2.6.1. Overview
- 11.2.6.2. Products
- 11.2.6.3. SWOT Analysis
- 11.2.6.4. Recent Developments
- 11.2.6.5. Financials (Based on Availability)
- 11.2.7 Wild Planet
- 11.2.7.1. Overview
- 11.2.7.2. Products
- 11.2.7.3. SWOT Analysis
- 11.2.7.4. Recent Developments
- 11.2.7.5. Financials (Based on Availability)
- 11.2.8 American Tuna
- 11.2.8.1. Overview
- 11.2.8.2. Products
- 11.2.8.3. SWOT Analysis
- 11.2.8.4. Recent Developments
- 11.2.8.5. Financials (Based on Availability)
- 11.2.9 Century Pacific Food
- 11.2.9.1. Overview
- 11.2.9.2. Products
- 11.2.9.3. SWOT Analysis
- 11.2.9.4. Recent Developments
- 11.2.9.5. Financials (Based on Availability)
- 11.2.10 Frinsa del Noroeste
- 11.2.10.1. Overview
- 11.2.10.2. Products
- 11.2.10.3. SWOT Analysis
- 11.2.10.4. Recent Developments
- 11.2.10.5. Financials (Based on Availability)
- 11.2.11 Hagoromo
- 11.2.11.1. Overview
- 11.2.11.2. Products
- 11.2.11.3. SWOT Analysis
- 11.2.11.4. Recent Developments
- 11.2.11.5. Financials (Based on Availability)
- 11.2.12 Bolton group
- 11.2.12.1. Overview
- 11.2.12.2. Products
- 11.2.12.3. SWOT Analysis
- 11.2.12.4. Recent Developments
- 11.2.12.5. Financials (Based on Availability)
- 11.2.13 Grupo Calvo
- 11.2.13.1. Overview
- 11.2.13.2. Products
- 11.2.13.3. SWOT Analysis
- 11.2.13.4. Recent Developments
- 11.2.13.5. Financials (Based on Availability)
- 11.2.14 Camil Alimentos
- 11.2.14.1. Overview
- 11.2.14.2. Products
- 11.2.14.3. SWOT Analysis
- 11.2.14.4. Recent Developments
- 11.2.14.5. Financials (Based on Availability)
- 11.2.15 Goody
- 11.2.15.1. Overview
- 11.2.15.2. Products
- 11.2.15.3. SWOT Analysis
- 11.2.15.4. Recent Developments
- 11.2.15.5. Financials (Based on Availability)
- 11.2.16 Al Alali
- 11.2.16.1. Overview
- 11.2.16.2. Products
- 11.2.16.3. SWOT Analysis
- 11.2.16.4. Recent Developments
- 11.2.16.5. Financials (Based on Availability)
- 11.2.1 Dongwon
List of Figures
- Figure 1: Global Canned Tuna, Salmon amd Sardines Revenue Breakdown (undefined, %) by Region 2025 & 2033
- Figure 2: Global Canned Tuna, Salmon amd Sardines Volume Breakdown (K, %) by Region 2025 & 2033
- Figure 3: North America Canned Tuna, Salmon amd Sardines Revenue (undefined), by Application 2025 & 2033
- Figure 4: North America Canned Tuna, Salmon amd Sardines Volume (K), by Application 2025 & 2033
- Figure 5: North America Canned Tuna, Salmon amd Sardines Revenue Share (%), by Application 2025 & 2033
- Figure 6: North America Canned Tuna, Salmon amd Sardines Volume Share (%), by Application 2025 & 2033
- Figure 7: North America Canned Tuna, Salmon amd Sardines Revenue (undefined), by Types 2025 & 2033
- Figure 8: North America Canned Tuna, Salmon amd Sardines Volume (K), by Types 2025 & 2033
- Figure 9: North America Canned Tuna, Salmon amd Sardines Revenue Share (%), by Types 2025 & 2033
- Figure 10: North America Canned Tuna, Salmon amd Sardines Volume Share (%), by Types 2025 & 2033
- Figure 11: North America Canned Tuna, Salmon amd Sardines Revenue (undefined), by Country 2025 & 2033
- Figure 12: North America Canned Tuna, Salmon amd Sardines Volume (K), by Country 2025 & 2033
- Figure 13: North America Canned Tuna, Salmon amd Sardines Revenue Share (%), by Country 2025 & 2033
- Figure 14: North America Canned Tuna, Salmon amd Sardines Volume Share (%), by Country 2025 & 2033
- Figure 15: South America Canned Tuna, Salmon amd Sardines Revenue (undefined), by Application 2025 & 2033
- Figure 16: South America Canned Tuna, Salmon amd Sardines Volume (K), by Application 2025 & 2033
- Figure 17: South America Canned Tuna, Salmon amd Sardines Revenue Share (%), by Application 2025 & 2033
- Figure 18: South America Canned Tuna, Salmon amd Sardines Volume Share (%), by Application 2025 & 2033
- Figure 19: South America Canned Tuna, Salmon amd Sardines Revenue (undefined), by Types 2025 & 2033
- Figure 20: South America Canned Tuna, Salmon amd Sardines Volume (K), by Types 2025 & 2033
- Figure 21: South America Canned Tuna, Salmon amd Sardines Revenue Share (%), by Types 2025 & 2033
- Figure 22: South America Canned Tuna, Salmon amd Sardines Volume Share (%), by Types 2025 & 2033
- Figure 23: South America Canned Tuna, Salmon amd Sardines Revenue (undefined), by Country 2025 & 2033
- Figure 24: South America Canned Tuna, Salmon amd Sardines Volume (K), by Country 2025 & 2033
- Figure 25: South America Canned Tuna, Salmon amd Sardines Revenue Share (%), by Country 2025 & 2033
- Figure 26: South America Canned Tuna, Salmon amd Sardines Volume Share (%), by Country 2025 & 2033
- Figure 27: Europe Canned Tuna, Salmon amd Sardines Revenue (undefined), by Application 2025 & 2033
- Figure 28: Europe Canned Tuna, Salmon amd Sardines Volume (K), by Application 2025 & 2033
- Figure 29: Europe Canned Tuna, Salmon amd Sardines Revenue Share (%), by Application 2025 & 2033
- Figure 30: Europe Canned Tuna, Salmon amd Sardines Volume Share (%), by Application 2025 & 2033
- Figure 31: Europe Canned Tuna, Salmon amd Sardines Revenue (undefined), by Types 2025 & 2033
- Figure 32: Europe Canned Tuna, Salmon amd Sardines Volume (K), by Types 2025 & 2033
- Figure 33: Europe Canned Tuna, Salmon amd Sardines Revenue Share (%), by Types 2025 & 2033
- Figure 34: Europe Canned Tuna, Salmon amd Sardines Volume Share (%), by Types 2025 & 2033
- Figure 35: Europe Canned Tuna, Salmon amd Sardines Revenue (undefined), by Country 2025 & 2033
- Figure 36: Europe Canned Tuna, Salmon amd Sardines Volume (K), by Country 2025 & 2033
- Figure 37: Europe Canned Tuna, Salmon amd Sardines Revenue Share (%), by Country 2025 & 2033
- Figure 38: Europe Canned Tuna, Salmon amd Sardines Volume Share (%), by Country 2025 & 2033
- Figure 39: Middle East & Africa Canned Tuna, Salmon amd Sardines Revenue (undefined), by Application 2025 & 2033
- Figure 40: Middle East & Africa Canned Tuna, Salmon amd Sardines Volume (K), by Application 2025 & 2033
- Figure 41: Middle East & Africa Canned Tuna, Salmon amd Sardines Revenue Share (%), by Application 2025 & 2033
- Figure 42: Middle East & Africa Canned Tuna, Salmon amd Sardines Volume Share (%), by Application 2025 & 2033
- Figure 43: Middle East & Africa Canned Tuna, Salmon amd Sardines Revenue (undefined), by Types 2025 & 2033
- Figure 44: Middle East & Africa Canned Tuna, Salmon amd Sardines Volume (K), by Types 2025 & 2033
- Figure 45: Middle East & Africa Canned Tuna, Salmon amd Sardines Revenue Share (%), by Types 2025 & 2033
- Figure 46: Middle East & Africa Canned Tuna, Salmon amd Sardines Volume Share (%), by Types 2025 & 2033
- Figure 47: Middle East & Africa Canned Tuna, Salmon amd Sardines Revenue (undefined), by Country 2025 & 2033
- Figure 48: Middle East & Africa Canned Tuna, Salmon amd Sardines Volume (K), by Country 2025 & 2033
- Figure 49: Middle East & Africa Canned Tuna, Salmon amd Sardines Revenue Share (%), by Country 2025 & 2033
- Figure 50: Middle East & Africa Canned Tuna, Salmon amd Sardines Volume Share (%), by Country 2025 & 2033
- Figure 51: Asia Pacific Canned Tuna, Salmon amd Sardines Revenue (undefined), by Application 2025 & 2033
- Figure 52: Asia Pacific Canned Tuna, Salmon amd Sardines Volume (K), by Application 2025 & 2033
- Figure 53: Asia Pacific Canned Tuna, Salmon amd Sardines Revenue Share (%), by Application 2025 & 2033
- Figure 54: Asia Pacific Canned Tuna, Salmon amd Sardines Volume Share (%), by Application 2025 & 2033
- Figure 55: Asia Pacific Canned Tuna, Salmon amd Sardines Revenue (undefined), by Types 2025 & 2033
- Figure 56: Asia Pacific Canned Tuna, Salmon amd Sardines Volume (K), by Types 2025 & 2033
- Figure 57: Asia Pacific Canned Tuna, Salmon amd Sardines Revenue Share (%), by Types 2025 & 2033
- Figure 58: Asia Pacific Canned Tuna, Salmon amd Sardines Volume Share (%), by Types 2025 & 2033
- Figure 59: Asia Pacific Canned Tuna, Salmon amd Sardines Revenue (undefined), by Country 2025 & 2033
- Figure 60: Asia Pacific Canned Tuna, Salmon amd Sardines Volume (K), by Country 2025 & 2033
- Figure 61: Asia Pacific Canned Tuna, Salmon amd Sardines Revenue Share (%), by Country 2025 & 2033
- Figure 62: Asia Pacific Canned Tuna, Salmon amd Sardines Volume Share (%), by Country 2025 & 2033
List of Tables
- Table 1: Global Canned Tuna, Salmon amd Sardines Revenue undefined Forecast, by Application 2020 & 2033
- Table 2: Global Canned Tuna, Salmon amd Sardines Volume K Forecast, by Application 2020 & 2033
- Table 3: Global Canned Tuna, Salmon amd Sardines Revenue undefined Forecast, by Types 2020 & 2033
- Table 4: Global Canned Tuna, Salmon amd Sardines Volume K Forecast, by Types 2020 & 2033
- Table 5: Global Canned Tuna, Salmon amd Sardines Revenue undefined Forecast, by Region 2020 & 2033
- Table 6: Global Canned Tuna, Salmon amd Sardines Volume K Forecast, by Region 2020 & 2033
- Table 7: Global Canned Tuna, Salmon amd Sardines Revenue undefined Forecast, by Application 2020 & 2033
- Table 8: Global Canned Tuna, Salmon amd Sardines Volume K Forecast, by Application 2020 & 2033
- Table 9: Global Canned Tuna, Salmon amd Sardines Revenue undefined Forecast, by Types 2020 & 2033
- Table 10: Global Canned Tuna, Salmon amd Sardines Volume K Forecast, by Types 2020 & 2033
- Table 11: Global Canned Tuna, Salmon amd Sardines Revenue undefined Forecast, by Country 2020 & 2033
- Table 12: Global Canned Tuna, Salmon amd Sardines Volume K Forecast, by Country 2020 & 2033
- Table 13: United States Canned Tuna, Salmon amd Sardines Revenue (undefined) Forecast, by Application 2020 & 2033
- Table 14: United States Canned Tuna, Salmon amd Sardines Volume (K) Forecast, by Application 2020 & 2033
- Table 15: Canada Canned Tuna, Salmon amd Sardines Revenue (undefined) Forecast, by Application 2020 & 2033
- Table 16: Canada Canned Tuna, Salmon amd Sardines Volume (K) Forecast, by Application 2020 & 2033
- Table 17: Mexico Canned Tuna, Salmon amd Sardines Revenue (undefined) Forecast, by Application 2020 & 2033
- Table 18: Mexico Canned Tuna, Salmon amd Sardines Volume (K) Forecast, by Application 2020 & 2033
- Table 19: Global Canned Tuna, Salmon amd Sardines Revenue undefined Forecast, by Application 2020 & 2033
- Table 20: Global Canned Tuna, Salmon amd Sardines Volume K Forecast, by Application 2020 & 2033
- Table 21: Global Canned Tuna, Salmon amd Sardines Revenue undefined Forecast, by Types 2020 & 2033
- Table 22: Global Canned Tuna, Salmon amd Sardines Volume K Forecast, by Types 2020 & 2033
- Table 23: Global Canned Tuna, Salmon amd Sardines Revenue undefined Forecast, by Country 2020 & 2033
- Table 24: Global Canned Tuna, Salmon amd Sardines Volume K Forecast, by Country 2020 & 2033
- Table 25: Brazil Canned Tuna, Salmon amd Sardines Revenue (undefined) Forecast, by Application 2020 & 2033
- Table 26: Brazil Canned Tuna, Salmon amd Sardines Volume (K) Forecast, by Application 2020 & 2033
- Table 27: Argentina Canned Tuna, Salmon amd Sardines Revenue (undefined) Forecast, by Application 2020 & 2033
- Table 28: Argentina Canned Tuna, Salmon amd Sardines Volume (K) Forecast, by Application 2020 & 2033
- Table 29: Rest of South America Canned Tuna, Salmon amd Sardines Revenue (undefined) Forecast, by Application 2020 & 2033
- Table 30: Rest of South America Canned Tuna, Salmon amd Sardines Volume (K) Forecast, by Application 2020 & 2033
- Table 31: Global Canned Tuna, Salmon amd Sardines Revenue undefined Forecast, by Application 2020 & 2033
- Table 32: Global Canned Tuna, Salmon amd Sardines Volume K Forecast, by Application 2020 & 2033
- Table 33: Global Canned Tuna, Salmon amd Sardines Revenue undefined Forecast, by Types 2020 & 2033
- Table 34: Global Canned Tuna, Salmon amd Sardines Volume K Forecast, by Types 2020 & 2033
- Table 35: Global Canned Tuna, Salmon amd Sardines Revenue undefined Forecast, by Country 2020 & 2033
- Table 36: Global Canned Tuna, Salmon amd Sardines Volume K Forecast, by Country 2020 & 2033
- Table 37: United Kingdom Canned Tuna, Salmon amd Sardines Revenue (undefined) Forecast, by Application 2020 & 2033
- Table 38: United Kingdom Canned Tuna, Salmon amd Sardines Volume (K) Forecast, by Application 2020 & 2033
- Table 39: Germany Canned Tuna, Salmon amd Sardines Revenue (undefined) Forecast, by Application 2020 & 2033
- Table 40: Germany Canned Tuna, Salmon amd Sardines Volume (K) Forecast, by Application 2020 & 2033
- Table 41: France Canned Tuna, Salmon amd Sardines Revenue (undefined) Forecast, by Application 2020 & 2033
- Table 42: France Canned Tuna, Salmon amd Sardines Volume (K) Forecast, by Application 2020 & 2033
- Table 43: Italy Canned Tuna, Salmon amd Sardines Revenue (undefined) Forecast, by Application 2020 & 2033
- Table 44: Italy Canned Tuna, Salmon amd Sardines Volume (K) Forecast, by Application 2020 & 2033
- Table 45: Spain Canned Tuna, Salmon amd Sardines Revenue (undefined) Forecast, by Application 2020 & 2033
- Table 46: Spain Canned Tuna, Salmon amd Sardines Volume (K) Forecast, by Application 2020 & 2033
- Table 47: Russia Canned Tuna, Salmon amd Sardines Revenue (undefined) Forecast, by Application 2020 & 2033
- Table 48: Russia Canned Tuna, Salmon amd Sardines Volume (K) Forecast, by Application 2020 & 2033
- Table 49: Benelux Canned Tuna, Salmon amd Sardines Revenue (undefined) Forecast, by Application 2020 & 2033
- Table 50: Benelux Canned Tuna, Salmon amd Sardines Volume (K) Forecast, by Application 2020 & 2033
- Table 51: Nordics Canned Tuna, Salmon amd Sardines Revenue (undefined) Forecast, by Application 2020 & 2033
- Table 52: Nordics Canned Tuna, Salmon amd Sardines Volume (K) Forecast, by Application 2020 & 2033
- Table 53: Rest of Europe Canned Tuna, Salmon amd Sardines Revenue (undefined) Forecast, by Application 2020 & 2033
- Table 54: Rest of Europe Canned Tuna, Salmon amd Sardines Volume (K) Forecast, by Application 2020 & 2033
- Table 55: Global Canned Tuna, Salmon amd Sardines Revenue undefined Forecast, by Application 2020 & 2033
- Table 56: Global Canned Tuna, Salmon amd Sardines Volume K Forecast, by Application 2020 & 2033
- Table 57: Global Canned Tuna, Salmon amd Sardines Revenue undefined Forecast, by Types 2020 & 2033
- Table 58: Global Canned Tuna, Salmon amd Sardines Volume K Forecast, by Types 2020 & 2033
- Table 59: Global Canned Tuna, Salmon amd Sardines Revenue undefined Forecast, by Country 2020 & 2033
- Table 60: Global Canned Tuna, Salmon amd Sardines Volume K Forecast, by Country 2020 & 2033
- Table 61: Turkey Canned Tuna, Salmon amd Sardines Revenue (undefined) Forecast, by Application 2020 & 2033
- Table 62: Turkey Canned Tuna, Salmon amd Sardines Volume (K) Forecast, by Application 2020 & 2033
- Table 63: Israel Canned Tuna, Salmon amd Sardines Revenue (undefined) Forecast, by Application 2020 & 2033
- Table 64: Israel Canned Tuna, Salmon amd Sardines Volume (K) Forecast, by Application 2020 & 2033
- Table 65: GCC Canned Tuna, Salmon amd Sardines Revenue (undefined) Forecast, by Application 2020 & 2033
- Table 66: GCC Canned Tuna, Salmon amd Sardines Volume (K) Forecast, by Application 2020 & 2033
- Table 67: North Africa Canned Tuna, Salmon amd Sardines Revenue (undefined) Forecast, by Application 2020 & 2033
- Table 68: North Africa Canned Tuna, Salmon amd Sardines Volume (K) Forecast, by Application 2020 & 2033
- Table 69: South Africa Canned Tuna, Salmon amd Sardines Revenue (undefined) Forecast, by Application 2020 & 2033
- Table 70: South Africa Canned Tuna, Salmon amd Sardines Volume (K) Forecast, by Application 2020 & 2033
- Table 71: Rest of Middle East & Africa Canned Tuna, Salmon amd Sardines Revenue (undefined) Forecast, by Application 2020 & 2033
- Table 72: Rest of Middle East & Africa Canned Tuna, Salmon amd Sardines Volume (K) Forecast, by Application 2020 & 2033
- Table 73: Global Canned Tuna, Salmon amd Sardines Revenue undefined Forecast, by Application 2020 & 2033
- Table 74: Global Canned Tuna, Salmon amd Sardines Volume K Forecast, by Application 2020 & 2033
- Table 75: Global Canned Tuna, Salmon amd Sardines Revenue undefined Forecast, by Types 2020 & 2033
- Table 76: Global Canned Tuna, Salmon amd Sardines Volume K Forecast, by Types 2020 & 2033
- Table 77: Global Canned Tuna, Salmon amd Sardines Revenue undefined Forecast, by Country 2020 & 2033
- Table 78: Global Canned Tuna, Salmon amd Sardines Volume K Forecast, by Country 2020 & 2033
- Table 79: China Canned Tuna, Salmon amd Sardines Revenue (undefined) Forecast, by Application 2020 & 2033
- Table 80: China Canned Tuna, Salmon amd Sardines Volume (K) Forecast, by Application 2020 & 2033
- Table 81: India Canned Tuna, Salmon amd Sardines Revenue (undefined) Forecast, by Application 2020 & 2033
- Table 82: India Canned Tuna, Salmon amd Sardines Volume (K) Forecast, by Application 2020 & 2033
- Table 83: Japan Canned Tuna, Salmon amd Sardines Revenue (undefined) Forecast, by Application 2020 & 2033
- Table 84: Japan Canned Tuna, Salmon amd Sardines Volume (K) Forecast, by Application 2020 & 2033
- Table 85: South Korea Canned Tuna, Salmon amd Sardines Revenue (undefined) Forecast, by Application 2020 & 2033
- Table 86: South Korea Canned Tuna, Salmon amd Sardines Volume (K) Forecast, by Application 2020 & 2033
- Table 87: ASEAN Canned Tuna, Salmon amd Sardines Revenue (undefined) Forecast, by Application 2020 & 2033
- Table 88: ASEAN Canned Tuna, Salmon amd Sardines Volume (K) Forecast, by Application 2020 & 2033
- Table 89: Oceania Canned Tuna, Salmon amd Sardines Revenue (undefined) Forecast, by Application 2020 & 2033
- Table 90: Oceania Canned Tuna, Salmon amd Sardines Volume (K) Forecast, by Application 2020 & 2033
- Table 91: Rest of Asia Pacific Canned Tuna, Salmon amd Sardines Revenue (undefined) Forecast, by Application 2020 & 2033
- Table 92: Rest of Asia Pacific Canned Tuna, Salmon amd Sardines Volume (K) Forecast, by Application 2020 & 2033
Frequently Asked Questions
1. What is the projected Compound Annual Growth Rate (CAGR) of the Canned Tuna, Salmon amd Sardines?
The projected CAGR is approximately 3.5%.
2. Which companies are prominent players in the Canned Tuna, Salmon amd Sardines?
Key companies in the market include Dongwon, Bumble Bee Foods, Thai Union Group (TUF), Crown Prince, Inc., Natural Sea, Wild Planet, American Tuna, Century Pacific Food, Frinsa del Noroeste, Hagoromo, Bolton group, Grupo Calvo, Camil Alimentos, Goody, Al Alali.
3. What are the main segments of the Canned Tuna, Salmon amd Sardines?
The market segments include Application, Types.
4. Can you provide details about the market size?
The market size is estimated to be USD XXX N/A as of 2022.
5. What are some drivers contributing to market growth?
N/A
6. What are the notable trends driving market growth?
N/A
7. Are there any restraints impacting market growth?
N/A
8. Can you provide examples of recent developments in the market?
N/A
9. What pricing options are available for accessing the report?
Pricing options include single-user, multi-user, and enterprise licenses priced at USD 3350.00, USD 5025.00, and USD 6700.00 respectively.
10. Is the market size provided in terms of value or volume?
The market size is provided in terms of value, measured in N/A and volume, measured in K.
11. Are there any specific market keywords associated with the report?
Yes, the market keyword associated with the report is "Canned Tuna, Salmon amd Sardines," which aids in identifying and referencing the specific market segment covered.
12. How do I determine which pricing option suits my needs best?
The pricing options vary based on user requirements and access needs. Individual users may opt for single-user licenses, while businesses requiring broader access may choose multi-user or enterprise licenses for cost-effective access to the report.
13. Are there any additional resources or data provided in the Canned Tuna, Salmon amd Sardines report?
While the report offers comprehensive insights, it's advisable to review the specific contents or supplementary materials provided to ascertain if additional resources or data are available.
14. How can I stay updated on further developments or reports in the Canned Tuna, Salmon amd Sardines?
To stay informed about further developments, trends, and reports in the Canned Tuna, Salmon amd Sardines, consider subscribing to industry newsletters, following relevant companies and organizations, or regularly checking reputable industry news sources and publications.
Methodology
Step 1 - Identification of Relevant Samples Size from Population Database


Step 2 - Approaches for Defining Global Market Size (Value, Volume* & Price*)

Note*: In applicable scenarios
Step 3 - Data Sources
Primary Research
- Web Analytics
- Survey Reports
- Research Institute
- Latest Research Reports
- Opinion Leaders
Secondary Research
- Annual Reports
- White Paper
- Latest Press Release
- Industry Association
- Paid Database
- Investor Presentations

Step 4 - Data Triangulation
Involves using different sources of information in order to increase the validity of a study
These sources are likely to be stakeholders in a program - participants, other researchers, program staff, other community members, and so on.
Then we put all data in single framework & apply various statistical tools to find out the dynamic on the market.
During the analysis stage, feedback from the stakeholder groups would be compared to determine areas of agreement as well as areas of divergence