
Key Insights
The global cancer treatment market, a multi-billion dollar industry, is experiencing robust growth, driven by rising cancer incidence rates globally, an aging population, and advancements in treatment modalities. The market's Compound Annual Growth Rate (CAGR) of 6.10% from 2019 to 2024 suggests a continued expansion through 2033. Immunotherapy and targeted therapies are significant growth drivers, increasingly replacing traditional chemotherapy in several cancer types. This shift is fueled by their improved efficacy and reduced side effects, although the high cost of these innovative therapies remains a barrier to wider accessibility, particularly in developing regions. The market is segmented by therapy type (Immunotherapy, Chemotherapy, and Others) and end-user (Hospitals, Clinics, and Others). Major players like Pfizer, Roche, and Bristol-Myers Squibb are at the forefront of innovation and market share, continually investing in R&D to bring novel cancer treatments to the market. Geographic distribution shows strong market presence in North America and Europe, attributable to higher healthcare expenditure and advanced healthcare infrastructure. However, Asia-Pacific is expected to witness significant growth due to rising disposable incomes and increasing awareness of cancer prevention and treatment. The market faces challenges such as regulatory hurdles for new drug approvals, the development of drug resistance, and disparities in access to quality cancer care across different regions. Despite these challenges, the long-term outlook for the cancer treatment market remains positive, spurred by continuous medical advancements and growing global demand.
The competitive landscape is marked by intense R&D activity amongst pharmaceutical giants and smaller biotech companies. Strategic partnerships, mergers, and acquisitions are becoming increasingly common strategies for companies seeking to strengthen their product portfolios and expand their market reach. Furthermore, the increasing focus on personalized medicine—tailoring treatments to an individual's genetic makeup—is expected to further fuel market growth. This personalized approach promises more effective therapies with fewer side effects, driving demand and justifying the higher costs often associated with these treatments. Ultimately, the future of the cancer treatment market lies in continued innovation, accessibility improvements, and a concerted global effort to address the growing burden of cancer worldwide. The market's success hinges on the balance between technological advancements and the equitable distribution of resources to ensure that effective treatments are accessible to all who need them.
Cancer Treatment Market: A Comprehensive Report (2019-2033)
This in-depth report provides a comprehensive analysis of the global Cancer Treatment Market, encompassing market dynamics, growth trends, regional insights, and key player strategies. With a focus on the parent market and its child segments – including Immunotherapy, Chemotherapy, and Others therapies, and Hospitals, Clinics, and Others end-users – this report offers invaluable insights for industry professionals, investors, and strategic decision-makers. The report covers the historical period (2019-2024), base year (2025), and forecast period (2025-2033), providing a robust understanding of market evolution and future potential. The market size is projected to reach XX Million by 2033.
Cancer Treatment Market Market Dynamics & Structure
The Cancer Treatment Market is characterized by high market concentration among established pharmaceutical giants and a dynamic landscape shaped by continuous technological innovation. The market is driven by the increasing prevalence of cancer globally, coupled with advancements in targeted therapies and immunotherapies. Regulatory frameworks, including FDA approvals and global licensing agreements, significantly influence market access and growth. The market witnesses frequent M&A activities, with larger companies acquiring smaller biotech firms to bolster their pipelines. Competitive pressures stem from the development of biosimilars and generic drugs. The rise of personalized medicine and advancements in diagnostic tools further shape the market landscape.
- Market Concentration: High, with top 10 players holding xx% market share in 2024.
- Technological Innovation: Strong focus on targeted therapies, immunotherapy, and personalized medicine.
- Regulatory Frameworks: Stringent approval processes influence market entry and pricing.
- Competitive Product Substitutes: Biosimilars and generic drugs pose increasing competitive pressure.
- End-User Demographics: Aging population and rising cancer incidence contribute to market growth.
- M&A Trends: Significant increase in M&A activity, with xx major deals recorded between 2019-2024.
Cancer Treatment Market Growth Trends & Insights
The global cancer treatment market is exhibiting robust growth, driven by a confluence of factors. The increasing prevalence of various cancer types across the globe, coupled with rising healthcare expenditure and improved diagnostic capabilities, are key drivers. Technological advancements, particularly in immunotherapy and targeted therapies, have revolutionized cancer treatment, leading to improved patient outcomes and market expansion. The shift towards personalized medicine and the adoption of advanced technologies like big data analytics are further accelerating market growth. The market is experiencing substantial growth in adoption rates of newer treatment modalities, resulting in a significant Compound Annual Growth Rate (CAGR) of xx% during the forecast period (2025-2033). Market penetration of innovative therapies is projected to reach xx% by 2033. Consumer behavior is shifting towards more proactive health management and a preference for minimally invasive treatment options.
Dominant Regions, Countries, or Segments in Cancer Treatment Market
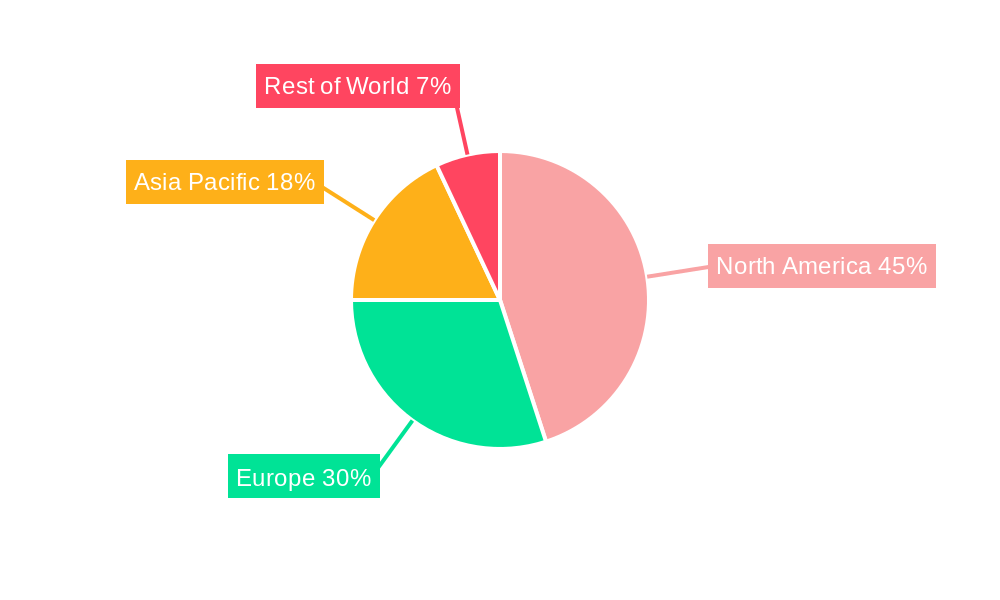
North America currently dominates the Cancer Treatment Market, driven by high healthcare expenditure, advanced healthcare infrastructure, and a substantial patient pool. Within therapy segments, Immunotherapy is witnessing the fastest growth, owing to its superior efficacy and expanding applications across various cancer types. Hospitals constitute the largest end-user segment due to their advanced treatment capabilities and comprehensive infrastructure.
- Key Drivers in North America: High healthcare expenditure, advanced infrastructure, robust research & development.
- Immunotherapy Dominance: Superior efficacy and expanding applications fuel market growth.
- Hospital Segment: Largest end-user segment due to advanced facilities and expertise.
- Growth Potential: Emerging markets in Asia-Pacific and Latin America present significant untapped potential.
Cancer Treatment Market Product Landscape
The cancer treatment market showcases a diverse product landscape, encompassing a range of innovative therapies, including targeted therapies, immunotherapies, chemotherapies, and supportive care medications. These products are differentiated by their mechanisms of action, efficacy, safety profiles, and administration routes. Recent technological advancements have led to the development of more targeted and personalized therapies, improving treatment outcomes while reducing side effects. The market also sees increasing adoption of combination therapies, leveraging the synergistic effects of different treatment modalities.
Key Drivers, Barriers & Challenges in Cancer Treatment Market
Key Drivers:
- Rising cancer incidence and prevalence globally.
- Technological advancements in targeted therapies and immunotherapies.
- Increasing healthcare expenditure and insurance coverage.
- Growing awareness and patient advocacy.
Challenges:
- High cost of innovative cancer therapies, limiting accessibility.
- Stringent regulatory approvals and lengthy clinical trial processes.
- Development of drug resistance and treatment limitations.
- Supply chain disruptions and manufacturing constraints. (Impact estimated at xx million in lost revenue in 2024)
Emerging Opportunities in Cancer Treatment Market
- Expansion into emerging markets with rising cancer prevalence.
- Development of novel targeted therapies and immunotherapies.
- Personalized medicine approaches based on genomic profiling.
- Focus on improving patient adherence and quality of life.
Growth Accelerators in the Cancer Treatment Market Industry
The Cancer Treatment Market is poised for sustained growth, propelled by significant technological breakthroughs in immunotherapy and targeted therapies. Strategic partnerships between pharmaceutical companies and biotech firms are accelerating the development and commercialization of innovative cancer treatments. Expansion into untapped markets, particularly in developing countries, presents a significant opportunity for market growth. The adoption of digital health technologies and data analytics further enhances treatment efficiency and patient outcomes, contributing to market expansion.
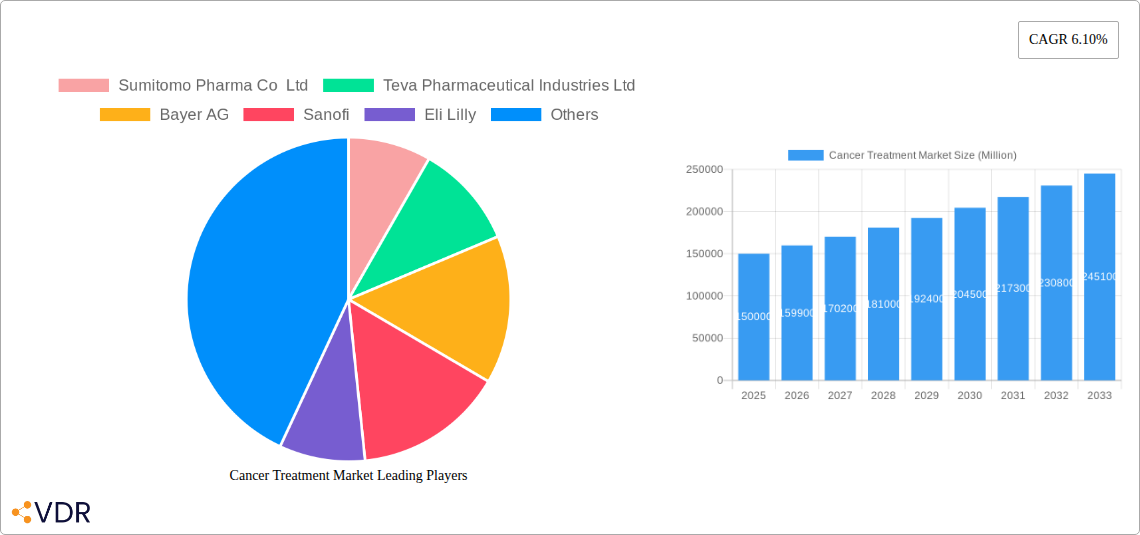
Key Players Shaping the Cancer Treatment Market Market
- Sumitomo Pharma Co Ltd
- Teva Pharmaceutical Industries Ltd
- Bayer AG
- Sanofi
- Eli Lilly
- Amgen Inc
- F Hoffmann-La Roche Ltd
- TAIHO PHARMACEUTICAL CO LTD
- Takeda Pharmaceutical Company Limited
- Celleron Therapeutics
- Bristol-Myers Squibb Company
- Pfizer Inc
Notable Milestones in Cancer Treatment Market Sector
- April 2022: FDA approval of Alymsys (bevacizumab-maly), a biosimilar for bevacizumab, expanding treatment options for various cancers.
- March 2022: Chugai Pharmaceutical receives regulatory approval for Perjeta and Herceptin for treating HER2-positive colon and rectal cancer, expanding treatment indications.
In-Depth Cancer Treatment Market Market Outlook
The Cancer Treatment Market is poised for significant growth in the coming years, driven by continuous technological advancements, the increasing prevalence of cancer globally, and expanding healthcare expenditure. Strategic opportunities exist in developing innovative therapies, personalized medicine approaches, and expanding into emerging markets. The market will likely experience consolidation through mergers and acquisitions, further driving innovation and market leadership. The long-term outlook for the Cancer Treatment Market remains exceptionally positive.
Cancer Treatment Market Segmentation
-
1. Therapy
- 1.1. Immunotherapy
- 1.2. Chemotherapy
- 1.3. Others
-
2. End User
- 2.1. Hospitals
- 2.2. Clinics
- 2.3. Others
Cancer Treatment Market Segmentation By Geography
-
1. North America
- 1.1. United States
- 1.2. Canada
- 1.3. Mexico
-
2. Europe
- 2.1. Germany
- 2.2. United Kingdom
- 2.3. France
- 2.4. Italy
- 2.5. Spain
- 2.6. Rest of Europe
-
3. Asia Pacific
- 3.1. China
- 3.2. Japan
- 3.3. India
- 3.4. Australia
- 3.5. South Korea
- 3.6. Rest of Asia Pacific
- 4. Middle East
-
5. GCC
- 5.1. South Africa
- 5.2. Rest of Middle East
-
6. South America
- 6.1. Brazil
- 6.2. Argentina
- 6.3. Rest of South America
Cancer Treatment Market REPORT HIGHLIGHTS
| Aspects | Details |
|---|---|
| Study Period | 2019-2033 |
| Base Year | 2024 |
| Estimated Year | 2025 |
| Forecast Period | 2025-2033 |
| Historical Period | 2019-2024 |
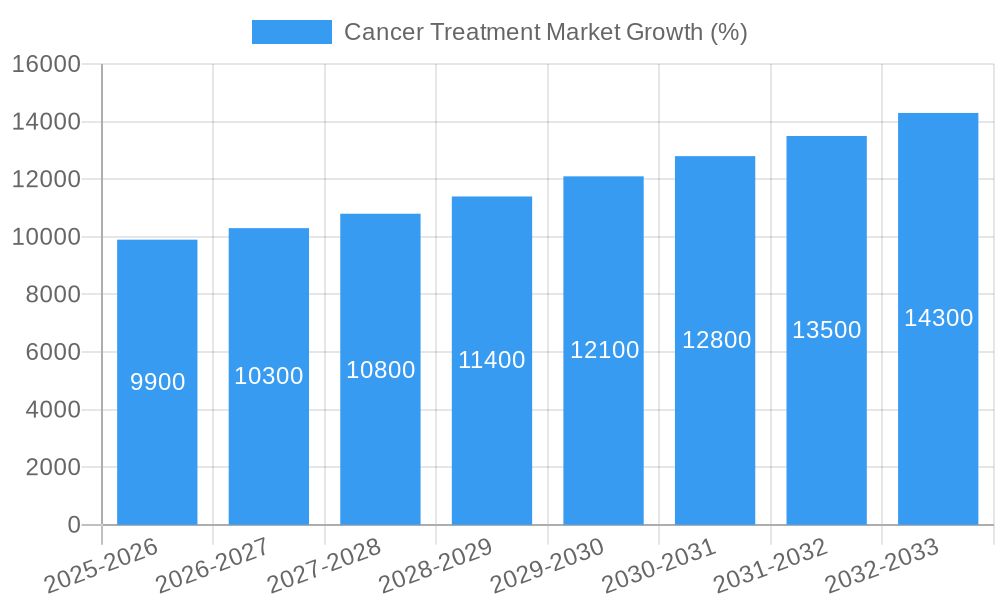
| Growth Rate | CAGR of 6.10% from 2019-2033 |
| Segmentation |
|
Table of Contents
- 1. Introduction
- 1.1. Research Scope
- 1.2. Market Segmentation
- 1.3. Research Methodology
- 1.4. Definitions and Assumptions
- 2. Executive Summary
- 2.1. Introduction
- 3. Market Dynamics
- 3.1. Introduction
- 3.2. Market Drivers
- 3.2.1. Increasing Incidence and Prevalence of Colorectal Cancer; Technological Advancements in Radiology and Chemotherapy
- 3.3. Market Restrains
- 3.3.1. High Costs and the Side Effects Associated with Drugs
- 3.4. Market Trends
- 3.4.1. Chemotherapy is Expected to Hold a Significant Market Share Over the Forecast Period
- 4. Market Factor Analysis
- 4.1. Porters Five Forces
- 4.2. Supply/Value Chain
- 4.3. PESTEL analysis
- 4.4. Market Entropy
- 4.5. Patent/Trademark Analysis
- 5. Global Cancer Treatment Market Analysis, Insights and Forecast, 2019-2031
- 5.1. Market Analysis, Insights and Forecast - by Therapy
- 5.1.1. Immunotherapy
- 5.1.2. Chemotherapy
- 5.1.3. Others
- 5.2. Market Analysis, Insights and Forecast - by End User
- 5.2.1. Hospitals
- 5.2.2. Clinics
- 5.2.3. Others
- 5.3. Market Analysis, Insights and Forecast - by Region
- 5.3.1. North America
- 5.3.2. Europe
- 5.3.3. Asia Pacific
- 5.3.4. Middle East
- 5.3.5. GCC
- 5.3.6. South America
- 5.1. Market Analysis, Insights and Forecast - by Therapy
- 6. North America Cancer Treatment Market Analysis, Insights and Forecast, 2019-2031
- 6.1. Market Analysis, Insights and Forecast - by Therapy
- 6.1.1. Immunotherapy
- 6.1.2. Chemotherapy
- 6.1.3. Others
- 6.2. Market Analysis, Insights and Forecast - by End User
- 6.2.1. Hospitals
- 6.2.2. Clinics
- 6.2.3. Others
- 6.1. Market Analysis, Insights and Forecast - by Therapy
- 7. Europe Cancer Treatment Market Analysis, Insights and Forecast, 2019-2031
- 7.1. Market Analysis, Insights and Forecast - by Therapy
- 7.1.1. Immunotherapy
- 7.1.2. Chemotherapy
- 7.1.3. Others
- 7.2. Market Analysis, Insights and Forecast - by End User
- 7.2.1. Hospitals
- 7.2.2. Clinics
- 7.2.3. Others
- 7.1. Market Analysis, Insights and Forecast - by Therapy
- 8. Asia Pacific Cancer Treatment Market Analysis, Insights and Forecast, 2019-2031
- 8.1. Market Analysis, Insights and Forecast - by Therapy
- 8.1.1. Immunotherapy
- 8.1.2. Chemotherapy
- 8.1.3. Others
- 8.2. Market Analysis, Insights and Forecast - by End User
- 8.2.1. Hospitals
- 8.2.2. Clinics
- 8.2.3. Others
- 8.1. Market Analysis, Insights and Forecast - by Therapy
- 9. Middle East Cancer Treatment Market Analysis, Insights and Forecast, 2019-2031
- 9.1. Market Analysis, Insights and Forecast - by Therapy
- 9.1.1. Immunotherapy
- 9.1.2. Chemotherapy
- 9.1.3. Others
- 9.2. Market Analysis, Insights and Forecast - by End User
- 9.2.1. Hospitals
- 9.2.2. Clinics
- 9.2.3. Others
- 9.1. Market Analysis, Insights and Forecast - by Therapy
- 10. GCC Cancer Treatment Market Analysis, Insights and Forecast, 2019-2031
- 10.1. Market Analysis, Insights and Forecast - by Therapy
- 10.1.1. Immunotherapy
- 10.1.2. Chemotherapy
- 10.1.3. Others
- 10.2. Market Analysis, Insights and Forecast - by End User
- 10.2.1. Hospitals
- 10.2.2. Clinics
- 10.2.3. Others
- 10.1. Market Analysis, Insights and Forecast - by Therapy
- 11. South America Cancer Treatment Market Analysis, Insights and Forecast, 2019-2031
- 11.1. Market Analysis, Insights and Forecast - by Therapy
- 11.1.1. Immunotherapy
- 11.1.2. Chemotherapy
- 11.1.3. Others
- 11.2. Market Analysis, Insights and Forecast - by End User
- 11.2.1. Hospitals
- 11.2.2. Clinics
- 11.2.3. Others
- 11.1. Market Analysis, Insights and Forecast - by Therapy
- 12. North America Cancer Treatment Market Analysis, Insights and Forecast, 2019-2031
- 12.1. Market Analysis, Insights and Forecast - By Country/Sub-region
- 12.1.1 United States
- 12.1.2 Canada
- 12.1.3 Mexico
- 13. Europe Cancer Treatment Market Analysis, Insights and Forecast, 2019-2031
- 13.1. Market Analysis, Insights and Forecast - By Country/Sub-region
- 13.1.1 Germany
- 13.1.2 United Kingdom
- 13.1.3 France
- 13.1.4 Italy
- 13.1.5 Spain
- 13.1.6 Rest of Europe
- 14. Asia Pacific Cancer Treatment Market Analysis, Insights and Forecast, 2019-2031
- 14.1. Market Analysis, Insights and Forecast - By Country/Sub-region
- 14.1.1 China
- 14.1.2 Japan
- 14.1.3 India
- 14.1.4 Australia
- 14.1.5 South Korea
- 14.1.6 Rest of Asia Pacific
- 15. Middle East Cancer Treatment Market Analysis, Insights and Forecast, 2019-2031
- 15.1. Market Analysis, Insights and Forecast - By Country/Sub-region
- 15.1.1.
- 16. GCC Cancer Treatment Market Analysis, Insights and Forecast, 2019-2031
- 16.1. Market Analysis, Insights and Forecast - By Country/Sub-region
- 16.1.1 South Africa
- 16.1.2 Rest of Middle East
- 17. South America Cancer Treatment Market Analysis, Insights and Forecast, 2019-2031
- 17.1. Market Analysis, Insights and Forecast - By Country/Sub-region
- 17.1.1 Brazil
- 17.1.2 Argentina
- 17.1.3 Rest of South America
- 18. Competitive Analysis
- 18.1. Global Market Share Analysis 2024
- 18.2. Company Profiles
- 18.2.1 Sumitomo Pharma Co Ltd
- 18.2.1.1. Overview
- 18.2.1.2. Products
- 18.2.1.3. SWOT Analysis
- 18.2.1.4. Recent Developments
- 18.2.1.5. Financials (Based on Availability)
- 18.2.2 Teva Pharmaceutical Industries Ltd
- 18.2.2.1. Overview
- 18.2.2.2. Products
- 18.2.2.3. SWOT Analysis
- 18.2.2.4. Recent Developments
- 18.2.2.5. Financials (Based on Availability)
- 18.2.3 Bayer AG
- 18.2.3.1. Overview
- 18.2.3.2. Products
- 18.2.3.3. SWOT Analysis
- 18.2.3.4. Recent Developments
- 18.2.3.5. Financials (Based on Availability)
- 18.2.4 Sanofi
- 18.2.4.1. Overview
- 18.2.4.2. Products
- 18.2.4.3. SWOT Analysis
- 18.2.4.4. Recent Developments
- 18.2.4.5. Financials (Based on Availability)
- 18.2.5 Eli Lilly
- 18.2.5.1. Overview
- 18.2.5.2. Products
- 18.2.5.3. SWOT Analysis
- 18.2.5.4. Recent Developments
- 18.2.5.5. Financials (Based on Availability)
- 18.2.6 Amgen Inc
- 18.2.6.1. Overview
- 18.2.6.2. Products
- 18.2.6.3. SWOT Analysis
- 18.2.6.4. Recent Developments
- 18.2.6.5. Financials (Based on Availability)
- 18.2.7 F Hoffmann-La Roche Ltd
- 18.2.7.1. Overview
- 18.2.7.2. Products
- 18.2.7.3. SWOT Analysis
- 18.2.7.4. Recent Developments
- 18.2.7.5. Financials (Based on Availability)
- 18.2.8 TAIHO PHARMACEUTICAL CO LTD
- 18.2.8.1. Overview
- 18.2.8.2. Products
- 18.2.8.3. SWOT Analysis
- 18.2.8.4. Recent Developments
- 18.2.8.5. Financials (Based on Availability)
- 18.2.9 Takeda Pharmaceutical Company Limited
- 18.2.9.1. Overview
- 18.2.9.2. Products
- 18.2.9.3. SWOT Analysis
- 18.2.9.4. Recent Developments
- 18.2.9.5. Financials (Based on Availability)
- 18.2.10 Celleron Therapeutics
- 18.2.10.1. Overview
- 18.2.10.2. Products
- 18.2.10.3. SWOT Analysis
- 18.2.10.4. Recent Developments
- 18.2.10.5. Financials (Based on Availability)
- 18.2.11 Bristol-Myers Squibb Company
- 18.2.11.1. Overview
- 18.2.11.2. Products
- 18.2.11.3. SWOT Analysis
- 18.2.11.4. Recent Developments
- 18.2.11.5. Financials (Based on Availability)
- 18.2.12 Pfizer Inc
- 18.2.12.1. Overview
- 18.2.12.2. Products
- 18.2.12.3. SWOT Analysis
- 18.2.12.4. Recent Developments
- 18.2.12.5. Financials (Based on Availability)
- 18.2.1 Sumitomo Pharma Co Ltd
List of Figures
- Figure 1: Global Cancer Treatment Market Revenue Breakdown (Million, %) by Region 2024 & 2032
- Figure 2: Global Cancer Treatment Market Volume Breakdown (K Unit, %) by Region 2024 & 2032
- Figure 3: North America Cancer Treatment Market Revenue (Million), by Country 2024 & 2032
- Figure 4: North America Cancer Treatment Market Volume (K Unit), by Country 2024 & 2032
- Figure 5: North America Cancer Treatment Market Revenue Share (%), by Country 2024 & 2032
- Figure 6: North America Cancer Treatment Market Volume Share (%), by Country 2024 & 2032
- Figure 7: Europe Cancer Treatment Market Revenue (Million), by Country 2024 & 2032
- Figure 8: Europe Cancer Treatment Market Volume (K Unit), by Country 2024 & 2032
- Figure 9: Europe Cancer Treatment Market Revenue Share (%), by Country 2024 & 2032
- Figure 10: Europe Cancer Treatment Market Volume Share (%), by Country 2024 & 2032
- Figure 11: Asia Pacific Cancer Treatment Market Revenue (Million), by Country 2024 & 2032
- Figure 12: Asia Pacific Cancer Treatment Market Volume (K Unit), by Country 2024 & 2032
- Figure 13: Asia Pacific Cancer Treatment Market Revenue Share (%), by Country 2024 & 2032
- Figure 14: Asia Pacific Cancer Treatment Market Volume Share (%), by Country 2024 & 2032
- Figure 15: Middle East Cancer Treatment Market Revenue (Million), by Country 2024 & 2032
- Figure 16: Middle East Cancer Treatment Market Volume (K Unit), by Country 2024 & 2032
- Figure 17: Middle East Cancer Treatment Market Revenue Share (%), by Country 2024 & 2032
- Figure 18: Middle East Cancer Treatment Market Volume Share (%), by Country 2024 & 2032
- Figure 19: GCC Cancer Treatment Market Revenue (Million), by Country 2024 & 2032
- Figure 20: GCC Cancer Treatment Market Volume (K Unit), by Country 2024 & 2032
- Figure 21: GCC Cancer Treatment Market Revenue Share (%), by Country 2024 & 2032
- Figure 22: GCC Cancer Treatment Market Volume Share (%), by Country 2024 & 2032
- Figure 23: South America Cancer Treatment Market Revenue (Million), by Country 2024 & 2032
- Figure 24: South America Cancer Treatment Market Volume (K Unit), by Country 2024 & 2032
- Figure 25: South America Cancer Treatment Market Revenue Share (%), by Country 2024 & 2032
- Figure 26: South America Cancer Treatment Market Volume Share (%), by Country 2024 & 2032
- Figure 27: North America Cancer Treatment Market Revenue (Million), by Therapy 2024 & 2032
- Figure 28: North America Cancer Treatment Market Volume (K Unit), by Therapy 2024 & 2032
- Figure 29: North America Cancer Treatment Market Revenue Share (%), by Therapy 2024 & 2032
- Figure 30: North America Cancer Treatment Market Volume Share (%), by Therapy 2024 & 2032
- Figure 31: North America Cancer Treatment Market Revenue (Million), by End User 2024 & 2032
- Figure 32: North America Cancer Treatment Market Volume (K Unit), by End User 2024 & 2032
- Figure 33: North America Cancer Treatment Market Revenue Share (%), by End User 2024 & 2032
- Figure 34: North America Cancer Treatment Market Volume Share (%), by End User 2024 & 2032
- Figure 35: North America Cancer Treatment Market Revenue (Million), by Country 2024 & 2032
- Figure 36: North America Cancer Treatment Market Volume (K Unit), by Country 2024 & 2032
- Figure 37: North America Cancer Treatment Market Revenue Share (%), by Country 2024 & 2032
- Figure 38: North America Cancer Treatment Market Volume Share (%), by Country 2024 & 2032
- Figure 39: Europe Cancer Treatment Market Revenue (Million), by Therapy 2024 & 2032
- Figure 40: Europe Cancer Treatment Market Volume (K Unit), by Therapy 2024 & 2032
- Figure 41: Europe Cancer Treatment Market Revenue Share (%), by Therapy 2024 & 2032
- Figure 42: Europe Cancer Treatment Market Volume Share (%), by Therapy 2024 & 2032
- Figure 43: Europe Cancer Treatment Market Revenue (Million), by End User 2024 & 2032
- Figure 44: Europe Cancer Treatment Market Volume (K Unit), by End User 2024 & 2032
- Figure 45: Europe Cancer Treatment Market Revenue Share (%), by End User 2024 & 2032
- Figure 46: Europe Cancer Treatment Market Volume Share (%), by End User 2024 & 2032
- Figure 47: Europe Cancer Treatment Market Revenue (Million), by Country 2024 & 2032
- Figure 48: Europe Cancer Treatment Market Volume (K Unit), by Country 2024 & 2032
- Figure 49: Europe Cancer Treatment Market Revenue Share (%), by Country 2024 & 2032
- Figure 50: Europe Cancer Treatment Market Volume Share (%), by Country 2024 & 2032
- Figure 51: Asia Pacific Cancer Treatment Market Revenue (Million), by Therapy 2024 & 2032
- Figure 52: Asia Pacific Cancer Treatment Market Volume (K Unit), by Therapy 2024 & 2032
- Figure 53: Asia Pacific Cancer Treatment Market Revenue Share (%), by Therapy 2024 & 2032
- Figure 54: Asia Pacific Cancer Treatment Market Volume Share (%), by Therapy 2024 & 2032
- Figure 55: Asia Pacific Cancer Treatment Market Revenue (Million), by End User 2024 & 2032
- Figure 56: Asia Pacific Cancer Treatment Market Volume (K Unit), by End User 2024 & 2032
- Figure 57: Asia Pacific Cancer Treatment Market Revenue Share (%), by End User 2024 & 2032
- Figure 58: Asia Pacific Cancer Treatment Market Volume Share (%), by End User 2024 & 2032
- Figure 59: Asia Pacific Cancer Treatment Market Revenue (Million), by Country 2024 & 2032
- Figure 60: Asia Pacific Cancer Treatment Market Volume (K Unit), by Country 2024 & 2032
- Figure 61: Asia Pacific Cancer Treatment Market Revenue Share (%), by Country 2024 & 2032
- Figure 62: Asia Pacific Cancer Treatment Market Volume Share (%), by Country 2024 & 2032
- Figure 63: Middle East Cancer Treatment Market Revenue (Million), by Therapy 2024 & 2032
- Figure 64: Middle East Cancer Treatment Market Volume (K Unit), by Therapy 2024 & 2032
- Figure 65: Middle East Cancer Treatment Market Revenue Share (%), by Therapy 2024 & 2032
- Figure 66: Middle East Cancer Treatment Market Volume Share (%), by Therapy 2024 & 2032
- Figure 67: Middle East Cancer Treatment Market Revenue (Million), by End User 2024 & 2032
- Figure 68: Middle East Cancer Treatment Market Volume (K Unit), by End User 2024 & 2032
- Figure 69: Middle East Cancer Treatment Market Revenue Share (%), by End User 2024 & 2032
- Figure 70: Middle East Cancer Treatment Market Volume Share (%), by End User 2024 & 2032
- Figure 71: Middle East Cancer Treatment Market Revenue (Million), by Country 2024 & 2032
- Figure 72: Middle East Cancer Treatment Market Volume (K Unit), by Country 2024 & 2032
- Figure 73: Middle East Cancer Treatment Market Revenue Share (%), by Country 2024 & 2032
- Figure 74: Middle East Cancer Treatment Market Volume Share (%), by Country 2024 & 2032
- Figure 75: GCC Cancer Treatment Market Revenue (Million), by Therapy 2024 & 2032
- Figure 76: GCC Cancer Treatment Market Volume (K Unit), by Therapy 2024 & 2032
- Figure 77: GCC Cancer Treatment Market Revenue Share (%), by Therapy 2024 & 2032
- Figure 78: GCC Cancer Treatment Market Volume Share (%), by Therapy 2024 & 2032
- Figure 79: GCC Cancer Treatment Market Revenue (Million), by End User 2024 & 2032
- Figure 80: GCC Cancer Treatment Market Volume (K Unit), by End User 2024 & 2032
- Figure 81: GCC Cancer Treatment Market Revenue Share (%), by End User 2024 & 2032
- Figure 82: GCC Cancer Treatment Market Volume Share (%), by End User 2024 & 2032
- Figure 83: GCC Cancer Treatment Market Revenue (Million), by Country 2024 & 2032
- Figure 84: GCC Cancer Treatment Market Volume (K Unit), by Country 2024 & 2032
- Figure 85: GCC Cancer Treatment Market Revenue Share (%), by Country 2024 & 2032
- Figure 86: GCC Cancer Treatment Market Volume Share (%), by Country 2024 & 2032
- Figure 87: South America Cancer Treatment Market Revenue (Million), by Therapy 2024 & 2032
- Figure 88: South America Cancer Treatment Market Volume (K Unit), by Therapy 2024 & 2032
- Figure 89: South America Cancer Treatment Market Revenue Share (%), by Therapy 2024 & 2032
- Figure 90: South America Cancer Treatment Market Volume Share (%), by Therapy 2024 & 2032
- Figure 91: South America Cancer Treatment Market Revenue (Million), by End User 2024 & 2032
- Figure 92: South America Cancer Treatment Market Volume (K Unit), by End User 2024 & 2032
- Figure 93: South America Cancer Treatment Market Revenue Share (%), by End User 2024 & 2032
- Figure 94: South America Cancer Treatment Market Volume Share (%), by End User 2024 & 2032
- Figure 95: South America Cancer Treatment Market Revenue (Million), by Country 2024 & 2032
- Figure 96: South America Cancer Treatment Market Volume (K Unit), by Country 2024 & 2032
- Figure 97: South America Cancer Treatment Market Revenue Share (%), by Country 2024 & 2032
- Figure 98: South America Cancer Treatment Market Volume Share (%), by Country 2024 & 2032
List of Tables
- Table 1: Global Cancer Treatment Market Revenue Million Forecast, by Region 2019 & 2032
- Table 2: Global Cancer Treatment Market Volume K Unit Forecast, by Region 2019 & 2032
- Table 3: Global Cancer Treatment Market Revenue Million Forecast, by Therapy 2019 & 2032
- Table 4: Global Cancer Treatment Market Volume K Unit Forecast, by Therapy 2019 & 2032
- Table 5: Global Cancer Treatment Market Revenue Million Forecast, by End User 2019 & 2032
- Table 6: Global Cancer Treatment Market Volume K Unit Forecast, by End User 2019 & 2032
- Table 7: Global Cancer Treatment Market Revenue Million Forecast, by Region 2019 & 2032
- Table 8: Global Cancer Treatment Market Volume K Unit Forecast, by Region 2019 & 2032
- Table 9: Global Cancer Treatment Market Revenue Million Forecast, by Country 2019 & 2032
- Table 10: Global Cancer Treatment Market Volume K Unit Forecast, by Country 2019 & 2032
- Table 11: United States Cancer Treatment Market Revenue (Million) Forecast, by Application 2019 & 2032
- Table 12: United States Cancer Treatment Market Volume (K Unit) Forecast, by Application 2019 & 2032
- Table 13: Canada Cancer Treatment Market Revenue (Million) Forecast, by Application 2019 & 2032
- Table 14: Canada Cancer Treatment Market Volume (K Unit) Forecast, by Application 2019 & 2032
- Table 15: Mexico Cancer Treatment Market Revenue (Million) Forecast, by Application 2019 & 2032
- Table 16: Mexico Cancer Treatment Market Volume (K Unit) Forecast, by Application 2019 & 2032
- Table 17: Global Cancer Treatment Market Revenue Million Forecast, by Country 2019 & 2032
- Table 18: Global Cancer Treatment Market Volume K Unit Forecast, by Country 2019 & 2032
- Table 19: Germany Cancer Treatment Market Revenue (Million) Forecast, by Application 2019 & 2032
- Table 20: Germany Cancer Treatment Market Volume (K Unit) Forecast, by Application 2019 & 2032
- Table 21: United Kingdom Cancer Treatment Market Revenue (Million) Forecast, by Application 2019 & 2032
- Table 22: United Kingdom Cancer Treatment Market Volume (K Unit) Forecast, by Application 2019 & 2032
- Table 23: France Cancer Treatment Market Revenue (Million) Forecast, by Application 2019 & 2032
- Table 24: France Cancer Treatment Market Volume (K Unit) Forecast, by Application 2019 & 2032
- Table 25: Italy Cancer Treatment Market Revenue (Million) Forecast, by Application 2019 & 2032
- Table 26: Italy Cancer Treatment Market Volume (K Unit) Forecast, by Application 2019 & 2032
- Table 27: Spain Cancer Treatment Market Revenue (Million) Forecast, by Application 2019 & 2032
- Table 28: Spain Cancer Treatment Market Volume (K Unit) Forecast, by Application 2019 & 2032
- Table 29: Rest of Europe Cancer Treatment Market Revenue (Million) Forecast, by Application 2019 & 2032
- Table 30: Rest of Europe Cancer Treatment Market Volume (K Unit) Forecast, by Application 2019 & 2032
- Table 31: Global Cancer Treatment Market Revenue Million Forecast, by Country 2019 & 2032
- Table 32: Global Cancer Treatment Market Volume K Unit Forecast, by Country 2019 & 2032
- Table 33: China Cancer Treatment Market Revenue (Million) Forecast, by Application 2019 & 2032
- Table 34: China Cancer Treatment Market Volume (K Unit) Forecast, by Application 2019 & 2032
- Table 35: Japan Cancer Treatment Market Revenue (Million) Forecast, by Application 2019 & 2032
- Table 36: Japan Cancer Treatment Market Volume (K Unit) Forecast, by Application 2019 & 2032
- Table 37: India Cancer Treatment Market Revenue (Million) Forecast, by Application 2019 & 2032
- Table 38: India Cancer Treatment Market Volume (K Unit) Forecast, by Application 2019 & 2032
- Table 39: Australia Cancer Treatment Market Revenue (Million) Forecast, by Application 2019 & 2032
- Table 40: Australia Cancer Treatment Market Volume (K Unit) Forecast, by Application 2019 & 2032
- Table 41: South Korea Cancer Treatment Market Revenue (Million) Forecast, by Application 2019 & 2032
- Table 42: South Korea Cancer Treatment Market Volume (K Unit) Forecast, by Application 2019 & 2032
- Table 43: Rest of Asia Pacific Cancer Treatment Market Revenue (Million) Forecast, by Application 2019 & 2032
- Table 44: Rest of Asia Pacific Cancer Treatment Market Volume (K Unit) Forecast, by Application 2019 & 2032
- Table 45: Global Cancer Treatment Market Revenue Million Forecast, by Country 2019 & 2032
- Table 46: Global Cancer Treatment Market Volume K Unit Forecast, by Country 2019 & 2032
- Table 47: Cancer Treatment Market Revenue (Million) Forecast, by Application 2019 & 2032
- Table 48: Cancer Treatment Market Volume (K Unit) Forecast, by Application 2019 & 2032
- Table 49: Global Cancer Treatment Market Revenue Million Forecast, by Country 2019 & 2032
- Table 50: Global Cancer Treatment Market Volume K Unit Forecast, by Country 2019 & 2032
- Table 51: South Africa Cancer Treatment Market Revenue (Million) Forecast, by Application 2019 & 2032
- Table 52: South Africa Cancer Treatment Market Volume (K Unit) Forecast, by Application 2019 & 2032
- Table 53: Rest of Middle East Cancer Treatment Market Revenue (Million) Forecast, by Application 2019 & 2032
- Table 54: Rest of Middle East Cancer Treatment Market Volume (K Unit) Forecast, by Application 2019 & 2032
- Table 55: Global Cancer Treatment Market Revenue Million Forecast, by Country 2019 & 2032
- Table 56: Global Cancer Treatment Market Volume K Unit Forecast, by Country 2019 & 2032
- Table 57: Brazil Cancer Treatment Market Revenue (Million) Forecast, by Application 2019 & 2032
- Table 58: Brazil Cancer Treatment Market Volume (K Unit) Forecast, by Application 2019 & 2032
- Table 59: Argentina Cancer Treatment Market Revenue (Million) Forecast, by Application 2019 & 2032
- Table 60: Argentina Cancer Treatment Market Volume (K Unit) Forecast, by Application 2019 & 2032
- Table 61: Rest of South America Cancer Treatment Market Revenue (Million) Forecast, by Application 2019 & 2032
- Table 62: Rest of South America Cancer Treatment Market Volume (K Unit) Forecast, by Application 2019 & 2032
- Table 63: Global Cancer Treatment Market Revenue Million Forecast, by Therapy 2019 & 2032
- Table 64: Global Cancer Treatment Market Volume K Unit Forecast, by Therapy 2019 & 2032
- Table 65: Global Cancer Treatment Market Revenue Million Forecast, by End User 2019 & 2032
- Table 66: Global Cancer Treatment Market Volume K Unit Forecast, by End User 2019 & 2032
- Table 67: Global Cancer Treatment Market Revenue Million Forecast, by Country 2019 & 2032
- Table 68: Global Cancer Treatment Market Volume K Unit Forecast, by Country 2019 & 2032
- Table 69: United States Cancer Treatment Market Revenue (Million) Forecast, by Application 2019 & 2032
- Table 70: United States Cancer Treatment Market Volume (K Unit) Forecast, by Application 2019 & 2032
- Table 71: Canada Cancer Treatment Market Revenue (Million) Forecast, by Application 2019 & 2032
- Table 72: Canada Cancer Treatment Market Volume (K Unit) Forecast, by Application 2019 & 2032
- Table 73: Mexico Cancer Treatment Market Revenue (Million) Forecast, by Application 2019 & 2032
- Table 74: Mexico Cancer Treatment Market Volume (K Unit) Forecast, by Application 2019 & 2032
- Table 75: Global Cancer Treatment Market Revenue Million Forecast, by Therapy 2019 & 2032
- Table 76: Global Cancer Treatment Market Volume K Unit Forecast, by Therapy 2019 & 2032
- Table 77: Global Cancer Treatment Market Revenue Million Forecast, by End User 2019 & 2032
- Table 78: Global Cancer Treatment Market Volume K Unit Forecast, by End User 2019 & 2032
- Table 79: Global Cancer Treatment Market Revenue Million Forecast, by Country 2019 & 2032
- Table 80: Global Cancer Treatment Market Volume K Unit Forecast, by Country 2019 & 2032
- Table 81: Germany Cancer Treatment Market Revenue (Million) Forecast, by Application 2019 & 2032
- Table 82: Germany Cancer Treatment Market Volume (K Unit) Forecast, by Application 2019 & 2032
- Table 83: United Kingdom Cancer Treatment Market Revenue (Million) Forecast, by Application 2019 & 2032
- Table 84: United Kingdom Cancer Treatment Market Volume (K Unit) Forecast, by Application 2019 & 2032
- Table 85: France Cancer Treatment Market Revenue (Million) Forecast, by Application 2019 & 2032
- Table 86: France Cancer Treatment Market Volume (K Unit) Forecast, by Application 2019 & 2032
- Table 87: Italy Cancer Treatment Market Revenue (Million) Forecast, by Application 2019 & 2032
- Table 88: Italy Cancer Treatment Market Volume (K Unit) Forecast, by Application 2019 & 2032
- Table 89: Spain Cancer Treatment Market Revenue (Million) Forecast, by Application 2019 & 2032
- Table 90: Spain Cancer Treatment Market Volume (K Unit) Forecast, by Application 2019 & 2032
- Table 91: Rest of Europe Cancer Treatment Market Revenue (Million) Forecast, by Application 2019 & 2032
- Table 92: Rest of Europe Cancer Treatment Market Volume (K Unit) Forecast, by Application 2019 & 2032
- Table 93: Global Cancer Treatment Market Revenue Million Forecast, by Therapy 2019 & 2032
- Table 94: Global Cancer Treatment Market Volume K Unit Forecast, by Therapy 2019 & 2032
- Table 95: Global Cancer Treatment Market Revenue Million Forecast, by End User 2019 & 2032
- Table 96: Global Cancer Treatment Market Volume K Unit Forecast, by End User 2019 & 2032
- Table 97: Global Cancer Treatment Market Revenue Million Forecast, by Country 2019 & 2032
- Table 98: Global Cancer Treatment Market Volume K Unit Forecast, by Country 2019 & 2032
- Table 99: China Cancer Treatment Market Revenue (Million) Forecast, by Application 2019 & 2032
- Table 100: China Cancer Treatment Market Volume (K Unit) Forecast, by Application 2019 & 2032
- Table 101: Japan Cancer Treatment Market Revenue (Million) Forecast, by Application 2019 & 2032
- Table 102: Japan Cancer Treatment Market Volume (K Unit) Forecast, by Application 2019 & 2032
- Table 103: India Cancer Treatment Market Revenue (Million) Forecast, by Application 2019 & 2032
- Table 104: India Cancer Treatment Market Volume (K Unit) Forecast, by Application 2019 & 2032
- Table 105: Australia Cancer Treatment Market Revenue (Million) Forecast, by Application 2019 & 2032
- Table 106: Australia Cancer Treatment Market Volume (K Unit) Forecast, by Application 2019 & 2032
- Table 107: South Korea Cancer Treatment Market Revenue (Million) Forecast, by Application 2019 & 2032
- Table 108: South Korea Cancer Treatment Market Volume (K Unit) Forecast, by Application 2019 & 2032
- Table 109: Rest of Asia Pacific Cancer Treatment Market Revenue (Million) Forecast, by Application 2019 & 2032
- Table 110: Rest of Asia Pacific Cancer Treatment Market Volume (K Unit) Forecast, by Application 2019 & 2032
- Table 111: Global Cancer Treatment Market Revenue Million Forecast, by Therapy 2019 & 2032
- Table 112: Global Cancer Treatment Market Volume K Unit Forecast, by Therapy 2019 & 2032
- Table 113: Global Cancer Treatment Market Revenue Million Forecast, by End User 2019 & 2032
- Table 114: Global Cancer Treatment Market Volume K Unit Forecast, by End User 2019 & 2032
- Table 115: Global Cancer Treatment Market Revenue Million Forecast, by Country 2019 & 2032
- Table 116: Global Cancer Treatment Market Volume K Unit Forecast, by Country 2019 & 2032
- Table 117: Global Cancer Treatment Market Revenue Million Forecast, by Therapy 2019 & 2032
- Table 118: Global Cancer Treatment Market Volume K Unit Forecast, by Therapy 2019 & 2032
- Table 119: Global Cancer Treatment Market Revenue Million Forecast, by End User 2019 & 2032
- Table 120: Global Cancer Treatment Market Volume K Unit Forecast, by End User 2019 & 2032
- Table 121: Global Cancer Treatment Market Revenue Million Forecast, by Country 2019 & 2032
- Table 122: Global Cancer Treatment Market Volume K Unit Forecast, by Country 2019 & 2032
- Table 123: South Africa Cancer Treatment Market Revenue (Million) Forecast, by Application 2019 & 2032
- Table 124: South Africa Cancer Treatment Market Volume (K Unit) Forecast, by Application 2019 & 2032
- Table 125: Rest of Middle East Cancer Treatment Market Revenue (Million) Forecast, by Application 2019 & 2032
- Table 126: Rest of Middle East Cancer Treatment Market Volume (K Unit) Forecast, by Application 2019 & 2032
- Table 127: Global Cancer Treatment Market Revenue Million Forecast, by Therapy 2019 & 2032
- Table 128: Global Cancer Treatment Market Volume K Unit Forecast, by Therapy 2019 & 2032
- Table 129: Global Cancer Treatment Market Revenue Million Forecast, by End User 2019 & 2032
- Table 130: Global Cancer Treatment Market Volume K Unit Forecast, by End User 2019 & 2032
- Table 131: Global Cancer Treatment Market Revenue Million Forecast, by Country 2019 & 2032
- Table 132: Global Cancer Treatment Market Volume K Unit Forecast, by Country 2019 & 2032
- Table 133: Brazil Cancer Treatment Market Revenue (Million) Forecast, by Application 2019 & 2032
- Table 134: Brazil Cancer Treatment Market Volume (K Unit) Forecast, by Application 2019 & 2032
- Table 135: Argentina Cancer Treatment Market Revenue (Million) Forecast, by Application 2019 & 2032
- Table 136: Argentina Cancer Treatment Market Volume (K Unit) Forecast, by Application 2019 & 2032
- Table 137: Rest of South America Cancer Treatment Market Revenue (Million) Forecast, by Application 2019 & 2032
- Table 138: Rest of South America Cancer Treatment Market Volume (K Unit) Forecast, by Application 2019 & 2032
Frequently Asked Questions
1. What is the projected Compound Annual Growth Rate (CAGR) of the Cancer Treatment Market?
The projected CAGR is approximately 6.10%.
2. Which companies are prominent players in the Cancer Treatment Market?
Key companies in the market include Sumitomo Pharma Co Ltd, Teva Pharmaceutical Industries Ltd , Bayer AG, Sanofi, Eli Lilly, Amgen Inc, F Hoffmann-La Roche Ltd, TAIHO PHARMACEUTICAL CO LTD, Takeda Pharmaceutical Company Limited, Celleron Therapeutics, Bristol-Myers Squibb Company, Pfizer Inc.
3. What are the main segments of the Cancer Treatment Market?
The market segments include Therapy, End User.
4. Can you provide details about the market size?
The market size is estimated to be USD XX Million as of 2022.
5. What are some drivers contributing to market growth?
Increasing Incidence and Prevalence of Colorectal Cancer; Technological Advancements in Radiology and Chemotherapy.
6. What are the notable trends driving market growth?
Chemotherapy is Expected to Hold a Significant Market Share Over the Forecast Period.
7. Are there any restraints impacting market growth?
High Costs and the Side Effects Associated with Drugs.
8. Can you provide examples of recent developments in the market?
In April 2022, the United States Food and Drug Administration approved the third biosimilar for the monoclonal antibody bevacizumab-bevacizumab-maly (Alymsys)-for the treatment of subsets of patients with colorectal cancer, non-small cell lung cancer, glioblastoma, renal cell carcinoma, cervical cancer, and ovarian cancer.
9. What pricing options are available for accessing the report?
Pricing options include single-user, multi-user, and enterprise licenses priced at USD 4750, USD 5250, and USD 8750 respectively.
10. Is the market size provided in terms of value or volume?
The market size is provided in terms of value, measured in Million and volume, measured in K Unit.
11. Are there any specific market keywords associated with the report?
Yes, the market keyword associated with the report is "Cancer Treatment Market," which aids in identifying and referencing the specific market segment covered.
12. How do I determine which pricing option suits my needs best?
The pricing options vary based on user requirements and access needs. Individual users may opt for single-user licenses, while businesses requiring broader access may choose multi-user or enterprise licenses for cost-effective access to the report.
13. Are there any additional resources or data provided in the Cancer Treatment Market report?
While the report offers comprehensive insights, it's advisable to review the specific contents or supplementary materials provided to ascertain if additional resources or data are available.
14. How can I stay updated on further developments or reports in the Cancer Treatment Market?
To stay informed about further developments, trends, and reports in the Cancer Treatment Market, consider subscribing to industry newsletters, following relevant companies and organizations, or regularly checking reputable industry news sources and publications.
Methodology
Step 1 - Identification of Relevant Samples Size from Population Database


Step 2 - Approaches for Defining Global Market Size (Value, Volume* & Price*)

Note*: In applicable scenarios
Step 3 - Data Sources
Primary Research
- Web Analytics
- Survey Reports
- Research Institute
- Latest Research Reports
- Opinion Leaders
Secondary Research
- Annual Reports
- White Paper
- Latest Press Release
- Industry Association
- Paid Database
- Investor Presentations

Step 4 - Data Triangulation
Involves using different sources of information in order to increase the validity of a study
These sources are likely to be stakeholders in a program - participants, other researchers, program staff, other community members, and so on.
Then we put all data in single framework & apply various statistical tools to find out the dynamic on the market.
During the analysis stage, feedback from the stakeholder groups would be compared to determine areas of agreement as well as areas of divergence


