

Key Insights
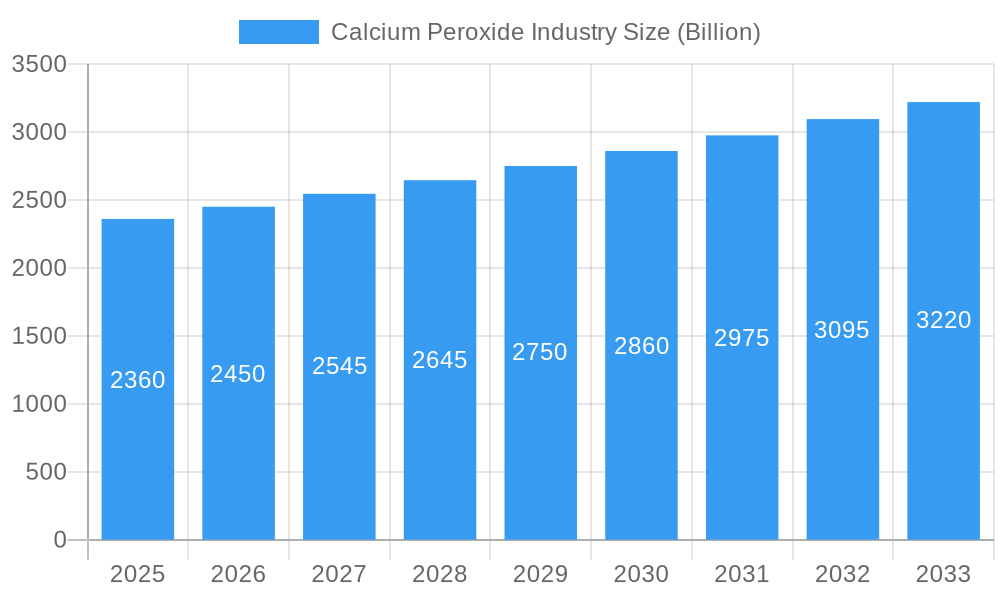
The global calcium peroxide market, valued at $2.36 billion in 2025, is projected to experience steady growth, driven by its diverse applications across various industries. A compound annual growth rate (CAGR) of 3.64% from 2025 to 2033 indicates a promising future for this market. Key drivers include the increasing demand for environmentally friendly bleaching agents in the food and pulp & paper industries, its role as a soil amendment in agriculture improving crop yields, and its use as a disinfectant in seed treatment. The food and beverage sector represents a significant portion of the market, fueled by the growing demand for natural and safe processing aids. Furthermore, the pharmaceutical industry's utilization of calcium peroxide as an oxidizing agent contributes significantly to market growth. However, potential restraints include price volatility of raw materials and the presence of alternative bleaching and oxidizing agents. Market segmentation reveals substantial contributions from food-grade calcium peroxide, followed by industrial-grade applications. Within applications, seed disinfectants and bleaching agents dominate, reflecting the widespread adoption of calcium peroxide in these fields. Geographically, North America and Europe currently hold significant market shares, but the Asia-Pacific region, particularly China and India, is expected to witness substantial growth in the coming years due to increasing industrialization and agricultural activities. The competitive landscape is fragmented, with numerous players ranging from established multinational corporations to smaller regional producers.
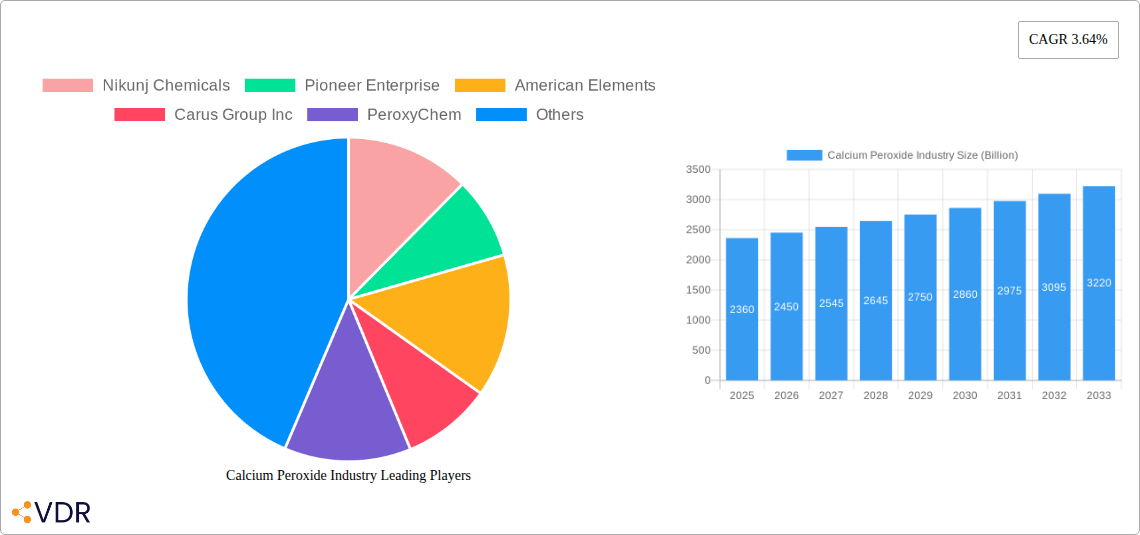
Calcium Peroxide Industry Market Size (In Billion)
The forecast period (2025-2033) anticipates continued market expansion, driven primarily by advancements in agricultural practices and increasing consumer preference for naturally processed food and beverages. The expanding pharmaceutical and mining sectors also contribute to the overall growth trajectory. However, sustainable sourcing of raw materials and addressing potential environmental concerns related to production and disposal will be crucial for ensuring the long-term health and sustainability of this market. Companies should focus on innovation and developing specialized grades of calcium peroxide to cater to the specific needs of different applications and industries. Strategic partnerships and mergers and acquisitions can further enhance market penetration and consolidate the industry.
Calcium Peroxide Industry Company Market Share
Calcium Peroxide Industry Market Report: 2019-2033
This comprehensive report provides an in-depth analysis of the global calcium peroxide market, encompassing market dynamics, growth trends, regional segmentation, competitive landscape, and future outlook. The report covers the historical period from 2019 to 2024, the base year of 2025, and offers a forecast spanning 2025 to 2033. The market is segmented by grade (Food, Industrial), application (Seed Disinfectant, Bleaching Agent, Dough Conditioner, Oxidizing Agent, Intermediary Chemicals, Other Applications), and end-user industry (Food and Beverages, Agriculture, Mining, Pharmaceuticals, Paper and Pulp, Other End-user Industries). The total market size is projected to reach xx Billion by 2033.
Calcium Peroxide Industry Market Dynamics & Structure
The calcium peroxide market is characterized by moderate concentration, with key players holding significant market share. Technological innovation, primarily focused on improving efficacy and safety, is a crucial driver. Stringent regulatory frameworks concerning food safety and environmental impact influence market operations. Competitive substitutes, such as hydrogen peroxide, pose challenges, but calcium peroxide retains advantages in specific applications. End-user demographics, particularly in the agricultural and food processing sectors, significantly influence demand. The market has witnessed a moderate level of M&A activity in recent years, primarily focused on expanding geographic reach and product portfolios.
- Market Concentration: Moderately concentrated, with top 5 players holding approximately xx% market share in 2025.
- Technological Innovation: Focus on improving particle size distribution, enhancing stability, and developing eco-friendly production methods.
- Regulatory Frameworks: Stringent regulations regarding food safety and environmental protection impacting production and application.
- Competitive Substitutes: Hydrogen peroxide is a primary competitor, but calcium peroxide benefits from superior stability and specific application suitability.
- M&A Activity: xx billion in M&A deals in the period 2019-2024, with a focus on expanding market presence.
- Innovation Barriers: High R&D costs, stringent regulatory approvals and challenges in developing sustainable manufacturing processes.
Calcium Peroxide Industry Growth Trends & Insights
The global calcium peroxide market experienced a CAGR of xx% during 2019-2024, driven by increasing demand from the food and beverage, agriculture, and pharmaceutical industries. Adoption rates have been steadily increasing, particularly in developing economies where agricultural practices are rapidly evolving. Technological advancements, such as improved formulation and delivery systems, are fueling market growth. Consumer preference for natural and sustainable products is bolstering the adoption of calcium peroxide in various applications. The market is expected to maintain a robust growth trajectory in the forecast period, primarily driven by expanding applications in novel segments like aquaculture and water treatment, reaching xx Billion by 2033 with a projected CAGR of xx%. The market penetration in emerging economies is a key factor driving growth.
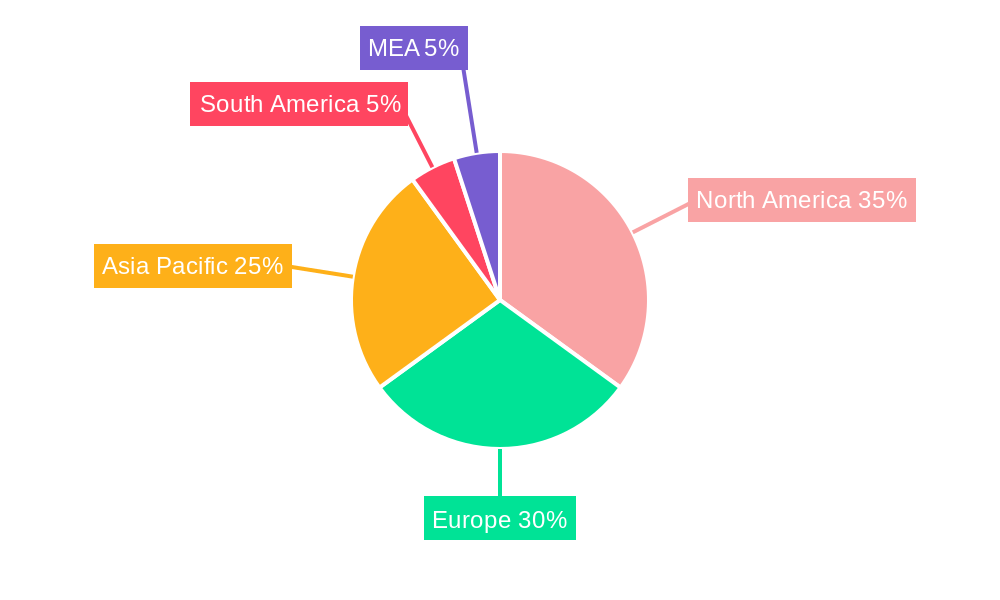
Dominant Regions, Countries, or Segments in Calcium Peroxide Industry
The North American region currently dominates the global calcium peroxide market, followed by Europe and Asia-Pacific. Within applications, the seed disinfectant segment exhibits the highest growth rate, driven by increasing demand for higher crop yields and disease control. The food and beverage industry remains a significant end-user segment, driven by the need for natural bleaching and dough conditioning agents. Strong economic growth, favorable government policies promoting sustainable agriculture, and the availability of advanced technologies are key drivers in the leading regions.
- North America: Dominates due to strong demand from food and agriculture sectors, coupled with advanced technology adoption.
- Europe: Significant market share driven by the established chemical industry and stringent regulatory environment promoting sustainable products.
- Asia-Pacific: High growth potential due to rapidly expanding agriculture sector and increasing consumer awareness of food safety.
- Seed Disinfectant Segment: Fastest-growing application segment driven by increasing need for enhanced crop protection.
- Food and Beverage Industry: Significant end-user segment due to the use of calcium peroxide as a natural bleaching agent and dough conditioner.
Calcium Peroxide Industry Product Landscape
Calcium peroxide is offered in various grades (food and industrial) tailored to meet specific application needs. Innovations focus on improving particle size, enhancing stability, and ensuring controlled release of oxygen. Recent advancements involve developing formulations with enhanced efficacy and reduced environmental impact. The unique selling proposition hinges on its efficacy, cost-effectiveness, and environmentally friendly nature compared to traditional chemical alternatives.
Key Drivers, Barriers & Challenges in Calcium Peroxide Industry
Key Drivers: Growing demand for sustainable agricultural practices, increasing use in food and beverage processing, rising awareness of food safety, and expansion into new applications (e.g., water treatment) are primary drivers.
Key Barriers & Challenges: Price volatility of raw materials, stringent regulatory compliance, and competition from substitutes like hydrogen peroxide pose significant challenges. Supply chain disruptions caused by geopolitical instability can also affect market dynamics, impacting the overall supply and thus the price. For example, the year 2022 witnessed an increase in price by xx%, owing to disruption in raw material supply.
Emerging Opportunities in Calcium Peroxide Industry
Untapped markets in developing economies, especially in Africa and Latin America, present significant growth opportunities. The rising demand for organic and natural food products is driving the need for safe and effective bleaching agents in the food industry. Innovative applications in aquaculture and water treatment are also emerging, offering significant market expansion possibilities.
Growth Accelerators in the Calcium Peroxide Industry
Technological breakthroughs focused on improving product efficacy, safety, and sustainability will significantly accelerate market growth. Strategic partnerships between manufacturers and end-users to develop tailored solutions will propel market expansion. Expansion into new geographic markets and diversification of applications will further stimulate growth.
Key Players Shaping the Calcium Peroxide Industry Market
- Nikunj Chemicals
- Pioneer Enterprise
- American Elements
- Carus Group Inc
- PeroxyChem
- Sunway Lab
- Zhengzhou Huize Biochemical Technology Co Ltd
- Solvay SA
- Mahalaxmi Enterprise
- Shangyu Jie Hua Chemical Co
- STP Chem Solutions Co Ltd
- Noshly Pty Ltd
Notable Milestones in Calcium Peroxide Industry Sector
- 2020: Introduction of a new, eco-friendly calcium peroxide formulation by Carus Group Inc.
- 2022: Merger between two smaller calcium peroxide manufacturers, resulting in increased market consolidation.
- 2023: Launch of a new high-purity grade of calcium peroxide by Solvay SA for pharmaceutical applications.
In-Depth Calcium Peroxide Industry Market Outlook
The calcium peroxide market is poised for sustained growth over the forecast period, driven by expanding applications, technological advancements, and increasing focus on sustainable solutions. Strategic investments in R&D, strategic partnerships, and expansion into new geographic markets will be crucial to capitalize on future market opportunities. The market is expected to reach xx Billion by 2033, presenting significant potential for established players and new entrants.
Calcium Peroxide Industry Segmentation
-
1. Grade
- 1.1. Food
- 1.2. Industrial
-
2. Application
- 2.1. Seed Disinfectant
- 2.2. Bleaching Agent
- 2.3. Dough Conditioner
- 2.4. Oxidizing Agent
- 2.5. Intermediary Chemicals
- 2.6. Other Applications
-
3. End-user Industry
- 3.1. Food and Beverages
- 3.2. Agriculture
- 3.3. Mining
- 3.4. Pharmaceuticals
- 3.5. Paper and Pulp
- 3.6. Other End-user Industries
Calcium Peroxide Industry Segmentation By Geography
-
1. Asia Pacific
- 1.1. China
- 1.2. India
- 1.3. Japan
- 1.4. South Korea
- 1.5. Rest of Asia Pacific
-
2. North America
- 2.1. United States
- 2.2. Canada
- 2.3. Mexico
-
3. Europe
- 3.1. Germany
- 3.2. United Kingdom
- 3.3. Italy
- 3.4. France
- 3.5. Rest of Europe
-
4. South America
- 4.1. Brazil
- 4.2. Argentina
- 4.3. Rest of South America
-
5. Middle East and Africa
- 5.1. Saudi Arabia
- 5.2. South Africa
- 5.3. Rest of Middle East and Africa
Calcium Peroxide Industry Regional Market Share
Geographic Coverage of Calcium Peroxide Industry
Calcium Peroxide Industry REPORT HIGHLIGHTS
| Aspects | Details |
|---|---|
| Study Period | 2020-2034 |
| Base Year | 2025 |
| Estimated Year | 2026 |
| Forecast Period | 2026-2034 |
| Historical Period | 2020-2025 |
| Growth Rate | CAGR of 3.64% from 2020-2034 |
| Segmentation |
|
Table of Contents
- 1. Introduction
- 1.1. Research Scope
- 1.2. Market Segmentation
- 1.3. Research Objective
- 1.4. Definitions and Assumptions
- 2. Executive Summary
- 2.1. Market Snapshot
- 3. Market Dynamics
- 3.1. Market Drivers
- 3.2. Market Restrains
- 3.3. Market Trends
- 3.4. Market Opportunities
- 4. Market Factor Analysis
- 4.1. Porters Five Forces
- 4.1.1. Bargaining Power of Suppliers
- 4.1.2. Bargaining Power of Buyers
- 4.1.3. Threat of New Entrants
- 4.1.4. Threat of Substitutes
- 4.1.5. Competitive Rivalry
- 4.2. PESTEL analysis
- 4.3. BCG Analysis
- 4.3.1. Stars (High Growth, High Market Share)
- 4.3.2. Cash Cows (Low Growth, High Market Share)
- 4.3.3. Question Mark (High Growth, Low Market Share)
- 4.3.4. Dogs (Low Growth, Low Market Share)
- 4.4. Ansoff Matrix Analysis
- 4.5. Supply Chain Analysis
- 4.6. Regulatory Landscape
- 4.7. Current Market Potential and Opportunity Assessment (TAM–SAM–SOM Framework)
- 4.8. VDR Analyst Note
- 4.1. Porters Five Forces
- 5. Market Analysis, Insights and Forecast 2021-2033
- 5.1. Market Analysis, Insights and Forecast - by Grade
- 5.1.1. Food
- 5.1.2. Industrial
- 5.2. Market Analysis, Insights and Forecast - by Application
- 5.2.1. Seed Disinfectant
- 5.2.2. Bleaching Agent
- 5.2.3. Dough Conditioner
- 5.2.4. Oxidizing Agent
- 5.2.5. Intermediary Chemicals
- 5.2.6. Other Applications
- 5.3. Market Analysis, Insights and Forecast - by End-user Industry
- 5.3.1. Food and Beverages
- 5.3.2. Agriculture
- 5.3.3. Mining
- 5.3.4. Pharmaceuticals
- 5.3.5. Paper and Pulp
- 5.3.6. Other End-user Industries
- 5.4. Market Analysis, Insights and Forecast - by Region
- 5.4.1. Asia Pacific
- 5.4.2. North America
- 5.4.3. Europe
- 5.4.4. South America
- 5.4.5. Middle East and Africa
- 5.1. Market Analysis, Insights and Forecast - by Grade
- 6. Global Calcium Peroxide Industry Analysis, Insights and Forecast, 2021-2033
- 6.1. Market Analysis, Insights and Forecast - by Grade
- 6.1.1. Food
- 6.1.2. Industrial
- 6.2. Market Analysis, Insights and Forecast - by Application
- 6.2.1. Seed Disinfectant
- 6.2.2. Bleaching Agent
- 6.2.3. Dough Conditioner
- 6.2.4. Oxidizing Agent
- 6.2.5. Intermediary Chemicals
- 6.2.6. Other Applications
- 6.3. Market Analysis, Insights and Forecast - by End-user Industry
- 6.3.1. Food and Beverages
- 6.3.2. Agriculture
- 6.3.3. Mining
- 6.3.4. Pharmaceuticals
- 6.3.5. Paper and Pulp
- 6.3.6. Other End-user Industries
- 6.1. Market Analysis, Insights and Forecast - by Grade
- 7. Asia Pacific Calcium Peroxide Industry Analysis, Insights and Forecast, 2021-2033
- 7.1. Market Analysis, Insights and Forecast - by Grade
- 7.1.1. Food
- 7.1.2. Industrial
- 7.2. Market Analysis, Insights and Forecast - by Application
- 7.2.1. Seed Disinfectant
- 7.2.2. Bleaching Agent
- 7.2.3. Dough Conditioner
- 7.2.4. Oxidizing Agent
- 7.2.5. Intermediary Chemicals
- 7.2.6. Other Applications
- 7.3. Market Analysis, Insights and Forecast - by End-user Industry
- 7.3.1. Food and Beverages
- 7.3.2. Agriculture
- 7.3.3. Mining
- 7.3.4. Pharmaceuticals
- 7.3.5. Paper and Pulp
- 7.3.6. Other End-user Industries
- 7.1. Market Analysis, Insights and Forecast - by Grade
- 8. North America Calcium Peroxide Industry Analysis, Insights and Forecast, 2021-2033
- 8.1. Market Analysis, Insights and Forecast - by Grade
- 8.1.1. Food
- 8.1.2. Industrial
- 8.2. Market Analysis, Insights and Forecast - by Application
- 8.2.1. Seed Disinfectant
- 8.2.2. Bleaching Agent
- 8.2.3. Dough Conditioner
- 8.2.4. Oxidizing Agent
- 8.2.5. Intermediary Chemicals
- 8.2.6. Other Applications
- 8.3. Market Analysis, Insights and Forecast - by End-user Industry
- 8.3.1. Food and Beverages
- 8.3.2. Agriculture
- 8.3.3. Mining
- 8.3.4. Pharmaceuticals
- 8.3.5. Paper and Pulp
- 8.3.6. Other End-user Industries
- 8.1. Market Analysis, Insights and Forecast - by Grade
- 9. Europe Calcium Peroxide Industry Analysis, Insights and Forecast, 2021-2033
- 9.1. Market Analysis, Insights and Forecast - by Grade
- 9.1.1. Food
- 9.1.2. Industrial
- 9.2. Market Analysis, Insights and Forecast - by Application
- 9.2.1. Seed Disinfectant
- 9.2.2. Bleaching Agent
- 9.2.3. Dough Conditioner
- 9.2.4. Oxidizing Agent
- 9.2.5. Intermediary Chemicals
- 9.2.6. Other Applications
- 9.3. Market Analysis, Insights and Forecast - by End-user Industry
- 9.3.1. Food and Beverages
- 9.3.2. Agriculture
- 9.3.3. Mining
- 9.3.4. Pharmaceuticals
- 9.3.5. Paper and Pulp
- 9.3.6. Other End-user Industries
- 9.1. Market Analysis, Insights and Forecast - by Grade
- 10. South America Calcium Peroxide Industry Analysis, Insights and Forecast, 2021-2033
- 10.1. Market Analysis, Insights and Forecast - by Grade
- 10.1.1. Food
- 10.1.2. Industrial
- 10.2. Market Analysis, Insights and Forecast - by Application
- 10.2.1. Seed Disinfectant
- 10.2.2. Bleaching Agent
- 10.2.3. Dough Conditioner
- 10.2.4. Oxidizing Agent
- 10.2.5. Intermediary Chemicals
- 10.2.6. Other Applications
- 10.3. Market Analysis, Insights and Forecast - by End-user Industry
- 10.3.1. Food and Beverages
- 10.3.2. Agriculture
- 10.3.3. Mining
- 10.3.4. Pharmaceuticals
- 10.3.5. Paper and Pulp
- 10.3.6. Other End-user Industries
- 10.1. Market Analysis, Insights and Forecast - by Grade
- 11. Middle East and Africa Calcium Peroxide Industry Analysis, Insights and Forecast, 2021-2033
- 11.1. Market Analysis, Insights and Forecast - by Grade
- 11.1.1. Food
- 11.1.2. Industrial
- 11.2. Market Analysis, Insights and Forecast - by Application
- 11.2.1. Seed Disinfectant
- 11.2.2. Bleaching Agent
- 11.2.3. Dough Conditioner
- 11.2.4. Oxidizing Agent
- 11.2.5. Intermediary Chemicals
- 11.2.6. Other Applications
- 11.3. Market Analysis, Insights and Forecast - by End-user Industry
- 11.3.1. Food and Beverages
- 11.3.2. Agriculture
- 11.3.3. Mining
- 11.3.4. Pharmaceuticals
- 11.3.5. Paper and Pulp
- 11.3.6. Other End-user Industries
- 11.1. Market Analysis, Insights and Forecast - by Grade
- 12. Competitive Analysis
- 12.1. Company Profiles
- 12.1.1 Nikunj Chemicals
- 12.1.1.1. Company Overview
- 12.1.1.2. Products
- 12.1.1.3. Company Financials
- 12.1.1.4. SWOT Analysis
- 12.1.2 Pioneer Enterprise
- 12.1.2.1. Company Overview
- 12.1.2.2. Products
- 12.1.2.3. Company Financials
- 12.1.2.4. SWOT Analysis
- 12.1.3 American Elements
- 12.1.3.1. Company Overview
- 12.1.3.2. Products
- 12.1.3.3. Company Financials
- 12.1.3.4. SWOT Analysis
- 12.1.4 Carus Group Inc
- 12.1.4.1. Company Overview
- 12.1.4.2. Products
- 12.1.4.3. Company Financials
- 12.1.4.4. SWOT Analysis
- 12.1.5 PeroxyChem
- 12.1.5.1. Company Overview
- 12.1.5.2. Products
- 12.1.5.3. Company Financials
- 12.1.5.4. SWOT Analysis
- 12.1.6 Sunway Lab
- 12.1.6.1. Company Overview
- 12.1.6.2. Products
- 12.1.6.3. Company Financials
- 12.1.6.4. SWOT Analysis
- 12.1.7 Zhengzhou Huize Biochemical Technology Co Ltd
- 12.1.7.1. Company Overview
- 12.1.7.2. Products
- 12.1.7.3. Company Financials
- 12.1.7.4. SWOT Analysis
- 12.1.8 Solvay SA
- 12.1.8.1. Company Overview
- 12.1.8.2. Products
- 12.1.8.3. Company Financials
- 12.1.8.4. SWOT Analysis
- 12.1.9 Mahalaxmi Enterprise
- 12.1.9.1. Company Overview
- 12.1.9.2. Products
- 12.1.9.3. Company Financials
- 12.1.9.4. SWOT Analysis
- 12.1.10 Shangyu Jie Hua Chemical Co
- 12.1.10.1. Company Overview
- 12.1.10.2. Products
- 12.1.10.3. Company Financials
- 12.1.10.4. SWOT Analysis
- 12.1.11 STP Chem Solutions Co Ltd
- 12.1.11.1. Company Overview
- 12.1.11.2. Products
- 12.1.11.3. Company Financials
- 12.1.11.4. SWOT Analysis
- 12.1.12 Noshly Pty Ltd
- 12.1.12.1. Company Overview
- 12.1.12.2. Products
- 12.1.12.3. Company Financials
- 12.1.12.4. SWOT Analysis
- 12.1.1 Nikunj Chemicals
- 12.2. Market Entropy
- 12.2.1 Company's Key Areas Served
- 12.2.2 Recent Developments
- 12.3. Company Market Share Analysis 2025
- 12.3.1 Top 5 Companies Market Share Analysis
- 12.3.2 Top 3 Companies Market Share Analysis
- 12.4. List of Potential Customers
- 13. Research Methodology
List of Figures
- Figure 1: Global Calcium Peroxide Industry Revenue Breakdown (Billion, %) by Region 2025 & 2033
- Figure 2: Global Calcium Peroxide Industry Volume Breakdown (K Tons, %) by Region 2025 & 2033
- Figure 3: Asia Pacific Calcium Peroxide Industry Revenue (Billion), by Grade 2025 & 2033
- Figure 4: Asia Pacific Calcium Peroxide Industry Volume (K Tons), by Grade 2025 & 2033
- Figure 5: Asia Pacific Calcium Peroxide Industry Revenue Share (%), by Grade 2025 & 2033
- Figure 6: Asia Pacific Calcium Peroxide Industry Volume Share (%), by Grade 2025 & 2033
- Figure 7: Asia Pacific Calcium Peroxide Industry Revenue (Billion), by Application 2025 & 2033
- Figure 8: Asia Pacific Calcium Peroxide Industry Volume (K Tons), by Application 2025 & 2033
- Figure 9: Asia Pacific Calcium Peroxide Industry Revenue Share (%), by Application 2025 & 2033
- Figure 10: Asia Pacific Calcium Peroxide Industry Volume Share (%), by Application 2025 & 2033
- Figure 11: Asia Pacific Calcium Peroxide Industry Revenue (Billion), by End-user Industry 2025 & 2033
- Figure 12: Asia Pacific Calcium Peroxide Industry Volume (K Tons), by End-user Industry 2025 & 2033
- Figure 13: Asia Pacific Calcium Peroxide Industry Revenue Share (%), by End-user Industry 2025 & 2033
- Figure 14: Asia Pacific Calcium Peroxide Industry Volume Share (%), by End-user Industry 2025 & 2033
- Figure 15: Asia Pacific Calcium Peroxide Industry Revenue (Billion), by Country 2025 & 2033
- Figure 16: Asia Pacific Calcium Peroxide Industry Volume (K Tons), by Country 2025 & 2033
- Figure 17: Asia Pacific Calcium Peroxide Industry Revenue Share (%), by Country 2025 & 2033
- Figure 18: Asia Pacific Calcium Peroxide Industry Volume Share (%), by Country 2025 & 2033
- Figure 19: North America Calcium Peroxide Industry Revenue (Billion), by Grade 2025 & 2033
- Figure 20: North America Calcium Peroxide Industry Volume (K Tons), by Grade 2025 & 2033
- Figure 21: North America Calcium Peroxide Industry Revenue Share (%), by Grade 2025 & 2033
- Figure 22: North America Calcium Peroxide Industry Volume Share (%), by Grade 2025 & 2033
- Figure 23: North America Calcium Peroxide Industry Revenue (Billion), by Application 2025 & 2033
- Figure 24: North America Calcium Peroxide Industry Volume (K Tons), by Application 2025 & 2033
- Figure 25: North America Calcium Peroxide Industry Revenue Share (%), by Application 2025 & 2033
- Figure 26: North America Calcium Peroxide Industry Volume Share (%), by Application 2025 & 2033
- Figure 27: North America Calcium Peroxide Industry Revenue (Billion), by End-user Industry 2025 & 2033
- Figure 28: North America Calcium Peroxide Industry Volume (K Tons), by End-user Industry 2025 & 2033
- Figure 29: North America Calcium Peroxide Industry Revenue Share (%), by End-user Industry 2025 & 2033
- Figure 30: North America Calcium Peroxide Industry Volume Share (%), by End-user Industry 2025 & 2033
- Figure 31: North America Calcium Peroxide Industry Revenue (Billion), by Country 2025 & 2033
- Figure 32: North America Calcium Peroxide Industry Volume (K Tons), by Country 2025 & 2033
- Figure 33: North America Calcium Peroxide Industry Revenue Share (%), by Country 2025 & 2033
- Figure 34: North America Calcium Peroxide Industry Volume Share (%), by Country 2025 & 2033
- Figure 35: Europe Calcium Peroxide Industry Revenue (Billion), by Grade 2025 & 2033
- Figure 36: Europe Calcium Peroxide Industry Volume (K Tons), by Grade 2025 & 2033
- Figure 37: Europe Calcium Peroxide Industry Revenue Share (%), by Grade 2025 & 2033
- Figure 38: Europe Calcium Peroxide Industry Volume Share (%), by Grade 2025 & 2033
- Figure 39: Europe Calcium Peroxide Industry Revenue (Billion), by Application 2025 & 2033
- Figure 40: Europe Calcium Peroxide Industry Volume (K Tons), by Application 2025 & 2033
- Figure 41: Europe Calcium Peroxide Industry Revenue Share (%), by Application 2025 & 2033
- Figure 42: Europe Calcium Peroxide Industry Volume Share (%), by Application 2025 & 2033
- Figure 43: Europe Calcium Peroxide Industry Revenue (Billion), by End-user Industry 2025 & 2033
- Figure 44: Europe Calcium Peroxide Industry Volume (K Tons), by End-user Industry 2025 & 2033
- Figure 45: Europe Calcium Peroxide Industry Revenue Share (%), by End-user Industry 2025 & 2033
- Figure 46: Europe Calcium Peroxide Industry Volume Share (%), by End-user Industry 2025 & 2033
- Figure 47: Europe Calcium Peroxide Industry Revenue (Billion), by Country 2025 & 2033
- Figure 48: Europe Calcium Peroxide Industry Volume (K Tons), by Country 2025 & 2033
- Figure 49: Europe Calcium Peroxide Industry Revenue Share (%), by Country 2025 & 2033
- Figure 50: Europe Calcium Peroxide Industry Volume Share (%), by Country 2025 & 2033
- Figure 51: South America Calcium Peroxide Industry Revenue (Billion), by Grade 2025 & 2033
- Figure 52: South America Calcium Peroxide Industry Volume (K Tons), by Grade 2025 & 2033
- Figure 53: South America Calcium Peroxide Industry Revenue Share (%), by Grade 2025 & 2033
- Figure 54: South America Calcium Peroxide Industry Volume Share (%), by Grade 2025 & 2033
- Figure 55: South America Calcium Peroxide Industry Revenue (Billion), by Application 2025 & 2033
- Figure 56: South America Calcium Peroxide Industry Volume (K Tons), by Application 2025 & 2033
- Figure 57: South America Calcium Peroxide Industry Revenue Share (%), by Application 2025 & 2033
- Figure 58: South America Calcium Peroxide Industry Volume Share (%), by Application 2025 & 2033
- Figure 59: South America Calcium Peroxide Industry Revenue (Billion), by End-user Industry 2025 & 2033
- Figure 60: South America Calcium Peroxide Industry Volume (K Tons), by End-user Industry 2025 & 2033
- Figure 61: South America Calcium Peroxide Industry Revenue Share (%), by End-user Industry 2025 & 2033
- Figure 62: South America Calcium Peroxide Industry Volume Share (%), by End-user Industry 2025 & 2033
- Figure 63: South America Calcium Peroxide Industry Revenue (Billion), by Country 2025 & 2033
- Figure 64: South America Calcium Peroxide Industry Volume (K Tons), by Country 2025 & 2033
- Figure 65: South America Calcium Peroxide Industry Revenue Share (%), by Country 2025 & 2033
- Figure 66: South America Calcium Peroxide Industry Volume Share (%), by Country 2025 & 2033
- Figure 67: Middle East and Africa Calcium Peroxide Industry Revenue (Billion), by Grade 2025 & 2033
- Figure 68: Middle East and Africa Calcium Peroxide Industry Volume (K Tons), by Grade 2025 & 2033
- Figure 69: Middle East and Africa Calcium Peroxide Industry Revenue Share (%), by Grade 2025 & 2033
- Figure 70: Middle East and Africa Calcium Peroxide Industry Volume Share (%), by Grade 2025 & 2033
- Figure 71: Middle East and Africa Calcium Peroxide Industry Revenue (Billion), by Application 2025 & 2033
- Figure 72: Middle East and Africa Calcium Peroxide Industry Volume (K Tons), by Application 2025 & 2033
- Figure 73: Middle East and Africa Calcium Peroxide Industry Revenue Share (%), by Application 2025 & 2033
- Figure 74: Middle East and Africa Calcium Peroxide Industry Volume Share (%), by Application 2025 & 2033
- Figure 75: Middle East and Africa Calcium Peroxide Industry Revenue (Billion), by End-user Industry 2025 & 2033
- Figure 76: Middle East and Africa Calcium Peroxide Industry Volume (K Tons), by End-user Industry 2025 & 2033
- Figure 77: Middle East and Africa Calcium Peroxide Industry Revenue Share (%), by End-user Industry 2025 & 2033
- Figure 78: Middle East and Africa Calcium Peroxide Industry Volume Share (%), by End-user Industry 2025 & 2033
- Figure 79: Middle East and Africa Calcium Peroxide Industry Revenue (Billion), by Country 2025 & 2033
- Figure 80: Middle East and Africa Calcium Peroxide Industry Volume (K Tons), by Country 2025 & 2033
- Figure 81: Middle East and Africa Calcium Peroxide Industry Revenue Share (%), by Country 2025 & 2033
- Figure 82: Middle East and Africa Calcium Peroxide Industry Volume Share (%), by Country 2025 & 2033
List of Tables
- Table 1: Global Calcium Peroxide Industry Revenue Billion Forecast, by Grade 2020 & 2033
- Table 2: Global Calcium Peroxide Industry Volume K Tons Forecast, by Grade 2020 & 2033
- Table 3: Global Calcium Peroxide Industry Revenue Billion Forecast, by Application 2020 & 2033
- Table 4: Global Calcium Peroxide Industry Volume K Tons Forecast, by Application 2020 & 2033
- Table 5: Global Calcium Peroxide Industry Revenue Billion Forecast, by End-user Industry 2020 & 2033
- Table 6: Global Calcium Peroxide Industry Volume K Tons Forecast, by End-user Industry 2020 & 2033
- Table 7: Global Calcium Peroxide Industry Revenue Billion Forecast, by Region 2020 & 2033
- Table 8: Global Calcium Peroxide Industry Volume K Tons Forecast, by Region 2020 & 2033
- Table 9: Global Calcium Peroxide Industry Revenue Billion Forecast, by Grade 2020 & 2033
- Table 10: Global Calcium Peroxide Industry Volume K Tons Forecast, by Grade 2020 & 2033
- Table 11: Global Calcium Peroxide Industry Revenue Billion Forecast, by Application 2020 & 2033
- Table 12: Global Calcium Peroxide Industry Volume K Tons Forecast, by Application 2020 & 2033
- Table 13: Global Calcium Peroxide Industry Revenue Billion Forecast, by End-user Industry 2020 & 2033
- Table 14: Global Calcium Peroxide Industry Volume K Tons Forecast, by End-user Industry 2020 & 2033
- Table 15: Global Calcium Peroxide Industry Revenue Billion Forecast, by Country 2020 & 2033
- Table 16: Global Calcium Peroxide Industry Volume K Tons Forecast, by Country 2020 & 2033
- Table 17: China Calcium Peroxide Industry Revenue (Billion) Forecast, by Application 2020 & 2033
- Table 18: China Calcium Peroxide Industry Volume (K Tons) Forecast, by Application 2020 & 2033
- Table 19: India Calcium Peroxide Industry Revenue (Billion) Forecast, by Application 2020 & 2033
- Table 20: India Calcium Peroxide Industry Volume (K Tons) Forecast, by Application 2020 & 2033
- Table 21: Japan Calcium Peroxide Industry Revenue (Billion) Forecast, by Application 2020 & 2033
- Table 22: Japan Calcium Peroxide Industry Volume (K Tons) Forecast, by Application 2020 & 2033
- Table 23: South Korea Calcium Peroxide Industry Revenue (Billion) Forecast, by Application 2020 & 2033
- Table 24: South Korea Calcium Peroxide Industry Volume (K Tons) Forecast, by Application 2020 & 2033
- Table 25: Rest of Asia Pacific Calcium Peroxide Industry Revenue (Billion) Forecast, by Application 2020 & 2033
- Table 26: Rest of Asia Pacific Calcium Peroxide Industry Volume (K Tons) Forecast, by Application 2020 & 2033
- Table 27: Global Calcium Peroxide Industry Revenue Billion Forecast, by Grade 2020 & 2033
- Table 28: Global Calcium Peroxide Industry Volume K Tons Forecast, by Grade 2020 & 2033
- Table 29: Global Calcium Peroxide Industry Revenue Billion Forecast, by Application 2020 & 2033
- Table 30: Global Calcium Peroxide Industry Volume K Tons Forecast, by Application 2020 & 2033
- Table 31: Global Calcium Peroxide Industry Revenue Billion Forecast, by End-user Industry 2020 & 2033
- Table 32: Global Calcium Peroxide Industry Volume K Tons Forecast, by End-user Industry 2020 & 2033
- Table 33: Global Calcium Peroxide Industry Revenue Billion Forecast, by Country 2020 & 2033
- Table 34: Global Calcium Peroxide Industry Volume K Tons Forecast, by Country 2020 & 2033
- Table 35: United States Calcium Peroxide Industry Revenue (Billion) Forecast, by Application 2020 & 2033
- Table 36: United States Calcium Peroxide Industry Volume (K Tons) Forecast, by Application 2020 & 2033
- Table 37: Canada Calcium Peroxide Industry Revenue (Billion) Forecast, by Application 2020 & 2033
- Table 38: Canada Calcium Peroxide Industry Volume (K Tons) Forecast, by Application 2020 & 2033
- Table 39: Mexico Calcium Peroxide Industry Revenue (Billion) Forecast, by Application 2020 & 2033
- Table 40: Mexico Calcium Peroxide Industry Volume (K Tons) Forecast, by Application 2020 & 2033
- Table 41: Global Calcium Peroxide Industry Revenue Billion Forecast, by Grade 2020 & 2033
- Table 42: Global Calcium Peroxide Industry Volume K Tons Forecast, by Grade 2020 & 2033
- Table 43: Global Calcium Peroxide Industry Revenue Billion Forecast, by Application 2020 & 2033
- Table 44: Global Calcium Peroxide Industry Volume K Tons Forecast, by Application 2020 & 2033
- Table 45: Global Calcium Peroxide Industry Revenue Billion Forecast, by End-user Industry 2020 & 2033
- Table 46: Global Calcium Peroxide Industry Volume K Tons Forecast, by End-user Industry 2020 & 2033
- Table 47: Global Calcium Peroxide Industry Revenue Billion Forecast, by Country 2020 & 2033
- Table 48: Global Calcium Peroxide Industry Volume K Tons Forecast, by Country 2020 & 2033
- Table 49: Germany Calcium Peroxide Industry Revenue (Billion) Forecast, by Application 2020 & 2033
- Table 50: Germany Calcium Peroxide Industry Volume (K Tons) Forecast, by Application 2020 & 2033
- Table 51: United Kingdom Calcium Peroxide Industry Revenue (Billion) Forecast, by Application 2020 & 2033
- Table 52: United Kingdom Calcium Peroxide Industry Volume (K Tons) Forecast, by Application 2020 & 2033
- Table 53: Italy Calcium Peroxide Industry Revenue (Billion) Forecast, by Application 2020 & 2033
- Table 54: Italy Calcium Peroxide Industry Volume (K Tons) Forecast, by Application 2020 & 2033
- Table 55: France Calcium Peroxide Industry Revenue (Billion) Forecast, by Application 2020 & 2033
- Table 56: France Calcium Peroxide Industry Volume (K Tons) Forecast, by Application 2020 & 2033
- Table 57: Rest of Europe Calcium Peroxide Industry Revenue (Billion) Forecast, by Application 2020 & 2033
- Table 58: Rest of Europe Calcium Peroxide Industry Volume (K Tons) Forecast, by Application 2020 & 2033
- Table 59: Global Calcium Peroxide Industry Revenue Billion Forecast, by Grade 2020 & 2033
- Table 60: Global Calcium Peroxide Industry Volume K Tons Forecast, by Grade 2020 & 2033
- Table 61: Global Calcium Peroxide Industry Revenue Billion Forecast, by Application 2020 & 2033
- Table 62: Global Calcium Peroxide Industry Volume K Tons Forecast, by Application 2020 & 2033
- Table 63: Global Calcium Peroxide Industry Revenue Billion Forecast, by End-user Industry 2020 & 2033
- Table 64: Global Calcium Peroxide Industry Volume K Tons Forecast, by End-user Industry 2020 & 2033
- Table 65: Global Calcium Peroxide Industry Revenue Billion Forecast, by Country 2020 & 2033
- Table 66: Global Calcium Peroxide Industry Volume K Tons Forecast, by Country 2020 & 2033
- Table 67: Brazil Calcium Peroxide Industry Revenue (Billion) Forecast, by Application 2020 & 2033
- Table 68: Brazil Calcium Peroxide Industry Volume (K Tons) Forecast, by Application 2020 & 2033
- Table 69: Argentina Calcium Peroxide Industry Revenue (Billion) Forecast, by Application 2020 & 2033
- Table 70: Argentina Calcium Peroxide Industry Volume (K Tons) Forecast, by Application 2020 & 2033
- Table 71: Rest of South America Calcium Peroxide Industry Revenue (Billion) Forecast, by Application 2020 & 2033
- Table 72: Rest of South America Calcium Peroxide Industry Volume (K Tons) Forecast, by Application 2020 & 2033
- Table 73: Global Calcium Peroxide Industry Revenue Billion Forecast, by Grade 2020 & 2033
- Table 74: Global Calcium Peroxide Industry Volume K Tons Forecast, by Grade 2020 & 2033
- Table 75: Global Calcium Peroxide Industry Revenue Billion Forecast, by Application 2020 & 2033
- Table 76: Global Calcium Peroxide Industry Volume K Tons Forecast, by Application 2020 & 2033
- Table 77: Global Calcium Peroxide Industry Revenue Billion Forecast, by End-user Industry 2020 & 2033
- Table 78: Global Calcium Peroxide Industry Volume K Tons Forecast, by End-user Industry 2020 & 2033
- Table 79: Global Calcium Peroxide Industry Revenue Billion Forecast, by Country 2020 & 2033
- Table 80: Global Calcium Peroxide Industry Volume K Tons Forecast, by Country 2020 & 2033
- Table 81: Saudi Arabia Calcium Peroxide Industry Revenue (Billion) Forecast, by Application 2020 & 2033
- Table 82: Saudi Arabia Calcium Peroxide Industry Volume (K Tons) Forecast, by Application 2020 & 2033
- Table 83: South Africa Calcium Peroxide Industry Revenue (Billion) Forecast, by Application 2020 & 2033
- Table 84: South Africa Calcium Peroxide Industry Volume (K Tons) Forecast, by Application 2020 & 2033
- Table 85: Rest of Middle East and Africa Calcium Peroxide Industry Revenue (Billion) Forecast, by Application 2020 & 2033
- Table 86: Rest of Middle East and Africa Calcium Peroxide Industry Volume (K Tons) Forecast, by Application 2020 & 2033
Frequently Asked Questions
1. What is the projected Compound Annual Growth Rate (CAGR) of the Calcium Peroxide Industry?
The projected CAGR is approximately 3.64%.
2. Which companies are prominent players in the Calcium Peroxide Industry?
Key companies in the market include Nikunj Chemicals, Pioneer Enterprise, American Elements, Carus Group Inc, PeroxyChem, Sunway Lab, Zhengzhou Huize Biochemical Technology Co Ltd, Solvay SA, Mahalaxmi Enterprise, Shangyu Jie Hua Chemical Co, STP Chem Solutions Co Ltd, Noshly Pty Ltd.
3. What are the main segments of the Calcium Peroxide Industry?
The market segments include Grade, Application, End-user Industry.
4. Can you provide details about the market size?
The market size is estimated to be USD 2.36 Billion as of 2022.
5. What are some drivers contributing to market growth?
; Increase in Utilization as Dough Conditioner in the Food Industry; Increase in Usage in the Oral Care Industry.
6. What are the notable trends driving market growth?
Increasing Demand from Food and Beverage Industry.
7. Are there any restraints impacting market growth?
; Potential Hazardous Effects of Calcium Peroxide.
8. Can you provide examples of recent developments in the market?
N/A
9. What pricing options are available for accessing the report?
Pricing options include single-user, multi-user, and enterprise licenses priced at USD 4750, USD 5250, and USD 8750 respectively.
10. Is the market size provided in terms of value or volume?
The market size is provided in terms of value, measured in Billion and volume, measured in K Tons.
11. Are there any specific market keywords associated with the report?
Yes, the market keyword associated with the report is "Calcium Peroxide Industry," which aids in identifying and referencing the specific market segment covered.
12. How do I determine which pricing option suits my needs best?
The pricing options vary based on user requirements and access needs. Individual users may opt for single-user licenses, while businesses requiring broader access may choose multi-user or enterprise licenses for cost-effective access to the report.
13. Are there any additional resources or data provided in the Calcium Peroxide Industry report?
While the report offers comprehensive insights, it's advisable to review the specific contents or supplementary materials provided to ascertain if additional resources or data are available.
14. How can I stay updated on further developments or reports in the Calcium Peroxide Industry?
To stay informed about further developments, trends, and reports in the Calcium Peroxide Industry, consider subscribing to industry newsletters, following relevant companies and organizations, or regularly checking reputable industry news sources and publications.
Methodology
Step 1 - Identification of Relevant Samples Size from Population Database


Step 2 - Approaches for Defining Global Market Size (Value, Volume* & Price*)

Note*: In applicable scenarios
Step 3 - Data Sources
Primary Research
- Web Analytics
- Survey Reports
- Research Institute
- Latest Research Reports
- Opinion Leaders
Secondary Research
- Annual Reports
- White Paper
- Latest Press Release
- Industry Association
- Paid Database
- Investor Presentations

Step 4 - Data Triangulation
Involves using different sources of information in order to increase the validity of a study
These sources are likely to be stakeholders in a program - participants, other researchers, program staff, other community members, and so on.
Then we put all data in single framework & apply various statistical tools to find out the dynamic on the market.
During the analysis stage, feedback from the stakeholder groups would be compared to determine areas of agreement as well as areas of divergence