

Key Insights
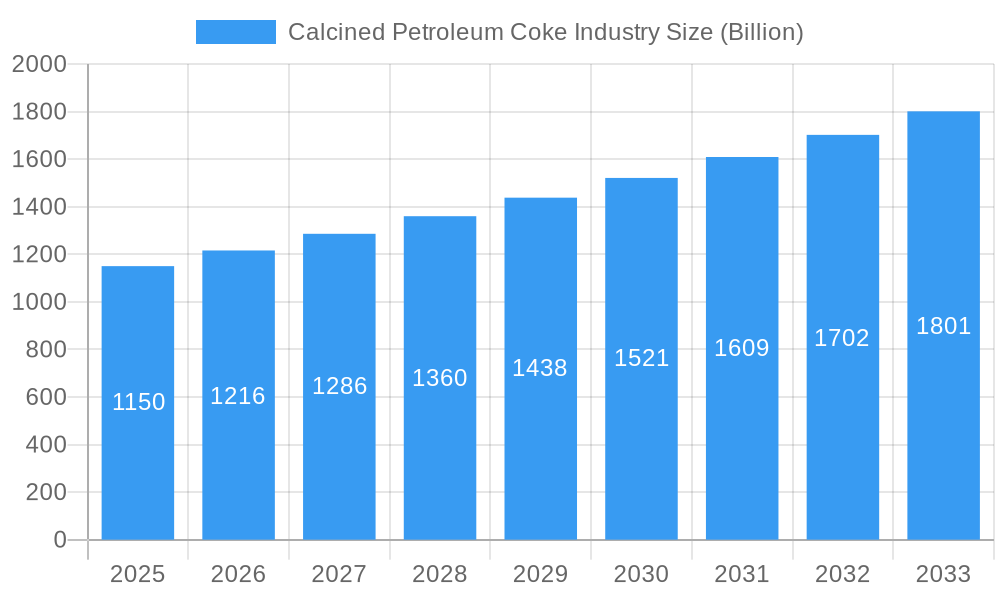
The global calcined petroleum coke (CPC) market, valued at $1.15 billion in 2025, is projected to experience robust growth, driven by increasing demand from the aluminum and steel industries. The 5.45% CAGR from 2025 to 2033 indicates a significant expansion, fueled primarily by the rising global production of aluminum, which heavily relies on CPC as a crucial reducing agent in the smelting process. Growth in the steel industry, particularly in developing economies, further contributes to the market's upward trajectory. Furthermore, the increasing adoption of green petroleum coke, a sustainable alternative, is expected to boost market share within the application segments. However, environmental concerns regarding CPC's carbon footprint and stringent regulations aimed at reducing emissions present significant challenges. The market is segmented by fuel grade and calcined coke, with fuel grade CPC dominating due to its extensive use in various industrial processes. Key players such as Oxbow Corporation, Petrocoque, and Rain Carbon Inc. are actively shaping market dynamics through strategic partnerships, capacity expansions, and technological advancements aimed at improving CPC production efficiency and reducing environmental impact. The Asia-Pacific region, particularly China and India, is projected to witness the highest growth rate, driven by rapid industrialization and expanding aluminum and steel production capacities. Competition is expected to intensify, particularly among large-scale producers, with a focus on cost optimization and the development of innovative, environmentally friendly CPC production methods.
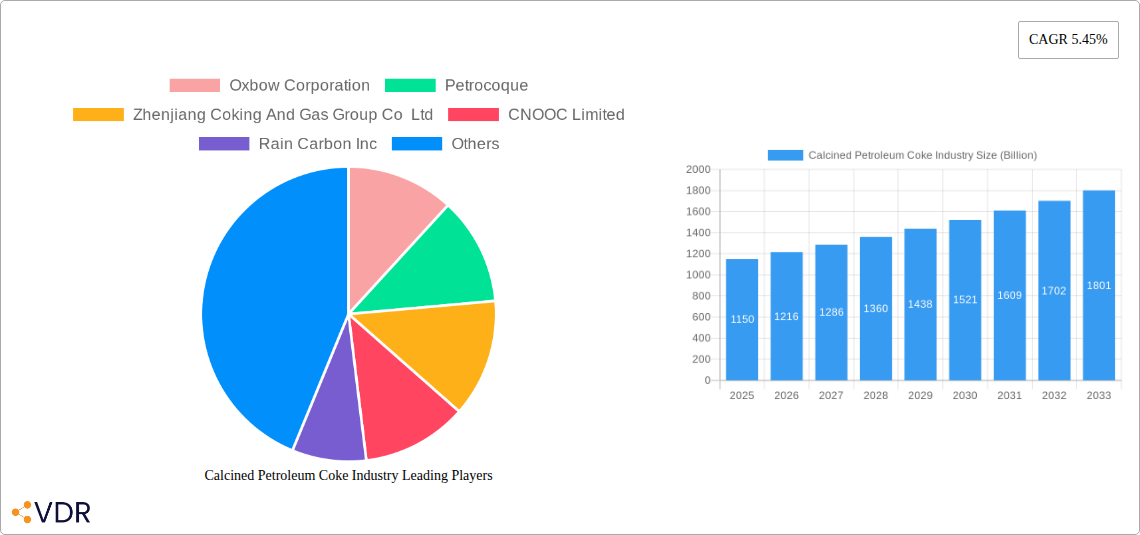
Calcined Petroleum Coke Industry Market Size (In Billion)
The competitive landscape is characterized by a blend of established multinational corporations and regional players. Differentiation among competitors primarily stems from the quality of CPC produced, logistical capabilities, pricing strategies, and sustainable manufacturing practices. North America and Europe, although possessing mature markets, are expected to exhibit steady growth driven by continuous demand from existing industries. The Middle East and Africa region, while currently exhibiting smaller market size, shows potential for growth owing to planned infrastructure developments and increasing industrial activities. The forecast period suggests a significant increase in market value, underpinned by consistent growth in the aluminum and steel sectors and gradual adoption of sustainable alternatives within the CPC market. Continued innovation in CPC production techniques and stricter environmental regulations will greatly influence the market's future trajectory.
Calcined Petroleum Coke Industry Company Market Share
Calcined Petroleum Coke Industry: A Comprehensive Market Report (2019-2033)
This comprehensive report provides an in-depth analysis of the global calcined petroleum coke (CPC) industry, encompassing market dynamics, growth trends, regional segmentation, product landscape, and key players. The study covers the period 2019-2033, with a focus on the forecast period 2025-2033 and a base year of 2025. The report is designed to provide valuable insights for industry professionals, investors, and stakeholders seeking to understand and capitalize on opportunities within this dynamic market. The total market size is estimated at xx Billion in 2025 and is expected to reach xx Billion by 2033.
Calcined Petroleum Coke Industry Market Dynamics & Structure
The calcined petroleum coke (CPC) industry operates within a moderately concentrated market, with a few dominant players controlling a substantial portion of global market share. Technological advancements are a pivotal force, especially in refining CPC quality and exploring novel applications across various sectors. However, the industry grapples with significant challenges stemming from stringent environmental regulations governing emissions and waste management, which directly impact production costs and operational strategies. Furthermore, the market faces competitive pressure from alternative carbon sources, while the landscape is continuously shaped by strategic mergers and acquisitions (M&A). The CPC industry's upstream linkage lies with the petroleum refining sector, and its downstream influence extends to critical markets such as aluminum smelting, cement manufacturing, and the production of various carbon-based products.
- Market Concentration: In 2025, the top 5 key players are estimated to collectively hold approximately xx% of the global calcined petroleum coke market share, indicating a concentrated yet competitive environment.
- Technological Innovation: Continuous innovation is centered on enhancing CPC purity, achieving lower sulfur content, and expanding its utility into new and diverse applications, thereby driving market value and differentiation.
- Regulatory Framework: A robust and evolving regulatory framework, particularly concerning environmental protection, air emissions, and responsible waste disposal, significantly influences production economics and mandates advanced operational practices.
- Competitive Substitutes: The market experiences competitive pressure from readily available alternative carbon sources, including various grades of coal and graphite, necessitating a focus on CPC's unique value propositions.
- End-User Demographics: The primary demand drivers originate from the aluminum production sector, the vast cement manufacturing industry, and the specialized carbon products industry, each representing substantial end-user segments.
- M&A Trends: Over the past five years, the sector has witnessed approximately xx strategic mergers and acquisitions, predominantly aimed at consolidating market presence, achieving economies of scale, and expanding geographical reach into promising new markets.
Calcined Petroleum Coke Industry Growth Trends & Insights
The global calcined petroleum coke market is charting a course of consistent and sustainable growth, largely propelled by the escalating demand from its principal end-use industries. During the historical period spanning 2019 to 2024, the market achieved a Compound Annual Growth Rate (CAGR) of xx%. Looking ahead, the forecast period from 2025 to 2033 is anticipated to experience a robust CAGR of xx%. This upward trajectory is underpinned by several key factors, including the significant expansion of global aluminum production, the steady growth within the cement industry, and the burgeoning demand for specialized carbon products. Technological advancements, characterized by improved and more efficient production processes and the development of higher-grade calcined petroleum coke, are further catalyzing market expansion. While still in its nascent stages, a gradual shift in consumer preferences towards more sustainable materials is also beginning to influence market dynamics. The adoption of fuel-grade CPC continues to be strong in certain regions, primarily due to its cost-effectiveness, whereas the integration of "green CPC" is steadily gaining momentum as environmental consciousness rises.
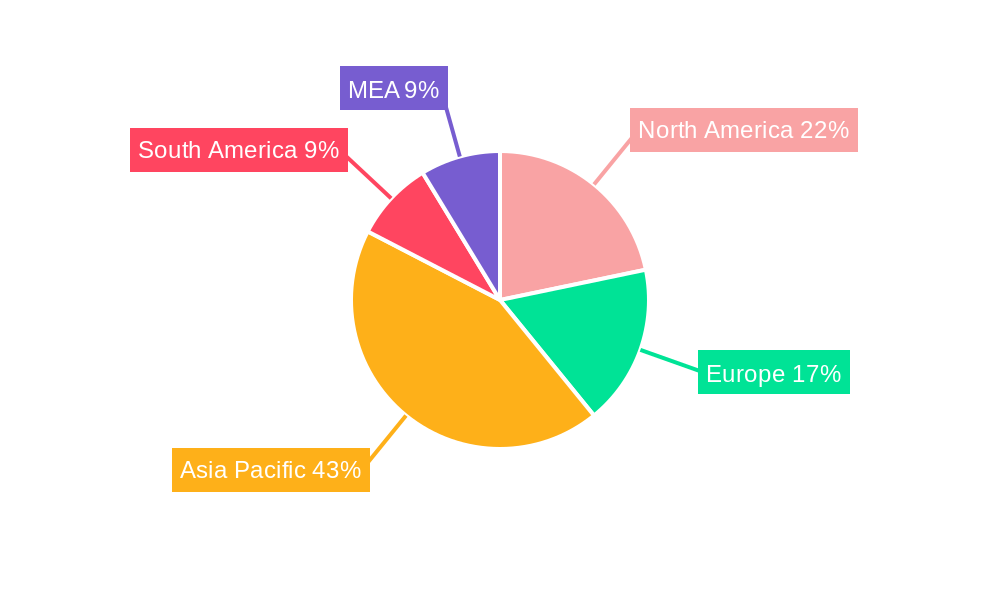
Dominant Regions, Countries, or Segments in Calcined Petroleum Coke Industry
Asia-Pacific dominates the global calcined petroleum coke market, driven by rapid industrialization, particularly in China and India. The region's robust aluminum and cement industries, coupled with supportive government policies, fuel high demand. North America and Europe also hold significant market share, although growth rates are comparatively slower. Within the segment breakdown:
Type: Fuel-grade CPC holds the largest market share due to its widespread use in various industrial applications.
Application: The aluminum industry is the largest consumer of CPC, followed by the cement and carbon products industries. Green petroleum coke applications are showing considerable growth potential.
Key Drivers in Asia-Pacific:
- Rapid industrialization and infrastructure development.
- Large-scale aluminum smelting and cement production capacities.
- Favorable government policies promoting industrial growth.
Market Share & Growth Potential: Asia-Pacific holds approximately xx% of the global market share in 2025 and is projected to maintain its dominance during the forecast period, with a growth potential of xx% by 2033. However, other regions, such as the Middle East, are expected to experience accelerated growth as petrochemical activities expand.
Calcined Petroleum Coke Industry Product Landscape
The calcined petroleum coke market offers various grades and types, catering to diverse end-user needs. Innovations focus on enhancing product quality, such as reducing impurities and improving consistency, to meet stringent industry requirements. Technological advancements have resulted in more efficient production processes, leading to higher yields and reduced production costs. The unique selling propositions include high carbon content, cost-effectiveness, and consistent quality. Future developments may focus on value-added products and applications addressing sustainability goals.
Key Drivers, Barriers & Challenges in Calcined Petroleum Coke Industry
Key Drivers:
- Robust Demand from Core Industries: A consistent and increasing demand from the aluminum and cement industries serves as a primary engine for market growth.
- Expanding Applications in Carbon Products: The diverse and growing use of calcined petroleum coke in the manufacturing of various specialized carbon products contributes significantly to market expansion.
- Growing Adoption of Green CPC: The increasing awareness and adoption of environmentally friendly "green CPC" applications are aligning with global sustainability initiatives and driving new market opportunities.
Key Challenges:
- Stringent Environmental Regulations: The industry faces significant hurdles due to strict environmental regulations concerning production processes, emissions control, and the responsible disposal of by-products, leading to increased operational costs and compliance burdens.
- Crude Oil Price Volatility: Fluctuations in crude oil prices have a direct impact on the cost of raw materials, which in turn affects the pricing and profitability of calcined petroleum coke.
- Competition from Alternative Materials: The market continually contends with competitive pressure from alternative carbon-based materials, requiring continuous innovation and value proposition reinforcement.
- Supply Chain Vulnerabilities: Geopolitical factors and unforeseen events can lead to significant supply chain disruptions. For instance, a reduction in supply of xx% was observed in 2022 due to X, highlighting the industry's susceptibility to external shocks.
Emerging Opportunities in Calcined Petroleum Coke Industry
- Novel Applications in Advanced Materials: There is a significant opportunity for research and development into novel applications of CPC in the creation of advanced materials, potentially opening up high-value market segments.
- Expansion into Emerging Markets: Growing industrial sectors in emerging economies present considerable opportunities for market expansion and increased CPC consumption.
- Focus on Sustainable Production: Embracing and investing in eco-friendly CPC production methods and applications is crucial for meeting global sustainability development goals and gaining a competitive edge.
- Innovation in Carbon Capture & Utilization: Advancements in carbon capture and utilization technologies offer a pathway to mitigate the environmental footprint of CPC production and potentially create new revenue streams.
Growth Accelerators in the Calcined Petroleum Coke Industry
Technological advancements, strategic partnerships between CPC producers and end-users, and focused market expansion into new geographical regions will accelerate long-term growth. Investment in research and development to enhance product quality and create new applications will be crucial. Sustainable production practices aligned with global environmental regulations will be another growth accelerator.
Key Players Shaping the Calcined Petroleum Coke Industry Market
- Oxbow Corporation
- Petrocoque
- Zhenjiang Coking And Gas Group Co Ltd
- CNOOC Limited
- Rain Carbon Inc
- Aluminium Bahrain B S C (Alba)
- Rio Tinto
- Numaligarh Refinery Limited
- Phillips 66 Company
- Maniayargroup
- Saudi Calcined Petroleum Coke Company (SCPC)
- BP PLC
- ELSID SA
Notable Milestones in Calcined Petroleum Coke Industry Sector
- January 2023: Phillips 66's strategic acquisition of DCP Midstream has significantly bolstered its standing within the petroleum coke market, with expectations of enhanced production capabilities and a greater market share.
- June 2022: ExxonMobil's pioneering research into the reprocessing of petroleum coke into graphene signals a promising avenue for developing value-added products and unlocking entirely new application domains for this versatile material.
In-Depth Calcined Petroleum Coke Industry Market Outlook
The calcined petroleum coke market is poised for continued growth, driven by the factors outlined above. Strategic investments in research and development, along with a focus on sustainable practices and the development of new applications, will unlock significant future potential. The industry's ability to adapt to environmental regulations and leverage technological advancements will be crucial for long-term success. Companies that can effectively integrate sustainability initiatives into their operations will be best positioned to capture future market opportunities.
Calcined Petroleum Coke Industry Segmentation
-
1. Type
- 1.1. Fuel Grade
- 1.2. Calcined Coke
-
2. Application
-
2.1. Green Petroleum Coke
- 2.1.1. Aluminum
- 2.1.2. Fuel
- 2.1.3. Iron and steel
- 2.1.4. Silicon Metal
- 2.1.5. Others (Bricks, Glass, Carbon Products, etc)
-
2.2. Calcined Petroleum Coke
- 2.2.1. Titanium Dioxide
- 2.2.2. Re-carburizing Market
- 2.2.3. Others (Needle Coke, Carbon Products, etc)
-
2.1. Green Petroleum Coke
Calcined Petroleum Coke Industry Segmentation By Geography
-
1. Asia Pacific
- 1.1. China
- 1.2. India
- 1.3. Japan
- 1.4. South Korea
- 1.5. ASEAN Countries
- 1.6. Rest of Asia Pacific
-
2. North America
- 2.1. United States
- 2.2. Canada
- 2.3. Mexico
-
3. Europe
- 3.1. Germany
- 3.2. United Kingdom
- 3.3. Italy
- 3.4. France
- 3.5. Spain
- 3.6. Rest of Europe
-
4. South America
- 4.1. Brazil
- 4.2. Argentina
- 4.3. Rest of South America
-
5. Middle East and Africa
- 5.1. Saudi Arabia
- 5.2. South Africa
- 5.3. Rest of Middle East and Africa
Calcined Petroleum Coke Industry Regional Market Share
Geographic Coverage of Calcined Petroleum Coke Industry
Calcined Petroleum Coke Industry REPORT HIGHLIGHTS
| Aspects | Details |
|---|---|
| Study Period | 2020-2034 |
| Base Year | 2025 |
| Estimated Year | 2026 |
| Forecast Period | 2026-2034 |
| Historical Period | 2020-2025 |
| Growth Rate | CAGR of 5.45% from 2020-2034 |
| Segmentation |
|
Table of Contents
- 1. Introduction
- 1.1. Research Scope
- 1.2. Market Segmentation
- 1.3. Research Objective
- 1.4. Definitions and Assumptions
- 2. Executive Summary
- 2.1. Market Snapshot
- 3. Market Dynamics
- 3.1. Market Drivers
- 3.2. Market Restrains
- 3.3. Market Trends
- 3.4. Market Opportunities
- 4. Market Factor Analysis
- 4.1. Porters Five Forces
- 4.1.1. Bargaining Power of Suppliers
- 4.1.2. Bargaining Power of Buyers
- 4.1.3. Threat of New Entrants
- 4.1.4. Threat of Substitutes
- 4.1.5. Competitive Rivalry
- 4.2. PESTEL analysis
- 4.3. BCG Analysis
- 4.3.1. Stars (High Growth, High Market Share)
- 4.3.2. Cash Cows (Low Growth, High Market Share)
- 4.3.3. Question Mark (High Growth, Low Market Share)
- 4.3.4. Dogs (Low Growth, Low Market Share)
- 4.4. Ansoff Matrix Analysis
- 4.5. Supply Chain Analysis
- 4.6. Regulatory Landscape
- 4.7. Current Market Potential and Opportunity Assessment (TAM–SAM–SOM Framework)
- 4.8. VDR Analyst Note
- 4.1. Porters Five Forces
- 5. Market Analysis, Insights and Forecast 2021-2033
- 5.1. Market Analysis, Insights and Forecast - by Type
- 5.1.1. Fuel Grade
- 5.1.2. Calcined Coke
- 5.2. Market Analysis, Insights and Forecast - by Application
- 5.2.1. Green Petroleum Coke
- 5.2.1.1. Aluminum
- 5.2.1.2. Fuel
- 5.2.1.3. Iron and steel
- 5.2.1.4. Silicon Metal
- 5.2.1.5. Others (Bricks, Glass, Carbon Products, etc)
- 5.2.2. Calcined Petroleum Coke
- 5.2.2.1. Titanium Dioxide
- 5.2.2.2. Re-carburizing Market
- 5.2.2.3. Others (Needle Coke, Carbon Products, etc)
- 5.2.1. Green Petroleum Coke
- 5.3. Market Analysis, Insights and Forecast - by Region
- 5.3.1. Asia Pacific
- 5.3.2. North America
- 5.3.3. Europe
- 5.3.4. South America
- 5.3.5. Middle East and Africa
- 5.1. Market Analysis, Insights and Forecast - by Type
- 6. Global Calcined Petroleum Coke Industry Analysis, Insights and Forecast, 2021-2033
- 6.1. Market Analysis, Insights and Forecast - by Type
- 6.1.1. Fuel Grade
- 6.1.2. Calcined Coke
- 6.2. Market Analysis, Insights and Forecast - by Application
- 6.2.1. Green Petroleum Coke
- 6.2.1.1. Aluminum
- 6.2.1.2. Fuel
- 6.2.1.3. Iron and steel
- 6.2.1.4. Silicon Metal
- 6.2.1.5. Others (Bricks, Glass, Carbon Products, etc)
- 6.2.2. Calcined Petroleum Coke
- 6.2.2.1. Titanium Dioxide
- 6.2.2.2. Re-carburizing Market
- 6.2.2.3. Others (Needle Coke, Carbon Products, etc)
- 6.2.1. Green Petroleum Coke
- 6.1. Market Analysis, Insights and Forecast - by Type
- 7. Asia Pacific Calcined Petroleum Coke Industry Analysis, Insights and Forecast, 2021-2033
- 7.1. Market Analysis, Insights and Forecast - by Type
- 7.1.1. Fuel Grade
- 7.1.2. Calcined Coke
- 7.2. Market Analysis, Insights and Forecast - by Application
- 7.2.1. Green Petroleum Coke
- 7.2.1.1. Aluminum
- 7.2.1.2. Fuel
- 7.2.1.3. Iron and steel
- 7.2.1.4. Silicon Metal
- 7.2.1.5. Others (Bricks, Glass, Carbon Products, etc)
- 7.2.2. Calcined Petroleum Coke
- 7.2.2.1. Titanium Dioxide
- 7.2.2.2. Re-carburizing Market
- 7.2.2.3. Others (Needle Coke, Carbon Products, etc)
- 7.2.1. Green Petroleum Coke
- 7.1. Market Analysis, Insights and Forecast - by Type
- 8. North America Calcined Petroleum Coke Industry Analysis, Insights and Forecast, 2021-2033
- 8.1. Market Analysis, Insights and Forecast - by Type
- 8.1.1. Fuel Grade
- 8.1.2. Calcined Coke
- 8.2. Market Analysis, Insights and Forecast - by Application
- 8.2.1. Green Petroleum Coke
- 8.2.1.1. Aluminum
- 8.2.1.2. Fuel
- 8.2.1.3. Iron and steel
- 8.2.1.4. Silicon Metal
- 8.2.1.5. Others (Bricks, Glass, Carbon Products, etc)
- 8.2.2. Calcined Petroleum Coke
- 8.2.2.1. Titanium Dioxide
- 8.2.2.2. Re-carburizing Market
- 8.2.2.3. Others (Needle Coke, Carbon Products, etc)
- 8.2.1. Green Petroleum Coke
- 8.1. Market Analysis, Insights and Forecast - by Type
- 9. Europe Calcined Petroleum Coke Industry Analysis, Insights and Forecast, 2021-2033
- 9.1. Market Analysis, Insights and Forecast - by Type
- 9.1.1. Fuel Grade
- 9.1.2. Calcined Coke
- 9.2. Market Analysis, Insights and Forecast - by Application
- 9.2.1. Green Petroleum Coke
- 9.2.1.1. Aluminum
- 9.2.1.2. Fuel
- 9.2.1.3. Iron and steel
- 9.2.1.4. Silicon Metal
- 9.2.1.5. Others (Bricks, Glass, Carbon Products, etc)
- 9.2.2. Calcined Petroleum Coke
- 9.2.2.1. Titanium Dioxide
- 9.2.2.2. Re-carburizing Market
- 9.2.2.3. Others (Needle Coke, Carbon Products, etc)
- 9.2.1. Green Petroleum Coke
- 9.1. Market Analysis, Insights and Forecast - by Type
- 10. South America Calcined Petroleum Coke Industry Analysis, Insights and Forecast, 2021-2033
- 10.1. Market Analysis, Insights and Forecast - by Type
- 10.1.1. Fuel Grade
- 10.1.2. Calcined Coke
- 10.2. Market Analysis, Insights and Forecast - by Application
- 10.2.1. Green Petroleum Coke
- 10.2.1.1. Aluminum
- 10.2.1.2. Fuel
- 10.2.1.3. Iron and steel
- 10.2.1.4. Silicon Metal
- 10.2.1.5. Others (Bricks, Glass, Carbon Products, etc)
- 10.2.2. Calcined Petroleum Coke
- 10.2.2.1. Titanium Dioxide
- 10.2.2.2. Re-carburizing Market
- 10.2.2.3. Others (Needle Coke, Carbon Products, etc)
- 10.2.1. Green Petroleum Coke
- 10.1. Market Analysis, Insights and Forecast - by Type
- 11. Middle East and Africa Calcined Petroleum Coke Industry Analysis, Insights and Forecast, 2021-2033
- 11.1. Market Analysis, Insights and Forecast - by Type
- 11.1.1. Fuel Grade
- 11.1.2. Calcined Coke
- 11.2. Market Analysis, Insights and Forecast - by Application
- 11.2.1. Green Petroleum Coke
- 11.2.1.1. Aluminum
- 11.2.1.2. Fuel
- 11.2.1.3. Iron and steel
- 11.2.1.4. Silicon Metal
- 11.2.1.5. Others (Bricks, Glass, Carbon Products, etc)
- 11.2.2. Calcined Petroleum Coke
- 11.2.2.1. Titanium Dioxide
- 11.2.2.2. Re-carburizing Market
- 11.2.2.3. Others (Needle Coke, Carbon Products, etc)
- 11.2.1. Green Petroleum Coke
- 11.1. Market Analysis, Insights and Forecast - by Type
- 12. Competitive Analysis
- 12.1. Company Profiles
- 12.1.1 Oxbow Corporation
- 12.1.1.1. Company Overview
- 12.1.1.2. Products
- 12.1.1.3. Company Financials
- 12.1.1.4. SWOT Analysis
- 12.1.2 Petrocoque
- 12.1.2.1. Company Overview
- 12.1.2.2. Products
- 12.1.2.3. Company Financials
- 12.1.2.4. SWOT Analysis
- 12.1.3 Zhenjiang Coking And Gas Group Co Ltd
- 12.1.3.1. Company Overview
- 12.1.3.2. Products
- 12.1.3.3. Company Financials
- 12.1.3.4. SWOT Analysis
- 12.1.4 CNOOC Limited
- 12.1.4.1. Company Overview
- 12.1.4.2. Products
- 12.1.4.3. Company Financials
- 12.1.4.4. SWOT Analysis
- 12.1.5 Rain Carbon Inc
- 12.1.5.1. Company Overview
- 12.1.5.2. Products
- 12.1.5.3. Company Financials
- 12.1.5.4. SWOT Analysis
- 12.1.6 Aluminium Bahrain B S C (Alba)
- 12.1.6.1. Company Overview
- 12.1.6.2. Products
- 12.1.6.3. Company Financials
- 12.1.6.4. SWOT Analysis
- 12.1.7 Rio Tinto
- 12.1.7.1. Company Overview
- 12.1.7.2. Products
- 12.1.7.3. Company Financials
- 12.1.7.4. SWOT Analysis
- 12.1.8 Numaligarh Refinery Limited
- 12.1.8.1. Company Overview
- 12.1.8.2. Products
- 12.1.8.3. Company Financials
- 12.1.8.4. SWOT Analysis
- 12.1.9 Phillips 66 Company
- 12.1.9.1. Company Overview
- 12.1.9.2. Products
- 12.1.9.3. Company Financials
- 12.1.9.4. SWOT Analysis
- 12.1.10 Maniayargroup
- 12.1.10.1. Company Overview
- 12.1.10.2. Products
- 12.1.10.3. Company Financials
- 12.1.10.4. SWOT Analysis
- 12.1.11 Saudi Calcined Petroleum Coke Company (SCPC)
- 12.1.11.1. Company Overview
- 12.1.11.2. Products
- 12.1.11.3. Company Financials
- 12.1.11.4. SWOT Analysis
- 12.1.12 BP PLC
- 12.1.12.1. Company Overview
- 12.1.12.2. Products
- 12.1.12.3. Company Financials
- 12.1.12.4. SWOT Analysis
- 12.1.13 ELSID SA
- 12.1.13.1. Company Overview
- 12.1.13.2. Products
- 12.1.13.3. Company Financials
- 12.1.13.4. SWOT Analysis
- 12.1.1 Oxbow Corporation
- 12.2. Market Entropy
- 12.2.1 Company's Key Areas Served
- 12.2.2 Recent Developments
- 12.3. Company Market Share Analysis 2025
- 12.3.1 Top 5 Companies Market Share Analysis
- 12.3.2 Top 3 Companies Market Share Analysis
- 12.4. List of Potential Customers
- 13. Research Methodology
List of Figures
- Figure 1: Global Calcined Petroleum Coke Industry Revenue Breakdown (Billion, %) by Region 2025 & 2033
- Figure 2: Global Calcined Petroleum Coke Industry Volume Breakdown (K Tons, %) by Region 2025 & 2033
- Figure 3: Asia Pacific Calcined Petroleum Coke Industry Revenue (Billion), by Type 2025 & 2033
- Figure 4: Asia Pacific Calcined Petroleum Coke Industry Volume (K Tons), by Type 2025 & 2033
- Figure 5: Asia Pacific Calcined Petroleum Coke Industry Revenue Share (%), by Type 2025 & 2033
- Figure 6: Asia Pacific Calcined Petroleum Coke Industry Volume Share (%), by Type 2025 & 2033
- Figure 7: Asia Pacific Calcined Petroleum Coke Industry Revenue (Billion), by Application 2025 & 2033
- Figure 8: Asia Pacific Calcined Petroleum Coke Industry Volume (K Tons), by Application 2025 & 2033
- Figure 9: Asia Pacific Calcined Petroleum Coke Industry Revenue Share (%), by Application 2025 & 2033
- Figure 10: Asia Pacific Calcined Petroleum Coke Industry Volume Share (%), by Application 2025 & 2033
- Figure 11: Asia Pacific Calcined Petroleum Coke Industry Revenue (Billion), by Country 2025 & 2033
- Figure 12: Asia Pacific Calcined Petroleum Coke Industry Volume (K Tons), by Country 2025 & 2033
- Figure 13: Asia Pacific Calcined Petroleum Coke Industry Revenue Share (%), by Country 2025 & 2033
- Figure 14: Asia Pacific Calcined Petroleum Coke Industry Volume Share (%), by Country 2025 & 2033
- Figure 15: North America Calcined Petroleum Coke Industry Revenue (Billion), by Type 2025 & 2033
- Figure 16: North America Calcined Petroleum Coke Industry Volume (K Tons), by Type 2025 & 2033
- Figure 17: North America Calcined Petroleum Coke Industry Revenue Share (%), by Type 2025 & 2033
- Figure 18: North America Calcined Petroleum Coke Industry Volume Share (%), by Type 2025 & 2033
- Figure 19: North America Calcined Petroleum Coke Industry Revenue (Billion), by Application 2025 & 2033
- Figure 20: North America Calcined Petroleum Coke Industry Volume (K Tons), by Application 2025 & 2033
- Figure 21: North America Calcined Petroleum Coke Industry Revenue Share (%), by Application 2025 & 2033
- Figure 22: North America Calcined Petroleum Coke Industry Volume Share (%), by Application 2025 & 2033
- Figure 23: North America Calcined Petroleum Coke Industry Revenue (Billion), by Country 2025 & 2033
- Figure 24: North America Calcined Petroleum Coke Industry Volume (K Tons), by Country 2025 & 2033
- Figure 25: North America Calcined Petroleum Coke Industry Revenue Share (%), by Country 2025 & 2033
- Figure 26: North America Calcined Petroleum Coke Industry Volume Share (%), by Country 2025 & 2033
- Figure 27: Europe Calcined Petroleum Coke Industry Revenue (Billion), by Type 2025 & 2033
- Figure 28: Europe Calcined Petroleum Coke Industry Volume (K Tons), by Type 2025 & 2033
- Figure 29: Europe Calcined Petroleum Coke Industry Revenue Share (%), by Type 2025 & 2033
- Figure 30: Europe Calcined Petroleum Coke Industry Volume Share (%), by Type 2025 & 2033
- Figure 31: Europe Calcined Petroleum Coke Industry Revenue (Billion), by Application 2025 & 2033
- Figure 32: Europe Calcined Petroleum Coke Industry Volume (K Tons), by Application 2025 & 2033
- Figure 33: Europe Calcined Petroleum Coke Industry Revenue Share (%), by Application 2025 & 2033
- Figure 34: Europe Calcined Petroleum Coke Industry Volume Share (%), by Application 2025 & 2033
- Figure 35: Europe Calcined Petroleum Coke Industry Revenue (Billion), by Country 2025 & 2033
- Figure 36: Europe Calcined Petroleum Coke Industry Volume (K Tons), by Country 2025 & 2033
- Figure 37: Europe Calcined Petroleum Coke Industry Revenue Share (%), by Country 2025 & 2033
- Figure 38: Europe Calcined Petroleum Coke Industry Volume Share (%), by Country 2025 & 2033
- Figure 39: South America Calcined Petroleum Coke Industry Revenue (Billion), by Type 2025 & 2033
- Figure 40: South America Calcined Petroleum Coke Industry Volume (K Tons), by Type 2025 & 2033
- Figure 41: South America Calcined Petroleum Coke Industry Revenue Share (%), by Type 2025 & 2033
- Figure 42: South America Calcined Petroleum Coke Industry Volume Share (%), by Type 2025 & 2033
- Figure 43: South America Calcined Petroleum Coke Industry Revenue (Billion), by Application 2025 & 2033
- Figure 44: South America Calcined Petroleum Coke Industry Volume (K Tons), by Application 2025 & 2033
- Figure 45: South America Calcined Petroleum Coke Industry Revenue Share (%), by Application 2025 & 2033
- Figure 46: South America Calcined Petroleum Coke Industry Volume Share (%), by Application 2025 & 2033
- Figure 47: South America Calcined Petroleum Coke Industry Revenue (Billion), by Country 2025 & 2033
- Figure 48: South America Calcined Petroleum Coke Industry Volume (K Tons), by Country 2025 & 2033
- Figure 49: South America Calcined Petroleum Coke Industry Revenue Share (%), by Country 2025 & 2033
- Figure 50: South America Calcined Petroleum Coke Industry Volume Share (%), by Country 2025 & 2033
- Figure 51: Middle East and Africa Calcined Petroleum Coke Industry Revenue (Billion), by Type 2025 & 2033
- Figure 52: Middle East and Africa Calcined Petroleum Coke Industry Volume (K Tons), by Type 2025 & 2033
- Figure 53: Middle East and Africa Calcined Petroleum Coke Industry Revenue Share (%), by Type 2025 & 2033
- Figure 54: Middle East and Africa Calcined Petroleum Coke Industry Volume Share (%), by Type 2025 & 2033
- Figure 55: Middle East and Africa Calcined Petroleum Coke Industry Revenue (Billion), by Application 2025 & 2033
- Figure 56: Middle East and Africa Calcined Petroleum Coke Industry Volume (K Tons), by Application 2025 & 2033
- Figure 57: Middle East and Africa Calcined Petroleum Coke Industry Revenue Share (%), by Application 2025 & 2033
- Figure 58: Middle East and Africa Calcined Petroleum Coke Industry Volume Share (%), by Application 2025 & 2033
- Figure 59: Middle East and Africa Calcined Petroleum Coke Industry Revenue (Billion), by Country 2025 & 2033
- Figure 60: Middle East and Africa Calcined Petroleum Coke Industry Volume (K Tons), by Country 2025 & 2033
- Figure 61: Middle East and Africa Calcined Petroleum Coke Industry Revenue Share (%), by Country 2025 & 2033
- Figure 62: Middle East and Africa Calcined Petroleum Coke Industry Volume Share (%), by Country 2025 & 2033
List of Tables
- Table 1: Global Calcined Petroleum Coke Industry Revenue Billion Forecast, by Type 2020 & 2033
- Table 2: Global Calcined Petroleum Coke Industry Volume K Tons Forecast, by Type 2020 & 2033
- Table 3: Global Calcined Petroleum Coke Industry Revenue Billion Forecast, by Application 2020 & 2033
- Table 4: Global Calcined Petroleum Coke Industry Volume K Tons Forecast, by Application 2020 & 2033
- Table 5: Global Calcined Petroleum Coke Industry Revenue Billion Forecast, by Region 2020 & 2033
- Table 6: Global Calcined Petroleum Coke Industry Volume K Tons Forecast, by Region 2020 & 2033
- Table 7: Global Calcined Petroleum Coke Industry Revenue Billion Forecast, by Type 2020 & 2033
- Table 8: Global Calcined Petroleum Coke Industry Volume K Tons Forecast, by Type 2020 & 2033
- Table 9: Global Calcined Petroleum Coke Industry Revenue Billion Forecast, by Application 2020 & 2033
- Table 10: Global Calcined Petroleum Coke Industry Volume K Tons Forecast, by Application 2020 & 2033
- Table 11: Global Calcined Petroleum Coke Industry Revenue Billion Forecast, by Country 2020 & 2033
- Table 12: Global Calcined Petroleum Coke Industry Volume K Tons Forecast, by Country 2020 & 2033
- Table 13: China Calcined Petroleum Coke Industry Revenue (Billion) Forecast, by Application 2020 & 2033
- Table 14: China Calcined Petroleum Coke Industry Volume (K Tons) Forecast, by Application 2020 & 2033
- Table 15: India Calcined Petroleum Coke Industry Revenue (Billion) Forecast, by Application 2020 & 2033
- Table 16: India Calcined Petroleum Coke Industry Volume (K Tons) Forecast, by Application 2020 & 2033
- Table 17: Japan Calcined Petroleum Coke Industry Revenue (Billion) Forecast, by Application 2020 & 2033
- Table 18: Japan Calcined Petroleum Coke Industry Volume (K Tons) Forecast, by Application 2020 & 2033
- Table 19: South Korea Calcined Petroleum Coke Industry Revenue (Billion) Forecast, by Application 2020 & 2033
- Table 20: South Korea Calcined Petroleum Coke Industry Volume (K Tons) Forecast, by Application 2020 & 2033
- Table 21: ASEAN Countries Calcined Petroleum Coke Industry Revenue (Billion) Forecast, by Application 2020 & 2033
- Table 22: ASEAN Countries Calcined Petroleum Coke Industry Volume (K Tons) Forecast, by Application 2020 & 2033
- Table 23: Rest of Asia Pacific Calcined Petroleum Coke Industry Revenue (Billion) Forecast, by Application 2020 & 2033
- Table 24: Rest of Asia Pacific Calcined Petroleum Coke Industry Volume (K Tons) Forecast, by Application 2020 & 2033
- Table 25: Global Calcined Petroleum Coke Industry Revenue Billion Forecast, by Type 2020 & 2033
- Table 26: Global Calcined Petroleum Coke Industry Volume K Tons Forecast, by Type 2020 & 2033
- Table 27: Global Calcined Petroleum Coke Industry Revenue Billion Forecast, by Application 2020 & 2033
- Table 28: Global Calcined Petroleum Coke Industry Volume K Tons Forecast, by Application 2020 & 2033
- Table 29: Global Calcined Petroleum Coke Industry Revenue Billion Forecast, by Country 2020 & 2033
- Table 30: Global Calcined Petroleum Coke Industry Volume K Tons Forecast, by Country 2020 & 2033
- Table 31: United States Calcined Petroleum Coke Industry Revenue (Billion) Forecast, by Application 2020 & 2033
- Table 32: United States Calcined Petroleum Coke Industry Volume (K Tons) Forecast, by Application 2020 & 2033
- Table 33: Canada Calcined Petroleum Coke Industry Revenue (Billion) Forecast, by Application 2020 & 2033
- Table 34: Canada Calcined Petroleum Coke Industry Volume (K Tons) Forecast, by Application 2020 & 2033
- Table 35: Mexico Calcined Petroleum Coke Industry Revenue (Billion) Forecast, by Application 2020 & 2033
- Table 36: Mexico Calcined Petroleum Coke Industry Volume (K Tons) Forecast, by Application 2020 & 2033
- Table 37: Global Calcined Petroleum Coke Industry Revenue Billion Forecast, by Type 2020 & 2033
- Table 38: Global Calcined Petroleum Coke Industry Volume K Tons Forecast, by Type 2020 & 2033
- Table 39: Global Calcined Petroleum Coke Industry Revenue Billion Forecast, by Application 2020 & 2033
- Table 40: Global Calcined Petroleum Coke Industry Volume K Tons Forecast, by Application 2020 & 2033
- Table 41: Global Calcined Petroleum Coke Industry Revenue Billion Forecast, by Country 2020 & 2033
- Table 42: Global Calcined Petroleum Coke Industry Volume K Tons Forecast, by Country 2020 & 2033
- Table 43: Germany Calcined Petroleum Coke Industry Revenue (Billion) Forecast, by Application 2020 & 2033
- Table 44: Germany Calcined Petroleum Coke Industry Volume (K Tons) Forecast, by Application 2020 & 2033
- Table 45: United Kingdom Calcined Petroleum Coke Industry Revenue (Billion) Forecast, by Application 2020 & 2033
- Table 46: United Kingdom Calcined Petroleum Coke Industry Volume (K Tons) Forecast, by Application 2020 & 2033
- Table 47: Italy Calcined Petroleum Coke Industry Revenue (Billion) Forecast, by Application 2020 & 2033
- Table 48: Italy Calcined Petroleum Coke Industry Volume (K Tons) Forecast, by Application 2020 & 2033
- Table 49: France Calcined Petroleum Coke Industry Revenue (Billion) Forecast, by Application 2020 & 2033
- Table 50: France Calcined Petroleum Coke Industry Volume (K Tons) Forecast, by Application 2020 & 2033
- Table 51: Spain Calcined Petroleum Coke Industry Revenue (Billion) Forecast, by Application 2020 & 2033
- Table 52: Spain Calcined Petroleum Coke Industry Volume (K Tons) Forecast, by Application 2020 & 2033
- Table 53: Rest of Europe Calcined Petroleum Coke Industry Revenue (Billion) Forecast, by Application 2020 & 2033
- Table 54: Rest of Europe Calcined Petroleum Coke Industry Volume (K Tons) Forecast, by Application 2020 & 2033
- Table 55: Global Calcined Petroleum Coke Industry Revenue Billion Forecast, by Type 2020 & 2033
- Table 56: Global Calcined Petroleum Coke Industry Volume K Tons Forecast, by Type 2020 & 2033
- Table 57: Global Calcined Petroleum Coke Industry Revenue Billion Forecast, by Application 2020 & 2033
- Table 58: Global Calcined Petroleum Coke Industry Volume K Tons Forecast, by Application 2020 & 2033
- Table 59: Global Calcined Petroleum Coke Industry Revenue Billion Forecast, by Country 2020 & 2033
- Table 60: Global Calcined Petroleum Coke Industry Volume K Tons Forecast, by Country 2020 & 2033
- Table 61: Brazil Calcined Petroleum Coke Industry Revenue (Billion) Forecast, by Application 2020 & 2033
- Table 62: Brazil Calcined Petroleum Coke Industry Volume (K Tons) Forecast, by Application 2020 & 2033
- Table 63: Argentina Calcined Petroleum Coke Industry Revenue (Billion) Forecast, by Application 2020 & 2033
- Table 64: Argentina Calcined Petroleum Coke Industry Volume (K Tons) Forecast, by Application 2020 & 2033
- Table 65: Rest of South America Calcined Petroleum Coke Industry Revenue (Billion) Forecast, by Application 2020 & 2033
- Table 66: Rest of South America Calcined Petroleum Coke Industry Volume (K Tons) Forecast, by Application 2020 & 2033
- Table 67: Global Calcined Petroleum Coke Industry Revenue Billion Forecast, by Type 2020 & 2033
- Table 68: Global Calcined Petroleum Coke Industry Volume K Tons Forecast, by Type 2020 & 2033
- Table 69: Global Calcined Petroleum Coke Industry Revenue Billion Forecast, by Application 2020 & 2033
- Table 70: Global Calcined Petroleum Coke Industry Volume K Tons Forecast, by Application 2020 & 2033
- Table 71: Global Calcined Petroleum Coke Industry Revenue Billion Forecast, by Country 2020 & 2033
- Table 72: Global Calcined Petroleum Coke Industry Volume K Tons Forecast, by Country 2020 & 2033
- Table 73: Saudi Arabia Calcined Petroleum Coke Industry Revenue (Billion) Forecast, by Application 2020 & 2033
- Table 74: Saudi Arabia Calcined Petroleum Coke Industry Volume (K Tons) Forecast, by Application 2020 & 2033
- Table 75: South Africa Calcined Petroleum Coke Industry Revenue (Billion) Forecast, by Application 2020 & 2033
- Table 76: South Africa Calcined Petroleum Coke Industry Volume (K Tons) Forecast, by Application 2020 & 2033
- Table 77: Rest of Middle East and Africa Calcined Petroleum Coke Industry Revenue (Billion) Forecast, by Application 2020 & 2033
- Table 78: Rest of Middle East and Africa Calcined Petroleum Coke Industry Volume (K Tons) Forecast, by Application 2020 & 2033
Frequently Asked Questions
1. What is the projected Compound Annual Growth Rate (CAGR) of the Calcined Petroleum Coke Industry?
The projected CAGR is approximately 5.45%.
2. Which companies are prominent players in the Calcined Petroleum Coke Industry?
Key companies in the market include Oxbow Corporation, Petrocoque, Zhenjiang Coking And Gas Group Co Ltd, CNOOC Limited, Rain Carbon Inc, Aluminium Bahrain B S C (Alba), Rio Tinto, Numaligarh Refinery Limited, Phillips 66 Company, Maniayargroup, Saudi Calcined Petroleum Coke Company (SCPC), BP PLC, ELSID SA.
3. What are the main segments of the Calcined Petroleum Coke Industry?
The market segments include Type, Application.
4. Can you provide details about the market size?
The market size is estimated to be USD 1.15 Billion as of 2022.
5. What are some drivers contributing to market growth?
Increasing Demand from Aluminum Applications; Other Drivers.
6. What are the notable trends driving market growth?
Aluminium Segment to Drive the Market Growth.
7. Are there any restraints impacting market growth?
Fluctuating Prices for Raw Materials; Other Restraints.
8. Can you provide examples of recent developments in the market?
January 2023: Phillips 66 and DCP Midstream, LP announced a definitive agreement under which Phillips 66 will acquire all publicly traded standard units representing limited partner interests in DCP Midstream for cash consideration of USD 41.75 per standard unit, increasing its economic interest in DCP Midstream to 86.8%. It will strengthen the corporation and, in specific ways, boost the market productivity of petroleum coke.
9. What pricing options are available for accessing the report?
Pricing options include single-user, multi-user, and enterprise licenses priced at USD 4750, USD 5250, and USD 8750 respectively.
10. Is the market size provided in terms of value or volume?
The market size is provided in terms of value, measured in Billion and volume, measured in K Tons.
11. Are there any specific market keywords associated with the report?
Yes, the market keyword associated with the report is "Calcined Petroleum Coke Industry," which aids in identifying and referencing the specific market segment covered.
12. How do I determine which pricing option suits my needs best?
The pricing options vary based on user requirements and access needs. Individual users may opt for single-user licenses, while businesses requiring broader access may choose multi-user or enterprise licenses for cost-effective access to the report.
13. Are there any additional resources or data provided in the Calcined Petroleum Coke Industry report?
While the report offers comprehensive insights, it's advisable to review the specific contents or supplementary materials provided to ascertain if additional resources or data are available.
14. How can I stay updated on further developments or reports in the Calcined Petroleum Coke Industry?
To stay informed about further developments, trends, and reports in the Calcined Petroleum Coke Industry, consider subscribing to industry newsletters, following relevant companies and organizations, or regularly checking reputable industry news sources and publications.
Methodology
Step 1 - Identification of Relevant Samples Size from Population Database


Step 2 - Approaches for Defining Global Market Size (Value, Volume* & Price*)

Note*: In applicable scenarios
Step 3 - Data Sources
Primary Research
- Web Analytics
- Survey Reports
- Research Institute
- Latest Research Reports
- Opinion Leaders
Secondary Research
- Annual Reports
- White Paper
- Latest Press Release
- Industry Association
- Paid Database
- Investor Presentations

Step 4 - Data Triangulation
Involves using different sources of information in order to increase the validity of a study
These sources are likely to be stakeholders in a program - participants, other researchers, program staff, other community members, and so on.
Then we put all data in single framework & apply various statistical tools to find out the dynamic on the market.
During the analysis stage, feedback from the stakeholder groups would be compared to determine areas of agreement as well as areas of divergence